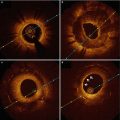
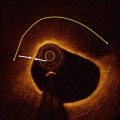
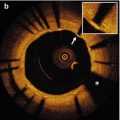
Fig. 6.1
Representative OCT images of coronary plaque characteristics. (a) Fibrous plaque; (b) Thin-cap fibroatherma: fibrous cap <65 μm (arrows) covering a lipid-rich plaque; (c) Calcification (asterisks); (d) Neovascularization (arrows); (e) Macrophage accumulation (arrows); (f) Cholesterol crystal (arrow)
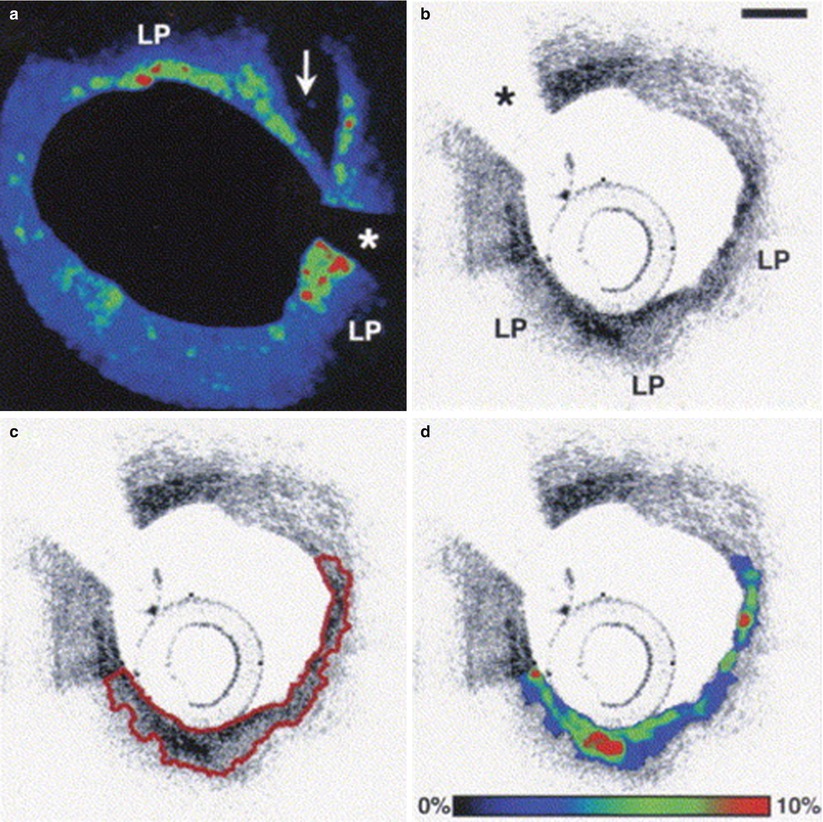
Fig. 6.2
Representative case of fibrous cap segmentation and macrophage density assessment. (a) Color-coded map of normalized standard deviation (NSD) values at the site of disruption (arrow) of a lipid-rich plaque (LP). The area with green-to-red colors represents a region with high macrophage density; (b) OCT image of lipid-rich plaque (LP); (c) Example of fibrous cap segmentation (red line); (d) Color-coded map of NSD values in the same segmented area. Asterisks correspond to wire artifact. Scale bare = 500 μm (From MacNeill et al. [19])
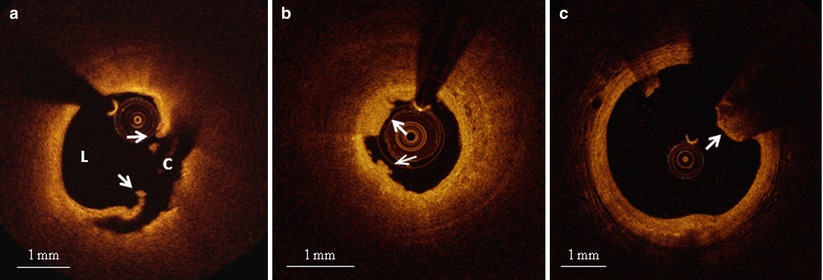
Fig. 6.3
Representative OCT images of various culprit plaque morphologies. (a) Plaque rupture: disrupted fibrous cap (arrows) leading to a communication between coronary lumen (L) and plaque cavity (C); (b) Plaque erosion: thrombus (arrows) overlying a plaque without any signs of rupture; (c) Calcified nodule: protruding, superficial, and nodular calcium (arrow)
6.2 Clinical Presentations and OCT Coronary Plaque Characteristics
Most patients presenting with ACS or dying of cardiovascular death exhibit thrombus overlying a complicated coronary plaque [22, 23]. Although plaque rupture is considered the most frequent plaque complication responsible for ACS, alternative mechanisms of plaque instability triggering coronary thrombosis have been described in pathology studies [10], and, recently, in vivo using OCT [22, 24]. Among these, plaque erosion accounts for about one third of cases, particularly in young women and smokers, and calcified nodules for 5–8 % of cases [10, 22]. However, several other mechanisms can be responsible for ACS, such as a dynamic obstruction due to spasm of an epicardial coronary artery, coronary embolism, coronary dissection, intraplaque hemorrhage or hematoma [22, 25, 26]. This considerable variety of coronary substrates, along with the grade of deriving luminal thrombosis and the myocardial vulnerability to ischemia, can determine a spectrum of clinical presentations, ranging from sudden cardiac death (SCD) or acute myocardial infarction (AMI), with or without ST-segment changes, to unstable angina pectoris (UAP) [21]. In contrast, stable angina pectoris (SAP) arises from a mismatch of blood supply and demand, typically caused by a severe, flow-limiting stenosis without plaque disruption or local thrombosis [27]. Several OCT studies have tried to explore the differences among the various clinical presentations of CAD, with the goal of clarifying pathogenic mechanisms and identifying new diagnostic algorithms and therapeutic targets.
In 2005, our group investigated, for the first time, the differences in OCT coronary plaque features in patients with various clinical coronary presentations [6]. Specifically, the detailed coronary plaque characteristics at the culprit lesion were compared among patients with ST-elevation myocardial infarction (STEMI), non-ST-elevation ACS (including NSTEMI and UAP), and SAP. That study showed that the prevalence of lipid-rich plaques tended to be higher in patients with STEMI or NSTE-ACS than in those with SAP (90 % vs. 75 % vs. 59 %, respectively, p = 0.09). Importantly, there was a significant difference among the three groups in fibrous cap thickness (median value: 47.0 μm [STEMI] vs. 53.8 μm [NSTE-ACS] vs. 102.6 μm [SAP], p = 0.034) and in the prevalence of TCFA (72 % [STEMI] vs. 50 % [NSTE-ACS] vs. 20 % [SAP], p = 0.012) (Fig. 6.4). In contrast, patients with SAP showed a higher prevalence of calcifications compared to those with STEMI and NSTE-ACS (10 % [STEMI] vs. 15 % [NSTE-ACS] vs. 41 % [SAP], p = 0.049). These findings not only confirmed for the first time in living humans what had previously only been observed in cadavers [23], but also underscored the importance of thin fibrous cap and large lipid burden for plaque vulnerability and the development of ACS.
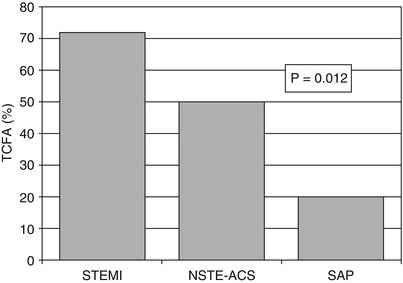
Fig. 6.4
Frequency of TCFA according to the clinical presentation. The prevalence of TCFA was higher in patients with STEMI (72 %) than in those with NSTE-ACS (50 %) and stable angina (20 %) (Adapted from Jang et al. [6])
The degree and distribution of macrophage infiltration in relation to the clinical presentation were studied in this cohort [19]. Pathology studies had previously suggested the role of macrophages in plaque instability, with most of plaque ruptures showing high degrees of macrophage infiltration inside the fibrous cap [10]. In this in vivo OCT study, macrophage densities in culprit and non-culprit lesions were assessed in patients presenting with STEMI, UAP, and SAP, by measuring the normalized standard deviation of the RAW OCT signal, a method validated against histology by the same group [18] (See Fig. 6.2). Interestingly, lipid-rich plaques in patients with STEMI and UAP showed significantly greater macrophage density compared to those in stable patients (5.54 ± 1.48 % vs. 5.86 ± 2.01 % vs. 4.14 ± 1.81 %, p = 0.002 and p < 0.001, respectively). When STEMI and UAP were combined into a single group of patients with unstable presentation, even the macrophage density in fibrous plaques was higher than that measured in patients with a stable presentation (5.41 ± 1.10 % vs. 4.43 ± 1.46 %, p = 0.025). For every patient, there was significant correlation between the macrophage density at the culprit lesion and that at the non-culprit lesions (r = 0.66, y = 0.88x + 0.43, p = 0.01). Macrophage density was also greater at the ruptured sites of a plaque compared to at the adjacent non-ruptured sites (p = 0.002). Superficial macrophage infiltration (<50 μm from the luminal surface) was a stronger predictor of unstable clinical presentation compared to a deeper macrophage infiltration (>50 μm) in culprit lesions (p = 0.035), but not in non-culprit lesions. These results suggested, for the first time in vivo, the correlation between macrophage density and the severity of clinical presentation, with greater densities in patients with acute presentation as compared to those with stable clinical presentation [19]. Furthermore, these data proved the multi-focal nature of inflammation in symptomatic CAD, and the possible role of macrophages in the development of plaque rupture and acute coronary events [19]. The disruption of the fibrous cap is, in fact, a consequence of the imbalance between the strength of the fibrous cap and forces impinging on it [28]. In this context, activated macrophages, overexpressing matrix metalloproteinases (MMPs) and elastolytic cathepsins, may play an important role, by increasing collagen degradation, reducing collagen synthesis, and inducing the apoptosis of smooth muscle cells [29].
Inspired by pathology observations of differences in the morphology of a ruptured plaque depending on level of exertion at the time of the SCD [30], Tanaka et al. conducted an elegant study investigating the relation between the morphology of ruptured plaque and the level of patient activity at the onset of ACS [31]. Interestingly, the characteristics and location of plaque rupture appeared to correlate with the clinical scenario: specifically, patients developing ACS at rest, compared to those developing ACS during exertion, had a thicker fibrous cap (50 μm vs. 90 μm, p < 0.01), and were more likely to have a plaque ruptured at the shoulder (57 % vs. 93 %, p = 0.014), and overlying thrombus (73 % vs. 96 %, p = 0.04). In addition, fibrous-cap thickness correlated positively with the level of activity at the onset of ACS (Fig. 6.5). These results emphasized the concept that plaque rupture may not infrequently develop from thick-cap fibroatheroma, and that the level of patient activity at the time of the acute presentation may have a role in determining this event. Later on, the same group looked at the differences in culprit plaque morphologies between patients with STEMI and NSTEMI [32]. The prevalence of plaque rupture was higher in patients with STEMI compared to those with NSTEMI (70 % vs. 47 %, p = 0.033), as well as the prevalence of TCFA (78 % vs. 49 %, p = 0.008) and red thrombus (78 % vs. 27 %, p < 0.001). Interestingly, patients with STEMI showed more frequently a plaque rupture with an aperture against the direction of coronary flow compared to those with NSTEMI (46 % vs. 17 %, p = 0.036) (Figs. 6.6 and 6.7).
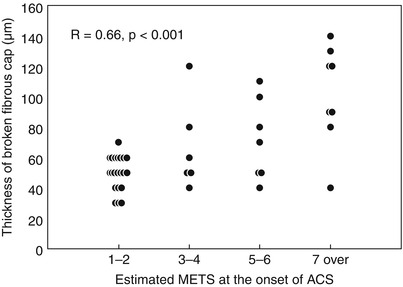
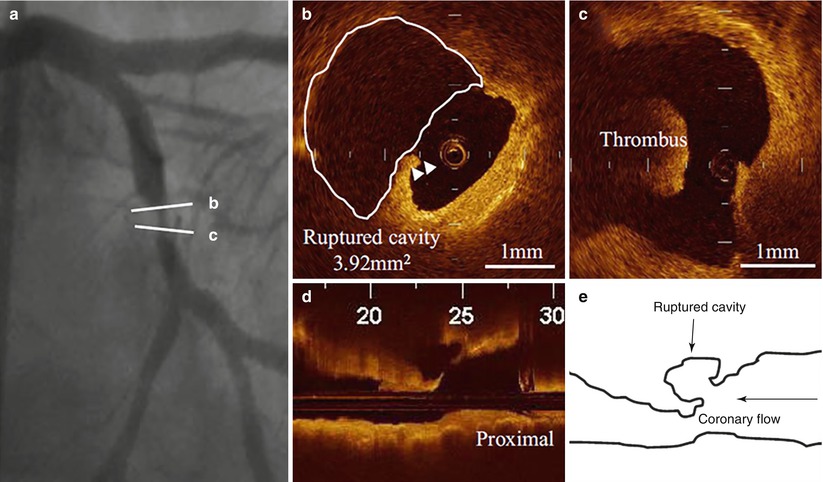
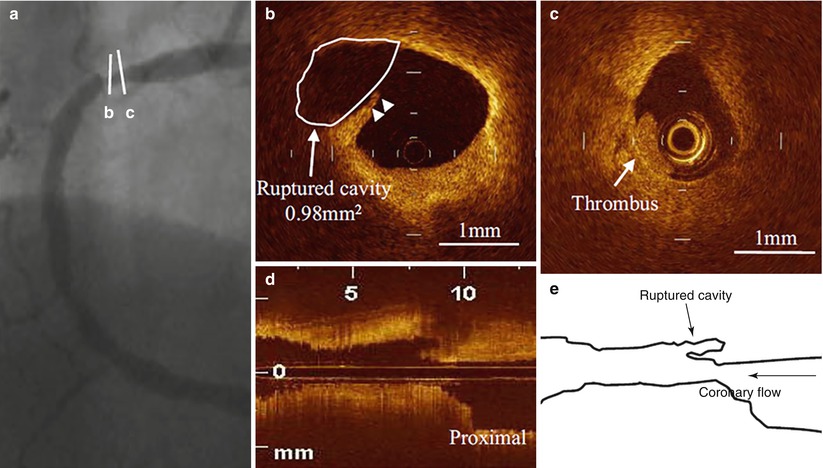
Fig. 6.5
Correlation between fibrous cap thickness and estimated MET score. Positive correlation between fibrous cap thickness and level of activity at the onset of ACS (From Tanaka A. et al. [31])
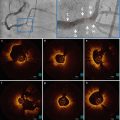
Fig. 6.6
Culprit plaque morphology in a patient with STEMI. (a) Coronary angiogram showing a complex lesion in the mid left circumflex artery; (b) Disrupted fibrous cap (arrowheads) with a large plaque cavity (white line); (c) Red thrombus in proximity of the ruptured plaque; (d) Longitudinal OCT view showing a ruptured plaque with an aperture against the direction of coronary flow; (e) Schematic representation of the same ruptured plaque (From Ino et al. [32])
Fig. 6.7
Culprit plaque morphology in a patient with NSTE-ACS. (a) Coronary angiogram showing a severe stenosis in the proximal right coronary artery; (b) Disrupted fibrous cap (arrowheads) with a small plaque cavity (white line and arrow); (c) White thrombus in proximity of the ruptured plaque; (d) Longitudinal OCT view showing a ruptured plaque with an aperture along the direction of coronary flow; (e) Schematic representation of the same ruptured plaque (From Ino et al. [32])
Due to the heterogeneous clinical presentation of ACS, classification schemes based on clinical features can be useful to stratify risk, predict prognosis, and establish adequate treatments. For instance, in patients presenting with UAP, the Braunwald clinical classification, which includes three different classes of severity, provides valuable prognostic information [33]. To investigate the relation between clinical presentation and plaque morphology in patients with UAP, Mizukoshi et al. [34] compared the detailed OCT culprit plaque characteristics among the three different classes of severity of UAP, according to the Braunwald clinical classification:
Class I: new onset of severe angina or accelerated angina, without pain at rest
Class II: angina at rest within the past month, but not within the preceding 48 h
Class III: angina at rest within 48 h
Only patients with primary angina (Braunwald class B) were included in the study; those with secondary or post-infarction angina (Braunwald class A and C, respectively) were excluded. Patients with class I showed a significantly higher prevalence of “ulcers” without any disruption compared to those with the other classes (32 % [class I] vs. 7 % [class II] vs. 8 % [class III], p = 0.003) (Fig. 6.8), and a smaller minimum lumen area (0.70 mm2 [class I] vs. 1.80 mm2 [class II] vs. 2.31 mm2 [class III], p < 0.001). These findings may indicate a higher incidence of plaque erosion with subocclusive thrombosis in this group, and explain the typical symptoms of patients with class I, presenting with new onset angina or with a progressive crescendo pattern. In contrast, patients with class II presented more frequently with coronary spasm compared to those with class I and III (0 % [class I] vs. 33 % [class II] vs. 13 % [class III], p < 0.001) (See Fig. 6.8), suggesting that a dynamic obstruction may be the predominant mechanism in this group. Lastly, patients with class III had the thinnest fibrous cap (140 μm [class I] vs. 150 μm [class II] vs. 60 μm [class III], p < 0.001), as well as frequent plaque rupture (43 % [class I] vs. 13 % [class II] vs. 71 % [class III], p < 0.001) (See Fig. 6.8). This observation suggests that increased plaque vulnerability with subsequent disruption may be the baseline mechanism in most of patients with class III, and may explain the worse prognosis associated with this pattern of angina [35].
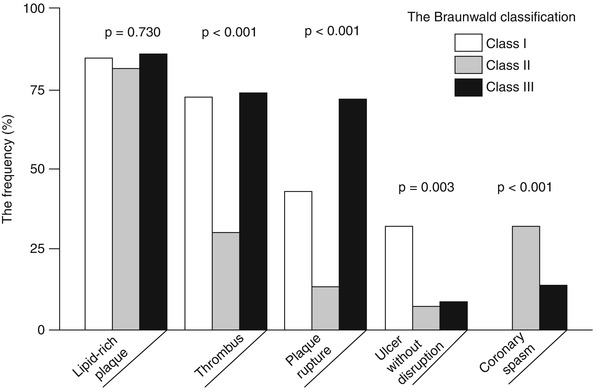
Fig. 6.8
OCT plaque characteristics in patients with UAP according to the Braunwald clinical classification. The prevalence of lipid-rich plaque was not different between the three classes. Thrombus was significantly more frequent in patients with class I and III than in those with class II. Plaque rupture was more frequent in patients with class III, “ulcer” without disruption in those with class I, and coronary spasm in those with class II (From Mizukoshi et al. [34])
However, all the above mentioned studies using in vivo OCT imaging for plaque characterization were single-vessel studies, and therefore the results were derived from a limited part of the coronary vasculature. To overcome this limitation, a 3-vessel imaging study from the Massachusetts General Hospital (MGH) OCT Registry investigated the differences in plaque characteristics at non-culprit lesions between patients with ACS and those with a stable clinical presentation [36] (Figs. 6.9 and 6.10). Patients presenting with ACS had a larger number of lipid-rich plaques compared to the stable patients (1.9 ± 1.4 vs. 1.1 ± 1.1, p = 0.013), confirming the data from previous single-vessel OCT studies and angioscopy studies [37, 38]. In addition, lipid plaques were characterized by a wider lipid arc, greater lipid length, larger lipid volume index, and thinner fibrous cap in patients with ACS compared to those with SAP (See Fig. 6.9). Notably, the prevalence of TCFA was significantly higher in patients with ACS than in those with SAP (64.7 % vs. 14.9 %, p < 0.001), as well as the prevalence of macrophage accumulation (82.4 % vs. 37.9 %, p = 0.001) and thrombus (29.4 % vs. 1.1 %, p < 0.001) (See Fig. 6.10). These results emphasized the panvascular nature of atherosclerosis, and the presence of greater plaque vulnerability in the coronary tree of patients with ACS than those with SAP, which may lead to higher rate of recurrent ischemic events. Interestingly, the prevalence of plaque disruption at non culprit lesions was also greater in patients with ACS than in those with stable clinical presentation, although the difference was not statistically significant. Lastly, although the prevalence of intimal neovascularization was not different between the two groups, patients with ACS had microchannels with a more superficial location (See Fig. 6.10). Neovascularization may play a role in plaque vulnerability [14] and progression [16], through the recruitment of inflammatory cells and the promotion of lipid accumulation within atherosclerotic plaque [39]. A more superficial location of neovascularization might reflect an advanced stage of atherosclerosis; however, this hypothesis needs to be confirmed in future studies. Although this study analyzed the detailed coronary plaque characteristics in patients with ACS, potential differences in non-culprit plaque characteristics in relation to various culprit plaque morphologies had not yet been investigated. As shown by pathology [10] and in vivo imaging studies [22], different types of culprit plaques are characterized by specific underlying morphologic characteristics, and are associated with different clinical presentations. In light of the systemic nature of atherosclerosis, it is reasonable to hypothesize that non-culprit plaques might have different characteristics based on the specific culprit plaque morphology. This was tested in a 3-vessel OCT study comparing the non-culprit plaque characteristics between patients with plaque rupture and those with non-ruptured plaque at the culprit lesion [40]. Patients with ACS caused by plaque rupture showed a higher prevalence of lipid-rich plaques, TCFA, and additional disruption in non-culprit lesions compared to those with a non-ruptured culprit plaque. Patients with ACS caused by a plaque rupture had a TCFA at a remote site in 52.9 % of cases, and an additional disruption in 35.3 % of cases, which localized more frequently in the culprit artery. These data indicated the presence of pancoronary vulnerability in patients with ACS caused by plaque rupture, which may explain the multifocal instability observed during the acute phase, and may be responsible of recurrent cardiac events (Fig. 6.11). It is conceivable that this subset of high-risk patients might benefit from aggressive systemic anti-inflammatory treatments [41] or new lipid-lowering therapies (e.g., PCSK9 inhibitors) [42], in addition to the standard antiplatelet and statin therapies. Further studies are warranted to confirm this hypothesis.
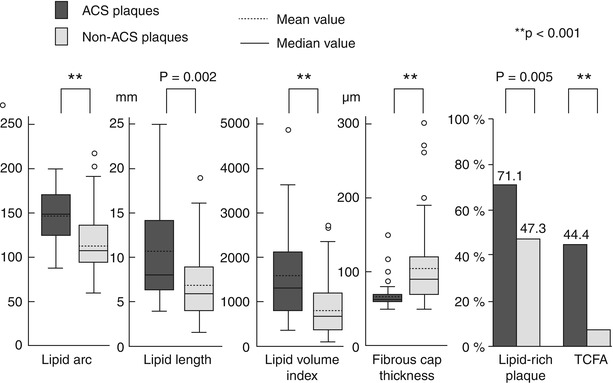
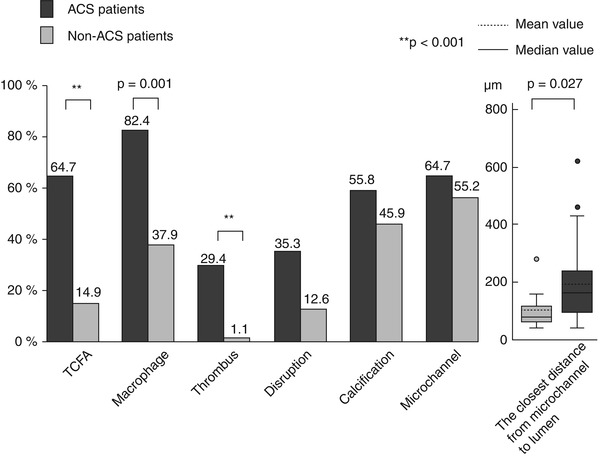
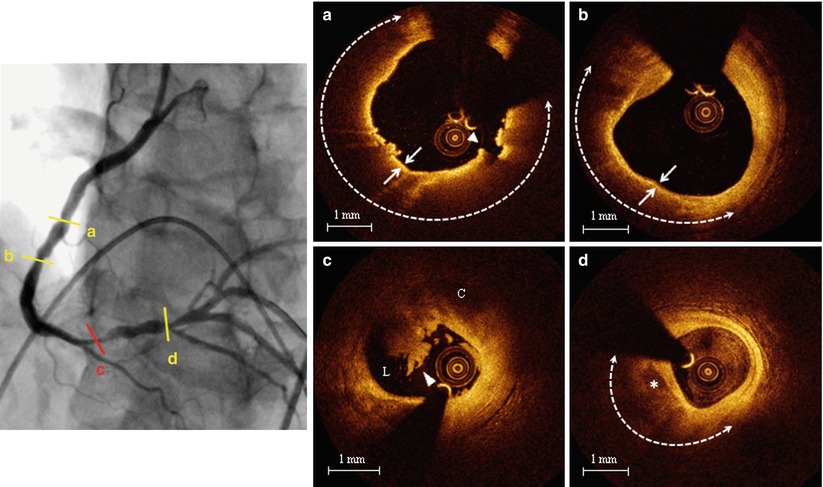
Fig. 6.9
Plaque-based analysis of OCT findings between patients with ACS and those with SAP. Compared to patients with SAP, those with ACS showed larger lipid content, thinner fibrous cap, and higher prevalence of lipid-rich plaque and TCFA (From Kato et al. [36])
Fig. 6.10
Patient-based analysis of OCT findings between patients with ACS and those with SAP. Compared to patients with SAP, those with ACS showed higher prevalence of TCFA, macrophage accumulation, thrombus, and a shorter distance between microchannels and coronary lumen (From Kato et al. [36])
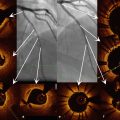
Fig. 6.11
Representative case of patient with ACS showing diffuse plaque vulnerability. Left panel. Coronary angiogram of the right coronary artery showing multiple lesions; (a) Non-culprit TCFA: large lipid arc (dashed line) covered by a thin (<65 μm) fibrous cap (arrows) with signs of disruption (arrowhead); (b) Non-culprit TCFA: large lipid arc (dashed line) covered by a thin (<65 μm) fibrous cap (arrows); (c) Culprit ruptured plaque with overlying thrombus (arrowhead). (C cavity, L lumen); (d) Non-culprit lipid plaque (dashed line) with spotty calcification (asterisk) (From Vergallo et al. [40])
6.3 OCT Coronary Plaque Characteristics and Cardiovascular Risk Factors
6.3.1 Diabetes Mellitus
Diabetes mellitus (DM) is a well recognized independent risk factor for CAD [43]. Patients with DM have increased morbidity and mortality compared to non-diabetic patients, with a two- to five-fold higher incidence of cardiac death or AMI [43, 44], and a 2-fold higher incidence of recurrent ischemic events [43]. This has been related to the presence of enhanced pro-atherosclerotic, pro-inflammatory, and pro-thrombotic stimuli in patients with DM [45]. Pathology studies have reported that subjects with DM who died of SCD had more severe atherosclerosis, larger plaque burden, greater necrotic core, and increased inflammation in their coronary arteries, as compared with non-diabetic subjects [46]. To clarify the mechanism responsible for the increased cardiovascular-risk in diabetic patients, a 3-vessel OCT study was performed comparing the detailed characteristics of non-culprit plaques between patients with DM and those without DM [47]. Although there was no difference in the prevalence of lipid-rich plaques (67.7 % [non-DM] vs. 63.9 % [DM], p = 0.825) and TCFA (19.4 % [non-DM] vs. 27.8 % [DM], p = 0.277) between the two groups, the non-culprit plaques of DM patients were characterized by wider lipid arc, greater lipid length and larger lipid volume index, and tended to have a thinner fibrous cap. Moreover, patients with DM showed higher prevalence of calcifications (48.4 % [non-DM] vs. 72.2 % [DM], p = 0.034) and thrombus (0 % [non-DM] vs. 8.3 % [DM], p = 0.047). These observations were consistent with the results from a subanalysis of the PROSPECT study showing no difference in the prevalence of VH-IVUS fibroatheroma between patients with and without DM, but a higher necrotic core and calcium content in diabetic patients [48]. Interestingly, all the measures of lipid burden and fibrous cap thickness were significantly related with the hemoglobin (Hb) A1C levels (Fig. 6.12), and patients with Hb A1C levels ≥ 8 % showed a higher incidence of TCFA and macrophage accumulation, suggesting that diabetic patients with poor glycemic control may develop more vulnerable atherosclerotic features. Interestingly, another OCT study by Niccoli et al. [49] conducted in diabetic and non-diabetic patients at the time of a very first acute coronary event showed, consistent with previous studies, a greater number of calcified quadrants and a wider calcification arc in patients with DM compared to those without DM, but a surprisingly lower lipid content (i.e., lipid quadrants and lipid arc) at the minimum lumen area site of the culprit lesion. Another two OCT studies failed to show differences in the prevalence of lipid-rich plaques and TCFA at the culprit lesion between patients with and without diabetes [50, 51]. However, while our study [47] and the DM substudy of the PROSPECT trial [48] were 3-vessel imaging investigations, the other above-mentioned studies [49–51] performed OCT imaging only in the culprit vessel, and this may explain the contrasting results. Taken together these observations suggest that patients with diabetes may have increased plaque vulnerability in their coronary tree, particularly in cases of poor glycemic control, but that such differences may not necessarily be observed at the site of culprit lesion.
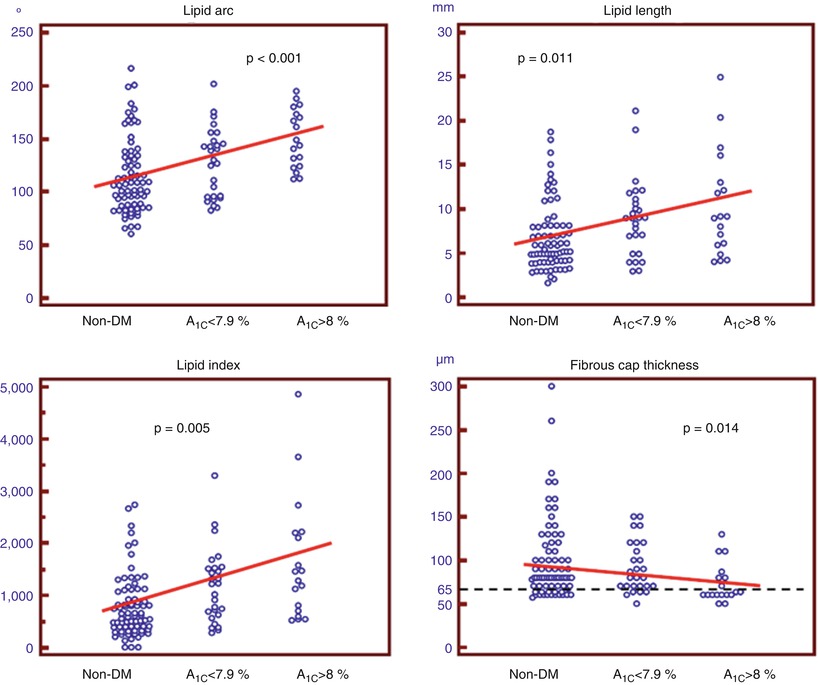
Fig. 6.12
Correlation between OCT plaque characteristics and levels of Hb A1C. All OCT parameters of lipid burden correlated positively with the levels of Hb A1C, whereas there was an inverse correlation between fibrous cap thickness and levels of Hb A1C (From Kato et al. [47])
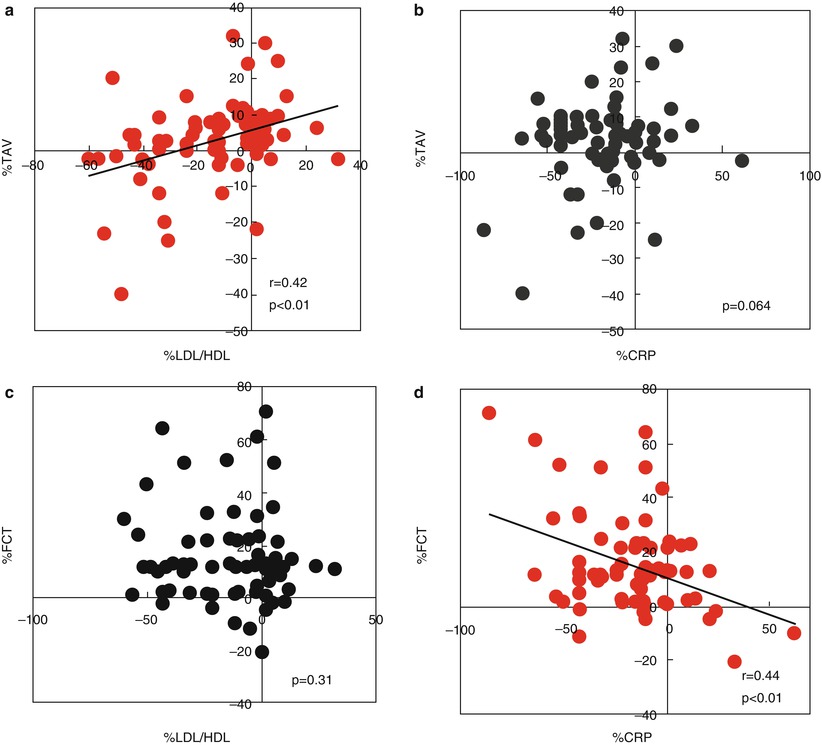
6.3.2 Hyperlipidemia
Hyperlipidemia represents one of the most important and best substantiated risk factors for CAD [52]. Several epidemiologic, genetic, and interventional trials have explored the causal relation between dyslipidemia and atherosclerosis, and have identified lipid-modification therapy as a risk-reducing strategy for patients with CAD [52–54]. Data from numerous large-scale trials have consistently proved the efficacy of lipid-lowering therapy with statins for the reduction of subsequent cardiovascular events and mortality [54–56]. In addition, IVUS studies have monitored the changes in atheroma volume in relation to different intensities of lipid-lowering therapies, demonstrating the ability of statins to reduce the progression of coronary atherosclerosis [57]. This effect was significantly related to the reduction of both the levels of atherogenic lipoproteins and the systemic inflammatory status (i.e., C-reactive protein, CRP) [58]. Retrospective OCT studies have also attempted to clarify the relation between lipid profile and morphological characteristics of coronary atherosclerosis. In a study by Takarada et al. [59], 82 patients with NSTE-ACS were imaged with both IVUS and OCT at baseline and after 9 months in order to investigate the changes in non-culprit plaque composition in relation to the lipid and inflammatory profiles. The changes in total atheroma volume assessed by IVUS, but not those in fibrous cap thickness assessed by OCT, were significantly correlated with the low-density lipoprotein/high-density lipoprotein (LDL/HDL) ratio. Conversely, the changes in fibrous cap thickness were inversely related to the high-sensitivity CRP levels (Fig. 6.13). Interestingly, statin therapy was an independent predictor of plaque stabilization, defined as a concomitant decrease in total atheroma volume and increase in fibrous cap thickness [59]. Another study from the same group [60] demonstrated that patients with TCFA at the culprit lesion had significantly lower HDL-cholesterol levels (39.6 ± 10.1 mg/dl vs. 46.7 ± 11.7 mg/dl, p < 0.001), higher LDL-cholesterol levels (120.7 ± 31.1 mg/dl vs. 110.0 ± 28.1 mg/dl, p = 0.004), and greater LDL/HDL ratio (3.2 ± 1.0 vs. 2.5 ± 0.8, p < 0.001), as compared with patients without TCFA at the culprit lesion. Interestingly, a study by Matsuo et al. reported higher levels of malondialdehyde-modified LDL, which is an oxidized LDL, in SAP patients with TCFA than in those without TCFA (p < 0.001) [61]. Higher levels were also detected in ACS patients with ruptured TCFA compared to those with intact TCFA (p = 0.023). Multivariate analyses proved that malondialdehyde-modified LDL levels were independently associated with the presence of TCFA (odds ratio [OR]: 1.45 per 10-unit increment, 95 % confidence interval [CI]: 1.24 − 1.68; p < 0.001). Oxidative modification of lipoproteins plays a pivotal role in the atherogenic process, through chemotactic activity on monocytes and T-cells, stimulation of MMP-1 and MMP-9 expression, promotion of CD40/CD40L signaling pathway, and direct cytotoxic activity on endothelial cells and smooth muscle cells [62]. Lastly, a recent investigation by Nasu et al. [63], using VH-IVUS and OCT, showed a correlation between fibrous cap thickness and lipid and inflammatory profiles in stable patients not receiving any lipid-lowering therapies (Fig. 6.14). Notably, campesterol-to-lathosterol ratio (OR: 3.99, 95 % CI: 1.69 − 9.43; p = 0.002), LDL-cholesterol levels (OR: 1.42, 95 % CI: 1.02 − 1.98; p = 0.03), and high-sensitivity CRP levels (OR: 1.02, 95 % CI: 1.00 − 1.05, p = 0.02) independently predicted the presence of TCFA. Taken together, all these studies suggest a clear relationship between lipid profile and features of coronary plaque vulnerability. Prospective, serial OCT studies with randomization to different lipid-lowering therapy regimens are needed in order to define the best approach for coronary plaque stabilization and prevention of cardiovascular events.