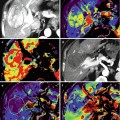
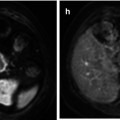
Fig. 38.1
Rectal carcinoma in 67-year-old patient. Axial fast spin-echo T2-weighted image (a) depicts a rectal tumor (T) with deep mesorectal invasion and lymph node involvement (black arrows). Fused image at the same level superimposing axial T2-weighted MR image and color-coded map derived from high-b-value (b = 1,000 s/mm2) diffusion-weighted image (b) shows similar findings (black arrows) and clearly depicts a focal area (white arrow) with restricted diffusion in the sacrum (colored area in fused image) that corresponds to tumor invasión
38.2 Tumor Hallmarks and FMI Techniques in CRC
Carcinogenesis is a complex, multistep, multipath process. There is a sequence of specific heritable events that cause corresponding changes in tumor size and morphology during colorectal carcinogenesis [5, 9]. Most clinically manifested invasive cancers typically show characteristic phenotypic alterations, which are manifestations of genetic changes and metabolic reprogramming [5]. FMI techniques enable us to map the distribution of main tumor hallmarks such as limitless replication potential, sustained angiogenesis, or an increased glycolytic capacity in CRC [6–8].
38.2.1 Tumor Metabolism in CRC
The vast majority of fast-growth tumors, including CRC, display a markedly modified metabolism in comparison to the tissue of origin [10, 11]. Tumor metabolic reprogramming balances the three crucial requirements of tumor cells to allow enhanced survival and growth: increased energy production, sufficient macromolecular biosynthesis, and maintenance of redox balance [10]. FMI plays a key role in the assessment of the altered tumor metabolism.
38.2.1.1 Imaging Glucose Metabolism with PET
The most notorious and well-known energy metabolism alteration in tumor cells is an increased glycolytic capacity, even in the presence of a high O2 concentration [10, 11]. The reliance of cancer cells on increased glucose uptake is the fundamental basis for clinical PET or PET/CT imaging. PET is an established clinical technique for CRC [12, 13]. 18F-2-fluoro-2-deoxy-d-glucose (FDG) is the most common radiotracer used. One favorable characteristic of FDG is the relative long half-life compared with other short-lived PET isotopes where an on-site cyclotron is essential. Tumor cells overexpressing cell surface GLUT-1 transporters take up this glucose analogue with its attached positron-emitting radionuclide 18F. Once inside cells, it is phosphorylated by upregulated hexokinase into glucose-6-phosphate and becomes trapped within tumor cells. Semiquantitative analysis using standardized uptake value (SUV) represents the metabolic activity of the tumor compared with that of surrounding tissue, corrected for injected dose and patient weight [13]. PET and its hybrid techniques (PET/CT or PET/MRI) provided an oncologic tool in CRC for the management of patients [12–15]. FDG-PET can contribute to staging due to its high sensitivity for metastatic disease. In a systematic review, Patel et al. found a superior diagnostic accuracy of PET/CT in the detection of extrahepatic and hepatic disease [14]. However, routine PET for the initial staging of CRC is not actually an established indication of this technique [15]. PET may be used in selected groups of patients at staging. In rectal cancer (RC), PET can detect lymph nodes (LNs) involvement and distant metastatic deposits at staging [12, 13, 16]. LNs involvement is a prognostic feature, and its assessment based on size criteria or based on conventional imaging modalities (CT, MRI, and endoscopic ultrasound) remains unreliable in RC [17]. PET/CT upstaged nearly half the patients by identifying unsuspected systemic or LNs metastases [16]. Beside this, PET helps guide decisions concerning metastectomy for patients with limited volume metastatic disease [12]. PET is highly accurate in detecting metastatic disease that may change the therapeutic approach in a significant proportion of patients with RC [13–15, 18]. In the case of colon cancer, PET may alter the treatment intent in potentially resectable metastatic disease and may clarify the staging in patients with doubtful distant metastatic disease on conventional modalities. Besides, PET imaging appears as an attractive alternative for measuring therapy response. PET can predict a complete pathological response in rectal tumors (Fig. 38.2) [19]. Sequential FDG-PET following neoadjuvant chemoradiotherapy (CRT) may also predict therapy effectiveness in RC and has been shown to be an independent predictor of disease-free survival and overall survival [20, 21]. Moreover, FDG-PET can also be used to assess residual disease following completion of local ablative therapy [22]. Nevertheless, the lack of standardized metabolic response criteria limits its routine clinical use. PET findings post-therapy show a prognosis value. Capirci et al. suggested that patients with a negative PET 7 weeks after CRT presented a better disease-free survival [20]. Other clinical applications such as radiotherapy (RT) planning are emerging. PET/CT definition of gross tumor volume and clinical tumor volume improves CT-based delineation [23]. Finally, early detection of CRC recurrence increases the chance of potentially curative treatment. FDG-PET has been found a cost-effective imaging tool in the assessment of recurrence and in selecting surgical candidates [24]. PET was able to identify the site of suspected recurrence in patients with an unexplained rise in serum carcinoembryonic antigen levels (Fig. 38.3a, b). In addition, PET is more sensitive than CT scans in detecting locoregional tumor relapse, in evaluating equivocal lesions evidenced on anatomic imaging, and in identifying additional metastases [25]. Several limitations of PET/CT for the evaluation of CRC must be highlighted, including limits in spatial resolution or poor FDG uptake of mucinous adenocarcinomas or necrotic tumors. On the contrary, physiological bowel FDG uptake or inflammation may mimic a malignant tumor (Fig. 38.4).
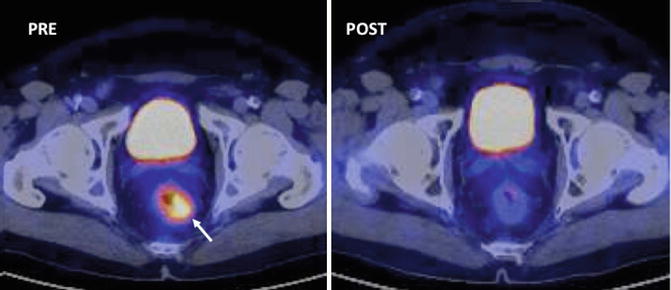
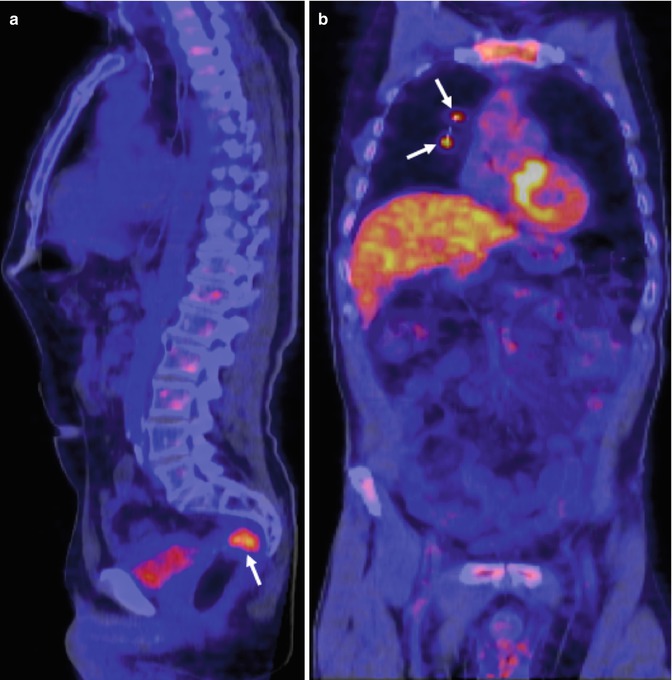
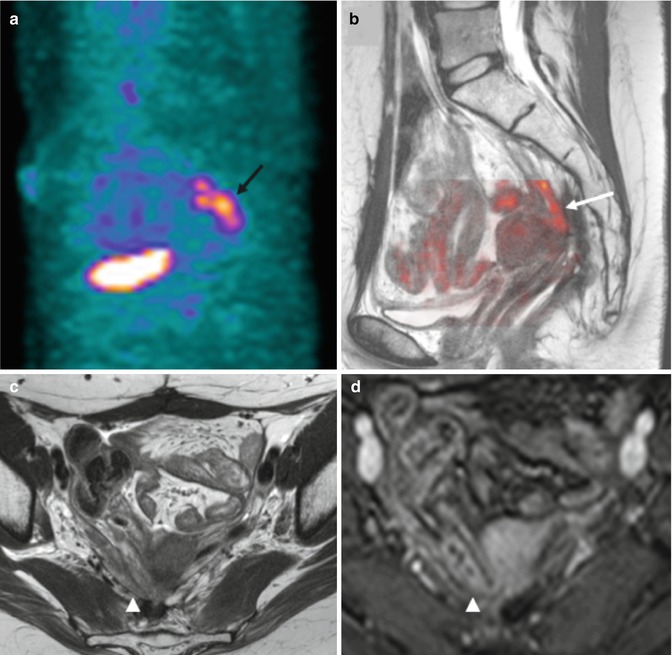
Fig. 38.2
PET (SUV) changes secondary to therapy in 62-year-old man with rectal cancer treated with chemoradiation. Axial PET/CT image pretherapy (left) demonstrates an FDG-avid rectal mass (white arrow). Post-neoadjuvant chemoradiotherapy PET/CT image evidences a complete tumor response (Courtesy JM Llamas-Elvira, MD. Department of Nuclear Medicine, Hospital Universitario Virgen de las Nieves, Granada, Spain)
Fig. 38.3
Rising tumor markers in 54-year-old man with rectal cancer treated with chemoradiation and surgery. Sagittal PET/CT image (a) shows a focal area of uptake in the pelvis corresponding to tumor recurrence (white arrow). Corresponding coronal PET/CT image (b) demonstrates two lung metastases (white arrows) (Images courtesy of JM Llamas-Elvira
Fig. 38.4
PET versus MRI in 59-year-old woman with history of rectal cancer and rising of serum carcinoembryonic antigen levels. Sagittal PET image (a) evidences an FDG-avid area suspicious for recurrence in the presacral space (black arrow). Fused image (b) superimposing sagittal T2-weighted MR image and color-coded map derived from high-b-value (b = 1,000 s/mm2) DWI does not demonstrate any area of restricted diffusion (white arrow). Axial T2-weighted MR image (c) and contrast-enhanced gradient-echo T1-weighted (d) clearly depict a bowel loop at this level (arrowhead in d)
38.2.1.2 CRC Metabolism and MR Spectroscopy
Proton (1H) MRS is a noninvasive method for studying tumors’ biochemistry and metabolism. Up to date, this imaging technique has no defined role in the clinical assessment of CRC in vivo. Technical aspects, such as motion and susceptibility artifact from the air-tissue interfaces, have limited its application to CRC. However, a recent paper suggests that 1H-MR appears to be a promising and feasible noninvasive modality for detection of rectal adenocarcinoma and monitoring treatment response after preoperative CRT [26]. In a different paper, Dzik-Jurasz et al. showed that the 1H-MR spectra of RC depicted choline and lipid peaks (Fig. 38.5) [27]. Kim et al. also evidenced that a choline peak at 3.2 ppm was characteristic for RC before treatment, while after CRT, the choline peak disappeared, resulting in only a lipid peak at 1.3 ppm [26].
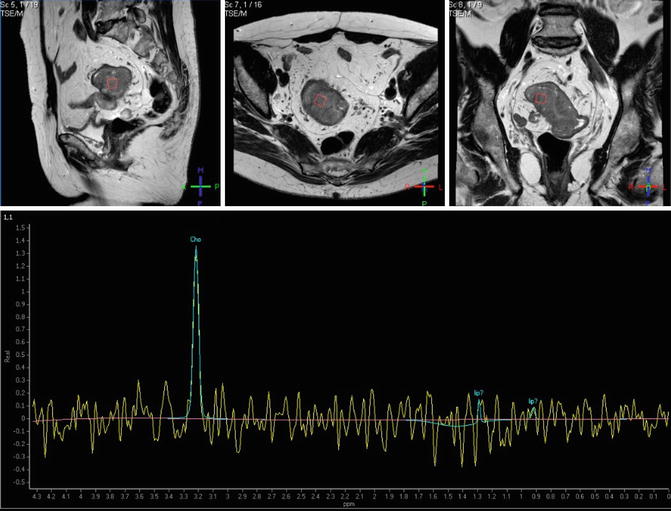
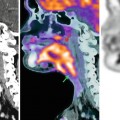
Fig. 38.5
Proton MRSI of a rectal adenocarcinoma. Transverse (upper row, left), coronal (middle), and sagittal (right) images obtained by T2-weighted turbo spin-echo imaging. Spectra obtained by univoxel spectroscopy at long echo time (TE = 135 ms) showing an increased level of choline (Cho)
38.2.2 Imaging Tumor Proliferation and Cellularity in CRC
Cancer growth is characterized by uncontrolled cell proliferation and greater cell density. Both PET and MRI techniques can respectively image cellular proliferation and cellularity in tumors.
38.2.2.1 Imaging Tumor Proliferation with PET
18F-3-deoxy-3-fluorothymidine (FLT)-PET images cellular proliferation. FLT enters the exogenous DNA pathway as a specific substrate for thymidine kinase 1, an enzyme of the DNA synthesis. In theory, FLT is a more specific tracer for malignancy and shows a high sensitivity in detecting primary CRC [28, 29]. However, several studies have shown a limited role of FLT-PET in CRC. FLT-PET had a poor value for the detection of pathological LNs and tumor delineation in RC compared to CT [30], and imaging was influenced by the interaction of the tracer with chemotherapeutic agents like 5-fluorouracil [29]. In the same way, FLT was less sensitive comparing to FDG for detecting liver metastases in CRC due to high background liver uptake, and FLT target volume definition for radiotherapy planning was smaller compared to FDG [29]. Finally, Wieder et al. evidenced that the degree of change in FLT uptake did not correlate with histopathologic tumor regression in patients with RC and neoadjuvant CRT [31].
38.2.2.2 Diffusion-Weighted Magnetic Resonance Imaging in CRC
DW-MRI is becoming an increasingly established technique in oncology [32]. DW-MRI explores the random motion of water molecules in the body, which is modified and limited by interactions with cell membranes and macromolecules. Hence, the motion of water molecules is detected as attenuation of the measured signal intensity at diffusion-weighted imaging (DWI). DWI can provide indirect qualitative and quantitative assessments of tissue properties such as cellularity (Fig. 38.6), but gland formation, perfusion, or cell death may also influence water diffusion (Fig. 38.7). The degree of restriction to water diffusion directly correlates with tissue cellularity and the integrity of cell membranes in many different tumors, including CRC. However, comparing to other tumors there is no correlation between apparent diffusion coefficient (ADC) values and proliferation index in CRC.
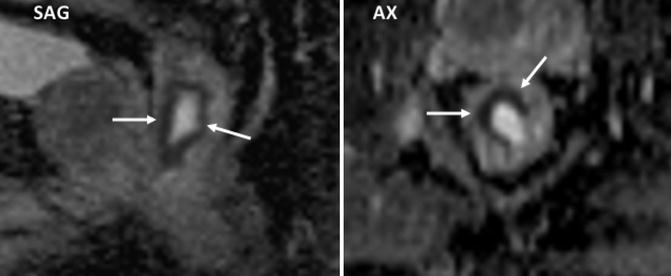
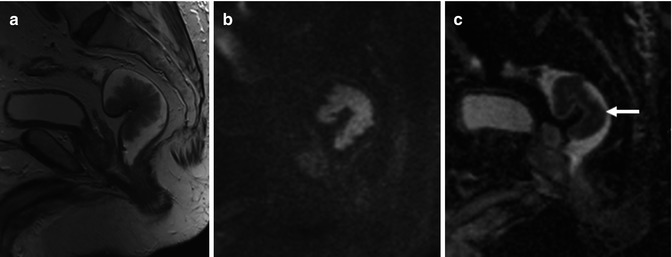
Fig. 38.6
Rectal cancer delineation using diffusion MR imaging. Sagittal (SAG) and axial (AX) ADC parametric map clearly delineates the rectal tumor (arrows)
Fig. 38.7
Nonmalignant rectal polyp. Sagittal T2-weighted (a) and high-b-value (b = 1,000 s/mm2) diffusion-weighted (b) images and ADC parametric map (c) of a low-grade dysplastic polyp evidence restricted diffusion with low ADC values (ADC = 0.89 μm2/s) in the polyp (arrow). Readers must have in mind that different features may affect tissue water diffusivity, including tissue perfusion, cell density, integrity of cellular membranes, and tissue organization. Low ADC values do not always represent malignancy
DW-MRI may aid in the detection of CR tumors. High-b-value DWI may be a useful tool for detecting polyps and tumors and defining tumor extent (Fig. 38.8a, b) [33]. DW-MRI has been also shown to be of value when staging patients. Recent studies have shown that the addition of DW-MRI to morphologic imaging improves lesion detection rates and is useful for characterizing liver metastatic deposits [34]. DWI has not yet been demonstrated to be of value in characterizing lymph nodes (LNs) in CRC patients. Thus, high-b-value DW-MRI is sensitive for detecting the location of LNs [35], but its characterization value is unproven in CRC. Necrotic neoplastic nodes or mucinous tumors may yield false-negative results (Fig. 38.9a, b), and reactive hyperplastic nodes may cause false-positive results. Beside this, whole-body (WB)-DW-MRI is an emerging technique that is being explored for CRC. Results from various cancer studies, including CRC patients, are encouraging and show a high sensitivity of WB-DW-MRI for malignant lesion detection (Fig. 38.10a, b) [36]. However, currently there is no evidence to suggest that this technique can replace PET/CT. On the other side, DWI might have a prognostic value in different clinical situations. Thereby, Curvo-Semedo et al. reported that lower ADC values were associated with a more aggressive tumor profile in RC [37]. Besides, diffusion may predict tumor response to neoadjuvant CRT in patients with locally advanced RC [38–40]. Jung et al. evidenced a significant correlation between tumor volume reduction and pre-CRT ADC values [39]. Pre-CRT ADC of the histopathologic responders was significantly lower than that of the histopathologic nonresponders, and the change of ADC of the histopathologic responders was significantly higher [39, 40].
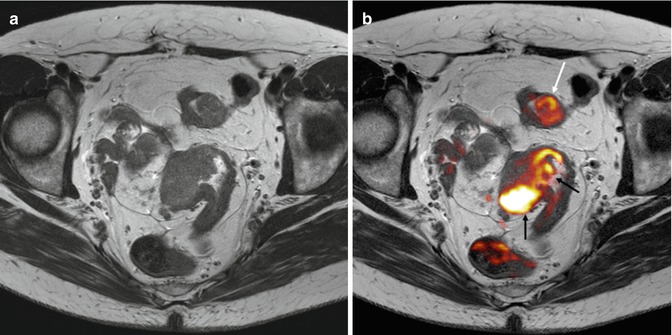
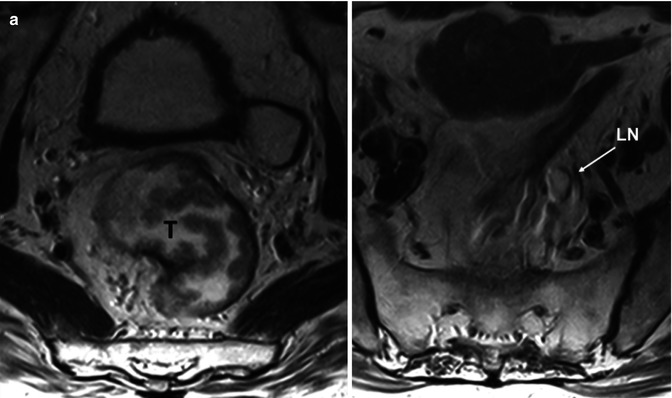
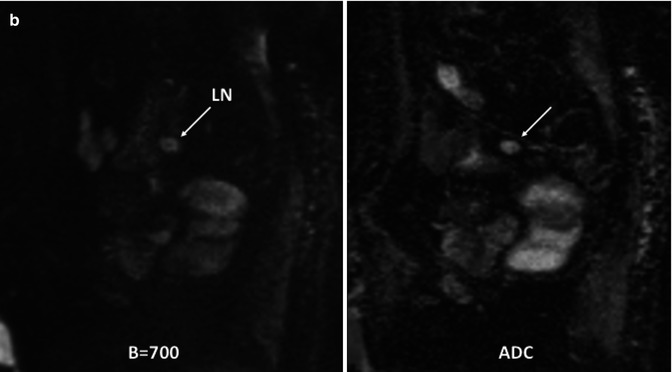
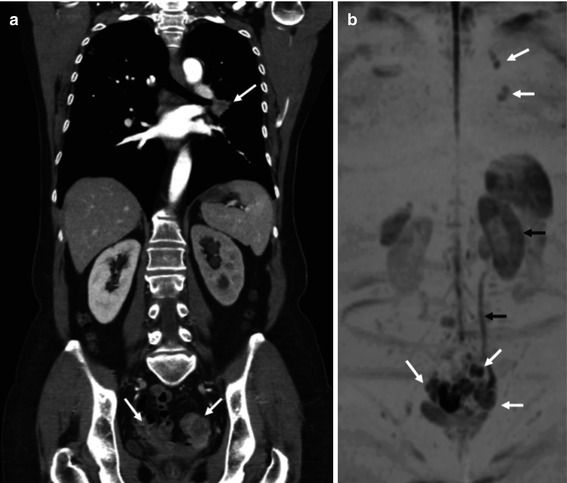
Fig. 38.8
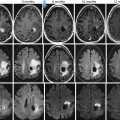
Upper rectal carcinoma and sigmoid polyp in 71-year-old patient. Axial fast spin-echo T2-weighted image (a) does not clearly depict tumor involvement in detail. Fused image at the same level superimposing axial T2-weighted MR image and color-coded map derived from high-b-value (b = 1,000 s/mm2) diffusion-weighted image (b) demonstrates a big rectal tumor (black arrows) and a mass with restricted diffusion in the sigmoid colon (white arrow) that corresponds to a benign polyp
Fig. 38.9
Metastatic lymph node in a mucinous rectal tumor in 61-year-old man. Axial T2-weighted MR images (a) demonstrate a villous rectal tumor (T) and a high-signal intensity mesorectal lymph node (LN). In the same patient, sagittal diffusion-weighted (b = 700 s/mm2) image and ADC map (b) evidence a high-signal-intensity lymph node (LN) corresponding to a metastatic LN with mucinous infiltration. Note the high signal intensity on ADC map that is secondary to a “T2 shine-through” phenomenon of mucinous content. This finding may be erroneously interpreted as a sign suggesting a benign lesion. It is necessary to correlate with corresponding ADC maps with high b-value and T2-weighted images
Fig. 38.10
Recurrence of a rectal tumor. Coronal reformatted CT image (a) shows a hilar lung metastatic mass and multiple pelvic tumor deposits (arrows). Coronal maximum-intensity- projection 3T whole-body diffusion-weighted (b = 800 s/mm2) MR image with inverted gray scale (b) also demonstrates multiple metastatic deposits (white arrows) and evidences altered water diffusion in the left kidney secondary to hydronephrosis (black arrows)
Because of the increasing use of preoperative CRT, MRI is frequently repeated after treatment to restage the tumor, assess the response, and determine whether it is operable and establish the surgical approach. Preliminary results indicate that the diagnostic performance of MRI to predict mesorectal fascia tumor clearance improved significantly after additional review of DW images [41]. DWI might also be effective in detecting early tumor response and predicting treatment outcomes. In the evaluation of tumor response, increases in ADC values with treatment have been shown to correlate with the development of tumor fibrosis and apoptotic cell death (Fig. 38.11). It has been reported that increases in ADC value with therapy response occurs within 3–7 days in responding patients treated with chemotherapy [42, 43]. Post-CRT DWI and DW-MR-volumetry seem to provide a high diagnostic performance in assessing pathological complete response (pCR) in RC and were significantly more accurate than T2-weighted images or T2-weighted MR-volumetry [44, 45]. In addition, Kim et al. reported that the evaluation of post-CRT ADC may reliably differentiate pCR from non-pCR in locally advanced RC [46]. Unfortunately, an increase in ADC values and decrease in signal intensity on high-b-values can predict therapy response but cannot unequivocally determine a complete response [47]. However, adding DWI to T2-weighted imaging seems to be helpful for detecting viable tumors after neoadjuvant CRT patients with locally advanced RC [48]. Concerning nodal restaging after CRT, ADC measurements on its own are not reliable and do not improve accuracy comparing to T2W-MRI [49]. Finally, DWI seems to have an additional value for improvement of the specificity in the diagnosis of tumor recurrence (Fig. 38.12a, b) [50]. Indeed, the limitation of MRI generally is overestimation of the presence of tumor within areas of postoperative fibrotic scar tissue. DW-MRI seems to be able to discriminate the abnormal signal intensity of tumor from fibrosis. However, there are discordant observations, and Lambregts et al. reported that the addition of DWI to standard MRI sequences or the use of T2-weighted + DWI fusion images does not significantly improve its accuracy [51].
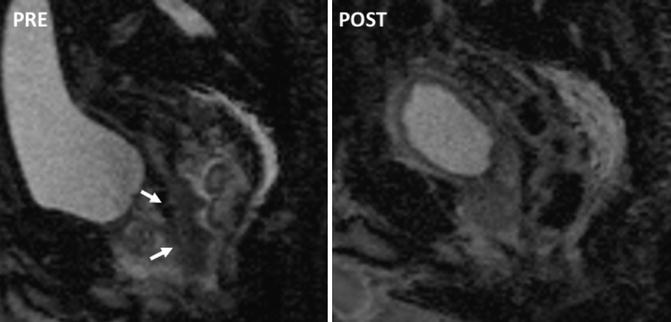
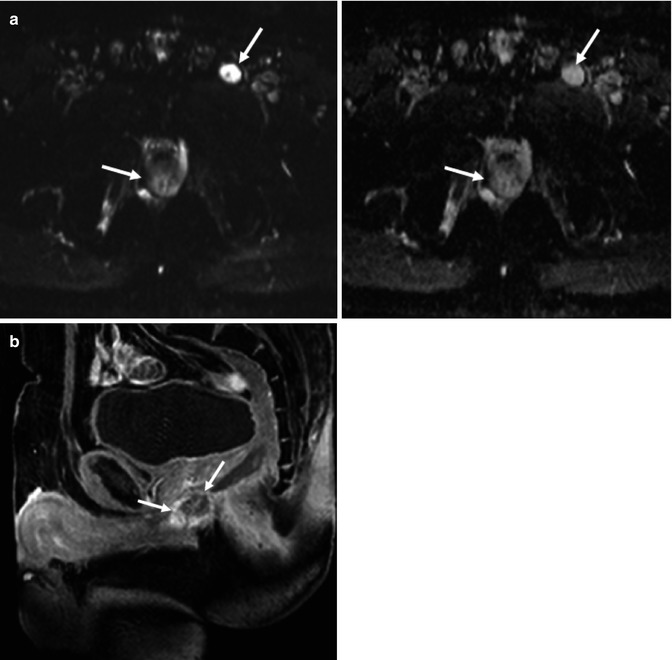
Fig. 38.11
Apparent diffusion coefficient (ADC) changes secondary to therapy in 72-year-old man with rectal cancer. ADC maps corresponding to the rectal tumor pre- and post-chemoradiation. Pretreatment image (left) shows low ADC values in the tumor (white arrows). Posttreatment image shows a normalization of rectal wall ADC values
Fig. 38.12
Recurrence of a mucinous tumor in 58-year-old man. Axial diffusion-weighted (b = 800 s/mm2) image (upper row – left) and ADC map (upper row – right) (a) evidence a high-signal-intensity mass in the pelvis and similar findings in a left inguinal lymph node (arrows) corresponding to a mucinous tumor recurrence with lymph node involvement. Note the high signal intensity on ADC map in tumor recurrence and inguinal lymph node that may be erroneously interpreted as a sign suggesting a benign lesion. Increased lesion/tissue signal intensity on high-b-value images (with corresponding increased ADC values) results from increased water content in the mucinous content and is termed “T2 shine-through”. Sagittal contrast-enhanced T1-weighted gradient-echo image (b) delineates a ring-enhanced mass (white arrows) representing tumor recurrence in deep pelvic and perineal areas
The signal attenuation in DWI is influenced not only by diffusion processes but also by perfusion and other kinds of motion, summarized as intravoxel incoherent motion (IVIM) [52]. The IVIM model may separate perfusion and diffusion effects. Perfusion component dominates the signal decay at low b-values, a feature that enables a differentiation between the perfusion fraction (f) and perfusion-free diffusion (D). For patients with RC, the perfusion fraction f correlated with the vascular area fraction (percentage of CD 31 positive area on histological sections), but surprisingly the perfusion f was significantly higher in the normal rectum wall, and no correlation between diffusion and cellularity could be detected for rectal tumors [53].
38.2.3 Imaging Angiogenesis in CRC
Neovascularization arises early in the evolutionary sequence from adenoma to carcinoma for supporting tumor growth. Angiogenesis is a prognostic feature in CRC that has been correlated with important tumor characteristics such as grade and stage and with an increased incidence of metastases and local tumor recurrence. Tumor angiogenesis is mainly induced by upregulation of the vascular endothelial growth factor (VEGF). However, VEGF and other histological markers, such as microvessel density (MVD), are static measurements that do not provide information on vascular structure and function.
Tumor vessels are fragile, tortuous, and leaky causing irregular blood flow (BF). Beside this, they have a chaotic, heterogeneous distribution [54]. The assessment of these vascular features in vivo is an attractive approach in oncologic imaging. Although different imaging techniques can be useful in this setting [54], DCE-CT and DCE-MRI are the main imaging techniques with clinical applicability in CRC [6–8]. In general, PCT does not provide parameters comparable to those of DCE-MRI. However, transfer constant (K trans) seems to be comparable between PCT and DCE-MRI [55]. Emerging techniques such as dynamic contrast-enhanced ultrasound (DCE-US) are also increasing used in daily practice.
38.2.3.1 Perfusion CT
Perfusion CT (PCT) is an attractive technique based on the temporal change in tumor enhancement following intravenous iodinated contrast agent administration. Different pharmacokinetic models allow obtaining qualitative data and quantitative parameters on tumor vascularization such as BF, blood volume, mean transit time (MTT), permeability-surface area, or k trans (Fig. 38.13a, b) [56]. However, PCT exams are susceptible to motion during acquisition, and accurate data capture is challenging [57]. PCT may reflect angiogenesis in CRC, though not all studies have shown agreement [58, 59]. Perfusion data may also distinguish normal colonic wall from CRC and may improve CT diagnosis in patients with coexistent diverticular disease [60, 61]. However, normal segmental differences in perfusion in normal colorectal wall must be considered [60]. PCT seems to have a role as a potential prognostic biomarker in CRC. Different studies reported that tumor BF was significantly lower in patients with poorer response to CRT and was correlated with poorer outcomes and tumor progression [62–64]. Although published data seems to be controversial, Sahani et al. [58] reported that baseline high perfusion values were associated with a poorer outcome and Curvo-Semedo et al. reported that baseline BF was significantly lower and MTT was significantly higher in responders to CRT [65]. PCT can detect therapy-induced modifications in the vascularization of CRC lesions (Fig. 38.14a, b). This technique also shows changes in PCT parameters before significant changes in size are evident in CRC liver metastases [66] and demonstrates an early increased tumor perfusion (reflected by an elevated K trans) in hypofractionated radiotherapy of RC [67].
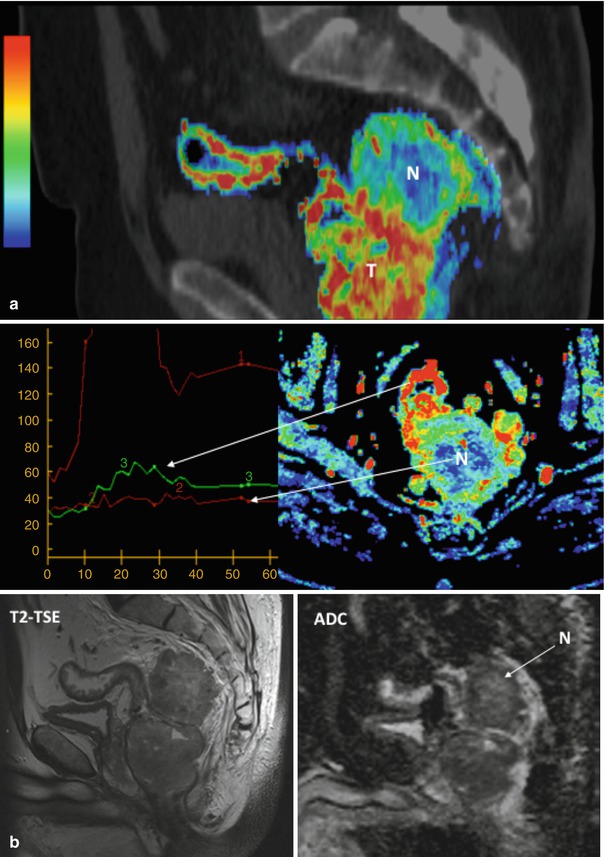
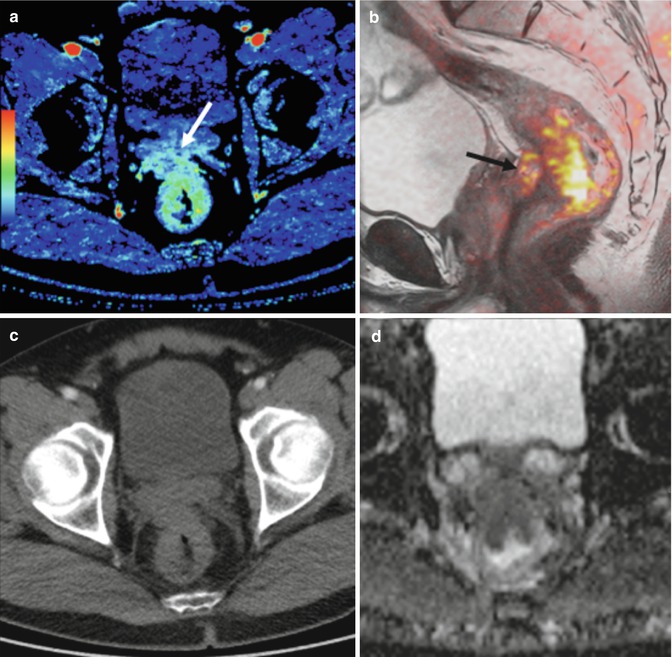
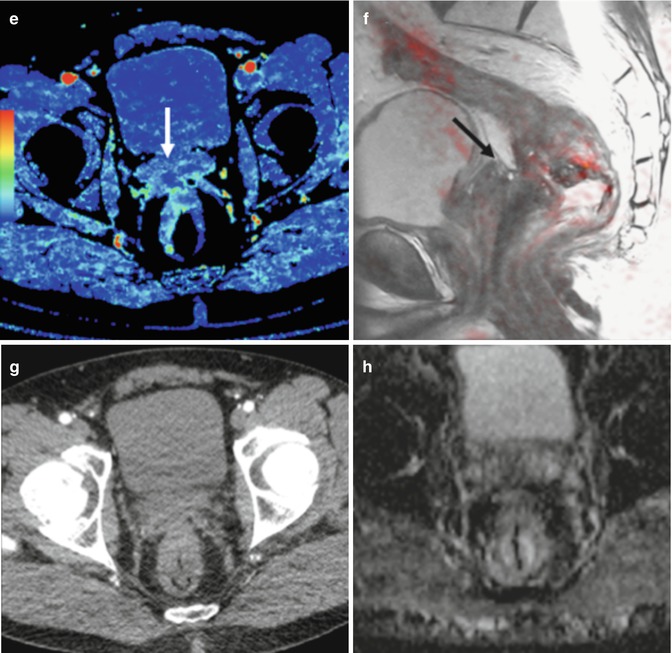
Fig. 38.13
Dynamic contrast-enhanced CT in rectal carcinoma. Perfusion CT maps in a rectal adenocarcinoma (a), including a sagittal fused image superimposing conventional CT image and color-coded perfusion CT corresponding to the blood volume (BV) parametric map (top row), time-density curves (bottom left), and axial BV parametric map (bottom right). All of them show clear differences in angiogenic phenotype between rectal tumor (T) and mesorectal deposit with necrotic areas (N), which shows central areas with absence of enhancement (red time-density curve). Corresponding MR mages (b) in the same patient, including sagittal T2-TSE image (left) and ADC parametric map (right) clearly depict increased signal in the necrotic areas (N)
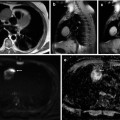
Fig. 38.14
Perfusion CT in response assessment. Perfusion CT blood volume (BV) (a, e), sagittal fused image superimposing T2-weighted MR image and color-coded map derived from high-b-value (b = 1,000 s/mm2) diffusion-weighted image (b, f), axial CT image (c, g), and apparent diffusion coefficient (ADC) map (d, h) pre and post-therapy. Pretherapy images (a–d) evidence a rectal tumor with seminal vesicles invasion that presents an increased blood flow (BV) and restriction of diffusion (arrows in a and b). Clinical staging was cT4bN1. Post-therapy evaluation (e–h) demonstrates a marked decrease in BV and increasing ADC values at the level of seminal vesicles (arrows in e and f), which correlate to fibrotic changes
38.2.3.2 Dynamic Contrast-Enhanced MRI
DCE-MRI parameters correlate to rectal tumor angiogenesis measured by MVD and VEGF expression and discriminate malignant from normal tissue [68]. Dynamic contrast-enhanced MRI techniques inform on tissue perfusion and vascular leakage and have been used in several clinical settings in tumor evaluation. In most tumors, low molecular weight contrast media diffuse from the blood into the extravascular-extracellular space (EES). T1-weighted DCE-MRI sequences are sensitive to signal changes secondary to the presence of contrast medium in EES [6–8]. However, DCE-MRI quantification is not easy because there is no simple relationship between contrast concentration and signal intensity. There is only a limited experience using DCE-MRI in clinical practice in patients with CRC (Fig. 38.15). DCE-MRI has been focused most commonly for evaluating the effects of novel therapies in clinical drug trials [69, 70]. However, quantitative parameters such as K trans may show a prognostic value. Rectal tumors with higher K trans values at presentation appear to respond better to CRT [71]. Besides, in the evaluation of patients with CRC treated with CRT, DCE-MRI shows a reduction in K trans values with tumor response, while persistent raised values indicate residual active disease [72]. DCE-MRI pharmacokinetic parameters may also be used as surrogate biomarkers of drug efficacy in CRC cancer with liver metastases [73].
Get Clinical Tree app for offline access
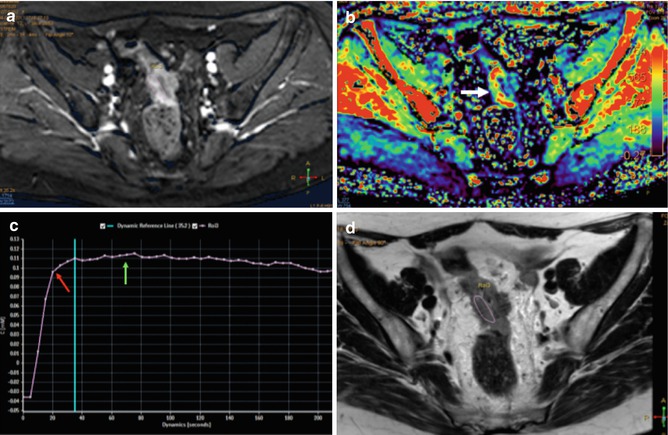
Fig. 38.15
Perfusion MR evaluation. Axial contrast-enhanced T1 gradient echo image (a


Related posts:

Stay updated, free articles. Join our Telegram channel
Full access? Get Clinical Tree
