H2 15O
13NH3
82Rb
18F-flurpiridaz
Half-life
123 s
9.97 min
76 s
110 min
Production
Cyclotron
Cyclotron
Generator
Cyclotron
Kinetics
Freely diffusible, metabolically inert
Metabolically trapped in the myocardium
Metabolically trapped in the myocardium
Metabolically trapped in the myocardium
Mean positron range in tissue
1.1 mm
0.4 mm
2.8 mm
0.2 mm
Scan duration
Gating/LV function
6 min
−
20 min
+
6 min
+
20 min
+
Radiation dose (3D) according to protocol in references
~0.4 mSv/370 MBq
~1 mSv/550 MBq
~0.7 mSv/555 MBq
(2D: ~2.3 mSv/1,850 MBq)
~2.1 mSv/111 MBq (rest)
~4.6 mSv/244 MBq (stress)
Exercise protocol compatible
–
–
–
+
Quantification
Excellent
Good
Moderate
Very good
Image quality
Good (parametric images)
Very good
Good
Excellent
11.3.1 Perfusion Tracer Characteristics
H2 15O is characterized by fundamentally different properties as compared with 82Rb, 13NH3, and 18F-flurpiridaz [28, 31, 32]. 82Rb is a potassium analog that is rapidly and actively taken up by myocardial cells via the Na/K ATP transporter [33], whereas 13NH3 is incorporated into the glutamine pool by active transport and passive diffusion processes [34]. 18F-flurpiridaz is a pyridazinone derivative that avidly binds to mitochondrial complex-1 [35]. The latter tracers are transported across the cell membrane and effectively become metabolically trapped while cleared from the intravascular compartment, yielding excellent qualitative gradable imaging due to high tissue-to-background ratios. In contrast, H2 15O is a freely diffusible, metabolically inert tracer that promptly reaches equilibrium between blood and tissue and is not accumulated in the myocardium. As a consequence, radiotracer distribution images of H2 15O are of little diagnostic value. The lack of diagnostic images has long prohibited the use of H2 15O for diagnostic imaging of CAD and virtually all studies on qualitative imaging for CAD have been conducted with 82Rb or 13NH3 [36]. In recent years, however, digital subtraction techniques and parametric imaging by automated software packages now generate qualitative gradable H2 15O perfusion images comparable to the aforementioned tracers [37–39]. These developments have enabled H2 15O to be utilized in clinical practice [40–42].
Next to relative uptake images, PET measures absolute levels of tracer concentration. Acquisition of PET in a dynamic fashion (i.e., multiple frames initiated upon administration of the tracer) generates time-activity curves of tracer flux between arterial blood and tissues [28]. This information allows to mathematically compute MBF in absolute terms (in units of mL ∙ min−1 ∙ g−1) and calculate myocardial flow reserve (MFR). The ideal tracer accumulates in/or clears from the myocardium proportionally linear to perfusion, irrespective of flow rate or metabolic state [43]. H2 15O is the only tracer that meets these criteria and is therefore considered the gold standard for quantification of MBF [44]. An important limitation of the other aforementioned tracers is that myocardial extraction from arterial blood is incomplete and curvilinear with increasing flow rates, frequently referred to as the “roll-off” phenomenon (Fig. 11.1) [45].
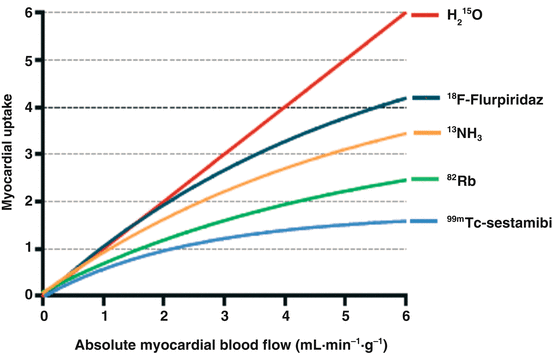

Fig. 11.1
Kinetics of myocardial perfusion tracers; graphical presentation of the relationship between absolute myocardial blood flow of PET radiotracers and actual tracer uptake. 18F-flurpiridaz is not yet available for clinical use
This results in progressive underestimation of MBF measurements as actual flow increases. Correction models based on animal experiments can be employed yet induce noise, particularly when large correction factors are required with severely blunted extraction at high perfusion levels. Nonetheless, each of these tracers has been tested in animal experiments against microsphere-quantified perfusion, the invasive reference standard. H2 15O and 13NH3 in particular have been well validated and display close agreement with microsphere flow and demonstrate low test-retest variability (10–15 %) [31, 44, 46–48]. Quantification of 82Rb is less reliable as this tracer harbors intrinsic limitations (ultrashort physical half-life, long positron range, and low extraction fraction). Nonetheless, recent studies have shown MBF measurements of 82Rb to be feasible [49]. Limited data are available pertaining the quantification of 18F-flurpiridaz, but its characteristics and kinetics should allow for highly reliable perfusion measurements [30, 43, 50].
11.3.2 Tracer Production and Availability
A pivotal issue that has proven to be the major obstacle for cardiac PET perfusion imaging is the necessity to produce the utilized tracers on-site. Of the currently available tracers, H2 15O and 13NH3 require a cyclotron in the near proximity of the scanning facilities. 82Rb is produced by a 82Sr/82Rb generator obviating the need for a cyclotron and is therefore more convenient to implement in clinical practice. The parent isotope 82Sr, however, needs to be replenished every 28 days at relatively high costs ($20.000). Therefore, high volume patient throughput is needed to be cost-effective. These issues of local tracer production have clearly limited the widespread use of cardiac perfusion PET. This may soon be overcome by the dawning perspective of fluorine-labeled tracers such as 18F-flurpiridaz [30]. Its longer physical half-life of 110 min allows for off-site production and could be as successful for cardiology as 18F-FDG PET has been for clinical oncology. Another advantage of 18F-labeled flow tracers is the fact that they allow to be used in physical exercise protocols whereby the radioisotope is administered during maximal exertion. 82Rb, H2 15O, and 13NH3 require injection while the patient is lying within the scanner, as tracer decay is too rapid to transport the patient from the treadmill or stationary bike to the scanner. These tracers can therefore only be utilized in conjunction with pharmacological stressor agents.
11.4 Diagnostic Accuracy and Prognosis
The vast majority of the studies on the diagnostic accuracy have been conducted with static uptake images of 82Rb and 13NH3 [51]. Pooled analysis of these studies displays weighted sensitivity, specificity, NPV, and PPV which were 91, 86, 81, and 93 %, respectively, although it must be acknowledged that virtually all of these studies were compared with invasive coronary angiography without FFR and therefore lack an appropriate reference standard [14]. In comparison with single-photon emission computed tomography (SPECT) and cardiovascular magnetic resonance imaging (CMR), MPI with PET consistently yields the highest diagnostic accuracy [9–11]. Traditionally, these images (regardless of the utilized technique like SPECT, PET, CMR, or CT) are graded in a qualitative manner whereby perfusion defects are identified based on the relative distribution of the tracer. Unfortunately, conditions that are accompanied by lack of normal myocardium to act as reference limit such a qualitative approach and may yield false-negative results or underestimation of the extent of disease (e.g., in the case of multivessel disease and/or microvascular dysfunction). As already mentioned, PET offers the possibility to routinely quantify MBF and thus overcome these limitations (Fig. 11.2).
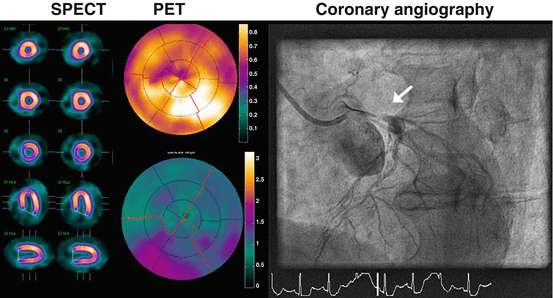

Fig. 11.2
A 73-year-old male with atypical angina without cardiovascular risk factors, and no prior cardiac history was evaluated for coronary artery disease with 99mTc-sestamibi SPECT (left panel rest and right panel stress) and PET (upper panel rest, lower panel stress). Tracer distribution was homogenous during rest and stress on the SPECT images, and the visual and automated grading yielded a normal test result. Polar maps of PET displayed normal resting perfusion but diffusely blunted hyperemic MBF. Coronary angiography revealed a subtotal occlusion of the left main coronary artery (white arrow). SPECT imaging was false negative due to balanced ischemia, which was unmasked by the quantitative nature of the PET imaging
Indeed, there is mounting evidence that quantitative analysis with PET is superior to static uptake image grading [52–55]. Also compelling are the recent observations that hyperemic MBF quantification outperforms MFR to diagnose obstructive CAD, highlighting the potential of stress-only protocols [40, 42, 56, 57]. Reported thresholds of what should be considered pathological hyperemic MBF or MFR are unfortunately not uniform [51]. It appears that cutoff values are, at least in part, related to tracer kinetics and these should not be considered interchangeable [58]. Next to these technical issues, the detection of hemodynamically significant CAD is based on the presence of a flow-limiting epicardial coronary lesion, whereas PET measurements reflect the composite of perfusion throughout the entire coronary artery tree (roughly divided into the epicardial coronary compartment and the microvasculature) (see Fig. 11.3).
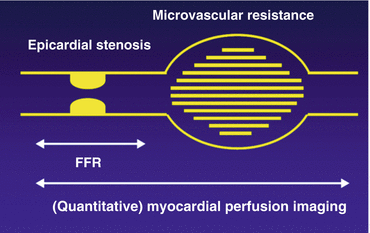

Fig. 11.3
Graphical representation of the coronary vascular bed, divided into the epicardial conduit arteries and the microvasculature. The detection of coronary artery disease is based on the functional evaluation of an epicardial stenosis. Quantitative myocardial perfusion imaging provides an integrated measurement of perfusion of the entire coronary vascular bed, whereas, for example, fractional flow reserve (FFR) solely measures the pressure gradient across the coronary lesion. FFR and perfusion imaging therefore provide different information on coronary vascular health and are not necessarily concordant [51, 59]
Definition of a single threshold will therefore remain elusive given its dependency on microvascular vasomotor function. The latter is related to age, gender, and cardiovascular risk profile [59, 60]. Nonetheless, recently, Danad et al. have explored optimal values for hyperemic MBF and MFR in a large multicenter trial using H2 15O PET whereby each patient was referred for invasive coronary angiography and FFR when appropriate [57]. Optimal thresholds were set at 2.3 mL ∙ min−1 ∙ g−1 and 2.5 for hyperemic MBF and MFR, respectively. For hyperemic MBF, sensitivity, specificity, and accuracy of hyperemic MBF for the detection of functionally relevant CAD were 87, 84, and 85 %, respectively. Of notice, these values were superior to MFR (84, 73, and 77 % for MFR, respectively) (Fig. 11.4). These data now pave the way for quantitative perfusion imaging, potentially with stress-only protocols, to be utilized in clinical practice.
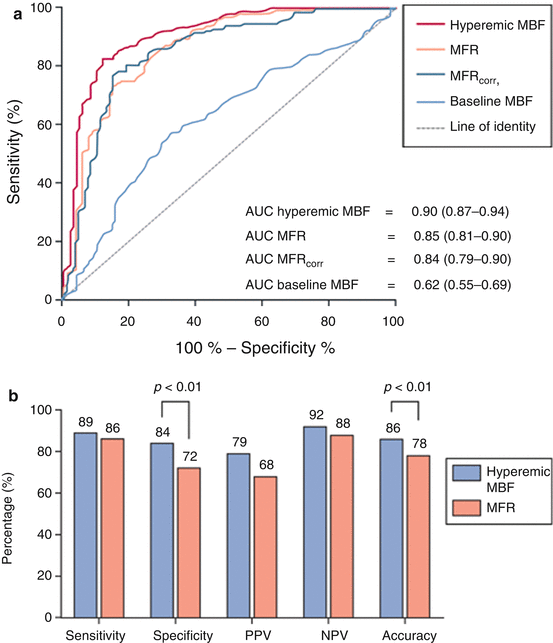

Fig. 11.4
Upper panel: ROC curve analysis with corresponding AUCs and 95 % CI displaying the diagnostic performance of hyperemic MBF, MFR, MFRcorr, and baseline MBF for the detection of hemodynamically significant CAD as indicated by FFR per patient. Lower panel: sensitivity, specificity, PPV, NPV, and accuracy on a per-patient basis of quantitative PET MPI using hyperemic MBF and MFR, respectively, as a perfusion parameter (Adapted from Danad et al. [59])
In terms of prognosis, there is analogy to large-scale SPECT databases [61]. The extent and severity of (reversible) perfusion defects documented with PET hold strong prognostic information beyond traditional cardiovascular risk factors [51]. The quantitative nature of PET has shown incremental value. Of particular interest is the fact that apparent normal perfusion images with a homogenous tracer distribution can be reclassified based on diffusely blunted hyperemic MBF or MFR. Several studies have revealed that this subset of patients is at increased risk for future cardiac events [62–65].
11.5 Hybrid Cardiac PET/CT
Either an anatomical or functional approach in the evaluation of CAD has its limitations. Atherosclerosis is a gradual process that develops over decades. The advancing stages of CAD have been described by Glagov et al. [66]. Fig. 11.5 displays that noninvasive MPI with PET is particularly useful to document myocardial ischemia in advanced disease when coronary lesions become so tight that flow is hampered. In case of a normal scan, however, MPI PET cannot distinguish the different stages prior to the development of ischemia.
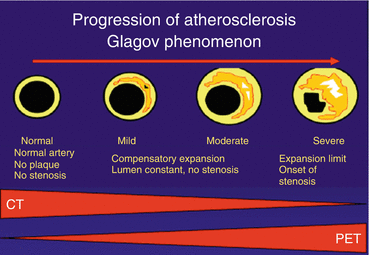

Fig. 11.5
The gradual stages of coronary artery disease. CT-based angiography is particularly useful to document the early stages of disease, whereas PET perfusion only displays abnormalities in the later stages of disease. The combination of CT and PET therefore acts complimentary
Conversely, CCTA can accurately document the very early stages of coronary disease but does not have the ability to predict the hemodynamic consequences in more advanced stage of disease. Therefore, a hybrid assessment provides complementary rather than overlapping information. In recent years, CT technology has been fused with PET. These hybrid devices are now available up to 128-slice CT and state-of-the-art PET equipment, enabling the near simultaneous evaluation of coronary anatomy and quantitative myocardial perfusion in a single scanning session, which can be as short as 30 min (Fig. 11.6).
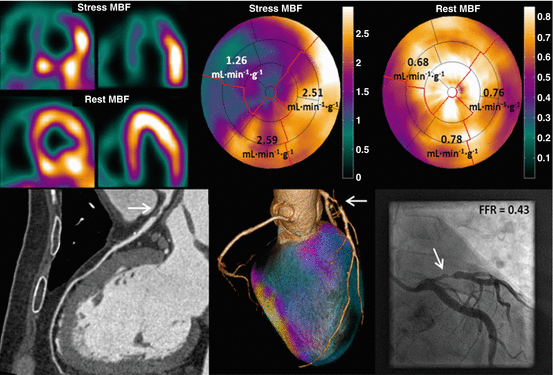

Fig. 11.6
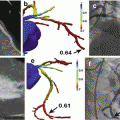
A 52-year-old male with atypical angina. Hybrid 15O-water PET/CTCA imaging reveals a severely reduced hyperemic perfusion (1.26 ml ∙ min−1 ∙ g−1) in the area supplied by the LAD artery with single-vessel disease documented with CCTA. Invasive coronary angiography can be planned with ad hoc percutaneous coronary intervention
The number of studies on the diagnostic value of PET/CCTA for CAD is small yet convincingly demonstrates enhanced accuracy as compared with either modality alone (Table. 11.2) [40, 41, 67, 68]. Similar observations have been made in protocols of CCTA in conjunction with SPECT or CMR [69–73]. Hybrid imaging is shown to be particularly useful for enhancing the moderate specificity and PPV of CCTA.
Table 11.2
Diagnostic performance of cardiac hybrid PET/CCTA imaging (results shown on a per-patient basis)
Author | Hybrid PET/CT system | N | Reference standard for definition of obstructive CAD | Sensitivity CCTA/PET/hybrid (%) | Specificity CCTA/PET/hybrid (%) | NPV CCTA/PET/hybrid (%) | PPV CCTA/PET/hybrid (%) |
|---|---|---|---|---|---|---|---|
Groves et al. [67] | 82Rb PET/64-slice CCTA | 33 | ICA > 50 % | 100/92/96 | 82/89/100 | 100/80/91 | 92/96/100 |
Kajander et al. [41] | [15O]H2O PET/64-slice CCTA | 107 | ICA > 50 % + FFR ≤ 0.80 | 95/95/95 | 87/91/100 | 97/97/98 | 81/86/100 |
Danad et al. [40] | [15O]H2O PET/64-slice CCTA | 120 | ICA > 50 % + FFR ≤ 0.80 | 100/76/76 | 34/82/92 | 100/83/84 | 51/76/86 |
Thomassen et al. [68] | [15O]H2O PET/64-slice CCTA | 44 | ICA > 50 % | 91/91/91 | 64/86/100 | 88/90/92 | 71/87/100 |
Weighted summary | 304 | 97/89/90 | 67/87/98 | 96/88/91 | 74/86/97 |
Besides enhanced diagnostic value, profiling the anatomical and functional status of the coronary tree additionally yields incremental prognostic data. Combining coronary calcium scoring (CAC) with MPI adds prognostic value in patients with and without myocardial ischemia, although ischemia appears to be a more potent predictor of future cardiac events than coronary calcification [74, 75]. To date, studies on the prognostic relevance of PET combined with CCTA are lacking. Nevertheless, data obtained from hybrid SPECT/CCTA studies reveal a more accurate risk stratification of the combined anatomical and functional approach [76, 77]. The hybrid approach provides particular additional value to risk stratify patients when either functional or anatomical evaluation displays ambiguous results. In a large cohort of patients (n = 1,295), Kim et al. recently highlighted that sequential imaging with SPECT and CCTA was of limited incremental prognostic value when either SPECT MPS or CCTA was clearly abnormal (i.e., SSS ≥ 4 or CT-graded diameter stenosis ≥90 %, respectively) [78]. Figure 11.7 displays a proposed algorithm for the diagnostic work-up for patients suspected of CAD. CCTA should be the initial test and be complemented with MPI in case of a documented coronary lesion or poor interpretable CT scan. MPI should subsequently act as gatekeeper for ICA. Adding routine quantitative MBF and MFR with PET appears to provide the most comprehensive diagnostic evaluation in this category of patients.
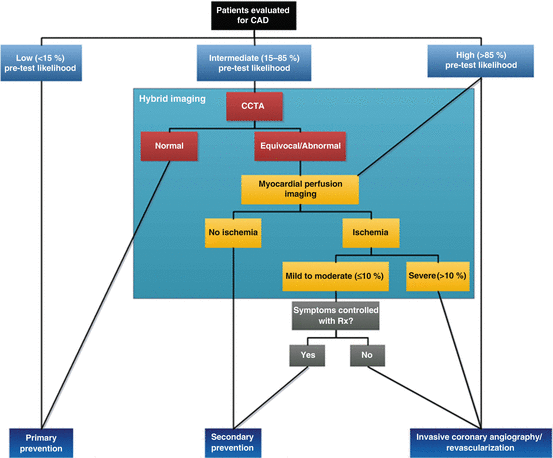

Fig. 11.7
Proposed diagnostic algorithm for diagnosing CAD using CCTA and myocardial perfusion imaging
Even though steadily increasing, the availability of hybrid PET/CCTA is still limited. Therefore, latest efforts have been directed toward deriving physiological information from CT technology directly. Three methodological avenues are currently being explored. First, as adopted from well-defined CMR protocols, CT perfusion (CTP) by acquisition of a dynamic first pass (stress) sequence has demonstrated to be feasible. Although CTP is in its early development and still faces many technical issues, a recent multicenter trial utilizing 320-slice CT scanners demonstrated that CTP enhanced the diagnostic accuracy over CCTA alone [79]. Second, noninvasive estimation of FFR through computational fluid dynamics analysis solely based on the anatomical features of the coronary arteries obtained with CCTA has recently emerged [80]. Multicenter trials have shown that FFR-CT may indeed raise diagnostic accuracy of CCTA [81–83]. The model, however, is based on numerous assumptions and the overall incremental value appears to be limited [82]. Moreover, the tremendous computational complexity requires hours of off-line analysis hampering its implementation in clinical practice for the time being. Hence, a much simpler approach of this principle was proposed as a third option whereby contrast opacification along the course of a coronary artery is documented by linear regression. The rationale behind this so-called transluminal attenuation gradient (TAG) is that contrast opacification may in theory fall off more rapidly in the presence of a functionally significant stenosis than in the absence of stenosis [84]. Although elegant in its simplicity, the fundamental concept of these approaches whereby hyperemic functional consequences of a coronary lesion are attempted to be disclosed at baseline conditions is questionable and lacks additional diagnostic value over CCTA alone [85]. Clearly, deriving functional data from cardiac CT is work in progress.
Stay updated, free articles. Join our Telegram channel

Full access? Get Clinical Tree


