, Joon Woo Lee1 and Eugene Lee2
(1)
Department of Radiology, Seoul National University College of Medicine, Seoul National University Bundang Hospital, Seongnam, South Korea
(2)
Department of Radiology, Seoul National University Bundang Hospital, Seongnam, South Korea
5.3 Bone Island
5.5 Chondrosarcoma
5.6 Chordoma
5.6.1 Illustrations: Chordoma
5.7 Giant Cell Tumor
5.8 Lipoma
5.8.1 Illustrations: Lipoma
5.9 Osteoblastoma
5.10 Osteochondroma
5.11 Osteoid Osteoma
5.12 Osteosarcoma
5.12.1 Illustrations: Osteosarcoma
5.13 Plasmacytoma
5.13.1 Illustrations: Plasmacytoma
5.1 Aneurysmal Bone Cyst (ABC)
- 1.
Epidemiology
10–20 years old
M < F
- 2.
Location
Most common in thoracic spine
Intraosseous
Posterior arch > vertebral body
- 3.
Characteristic imaging findings
Multiloculated cystic mass with fluid-fluid level on MRI due to hemorrhage
Ballooning appearance with cortical thinning
- 4.
Spectrum of imaging findings
Solid enhancing portion suggestive of secondary aneurysmal bone cyst
Cause of secondary aneurysmal bone cyst
Giant cell tumor
Osteoblastoma
Chondroblastoma
- 5.
Differential diagnosis
Giant cell tumor without aneurysmal bone cyst change
Solid portion
No fluid-fluid level
Sacrum
Telangiectatic osteosarcoma
Cortical destruction and paravertebral mass formation
Large solid enhancing portion
5.1.1 Illustrations: Aneurysmal Bone Cyst (ABC)
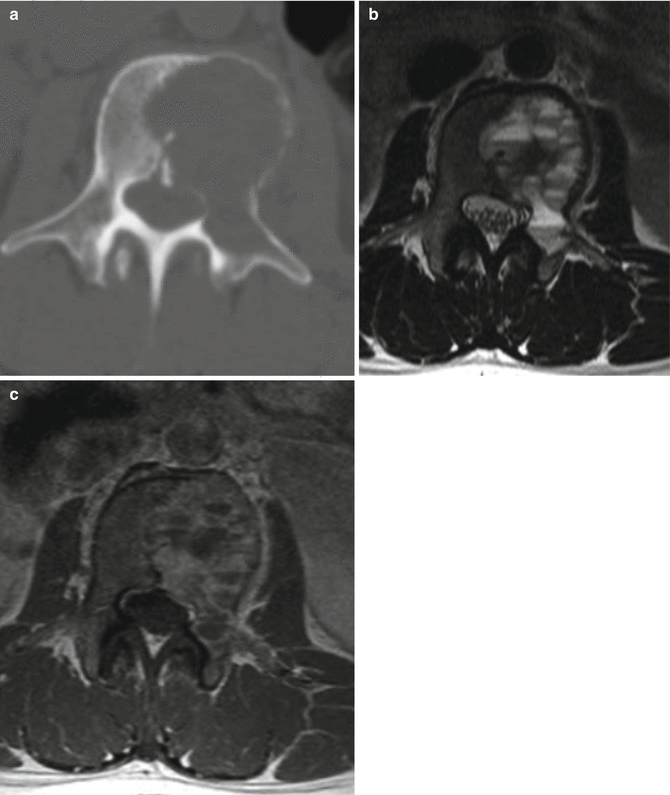
Fig. 5.1
Aneurysmal bone cyst of the L3 vertebrae in a 29-year-old woman. Axial CT scan of the lumbar spine (a) shows an expansile mass with cortical thinning of the L3 vertebral body and left side pedicle. T2-weighted axial MR image (b) shows a multiloculated cystic mass with internal fluid-fluid levels due to hemorrhage. Contrast-enhanced T1-weighted axial MR image (c) shows internal septal wall enhancement
5.2 Benign Notochordal Cell Tumor (BNCT)
- 1.
Epidemiology
Mean: 40 years (10–60 years)
M < F
- 2.
Location
Intraosseous
Sacrococcygeal > skull base > cervical and lumbar vertebrae
- 3.
Characteristic imaging findings
CT: osteosclerosis in the vertebral body
MR: low T1 SI, intermediate to high T2 SI, no contrast enhancement
- 4.
Spectrum of imaging findings
Can be extraosseous
- 5.
Differential diagnosis
Chordoma
Extraosseous components on CT
Contrast enhancement on CE T1WI
Bone destruction on CT
Hemangioma
High signal on T1-weighted image
If low signal on T1-weighted image, enhancement due to vascular component (vascular hemangioma)
No osteosclerosis, thickening of vertical trabeculation
5.2.1 Illustrations: Benign Notochordal Cell Tumor (BNCT)

Fig. 5.2
Benign notochordal cell tumor of the C5 vertebrae in a 34-year-old man. T2-weighted sagittal and axial MR images (a, b) show a heterogeneous high signal intensity mass in the central portion of the C5 vertebral body. The mass shows low signal intensity on T1-weighted sagittal MR image (c). Contrast-enhanced T1-weighted sagittal MR image (d) shows no enhancement of the mass

Fig. 5.3
Benign notochordal cell tumor of the C5 vertebrae in a 41-year-old man. C-spine CT sagittal image (a) shows ill-defined sclerosis in the central portion of the C5 vertebral body (black arrow). T2-weighted sagittal MR image (b) shows homogenous high signal intensity within the mass. Contrast-enhanced T1-weighted axial MR image (c) shows no enhancement of the mass (white arrows)

Fig. 5.4
Benign notochordal cell tumor of the C4 vertebrae in a 51-year-old woman. C-spine CT sagittal image (a) shows diffuse sclerosis involving the entire C4 vertebral body (white arrow). T2-weighted sagittal MR image (b) shows homogenous high signal intensity of the C4 vertebral body. Contrast-enhanced T1-weighted sagittal MR image (c) shows low signal intensity with no enhancement
5.3 Bone Island
- 1.
Epidemiology
- 2.
Location
Anywhere in the spine
- 3.
Characteristic imaging findings
Small round foci of dense bone within the medullary space on radiography and CT
Radiating spicules at the margins blending with surrounding trabeculae
“Thorny radiating” or “fingers”
Low signal intensity on all MR sequences
- 4.
Spectrum of imaging findings
Giant bone island
More than 1 cm
Heterogeneous signal on MR
Increase in size over time
- 5.
Differential diagnosis
Osteoblastic metastasis
Enhancing area within or margin of the mass
Multiple
Osteolytic masses in the other site
Osteosarcoma
Mixed areas of osteoblastic and osteolytic
Irregular margin
Extraosseous component
5.3.1 Illustrations: Bone Island
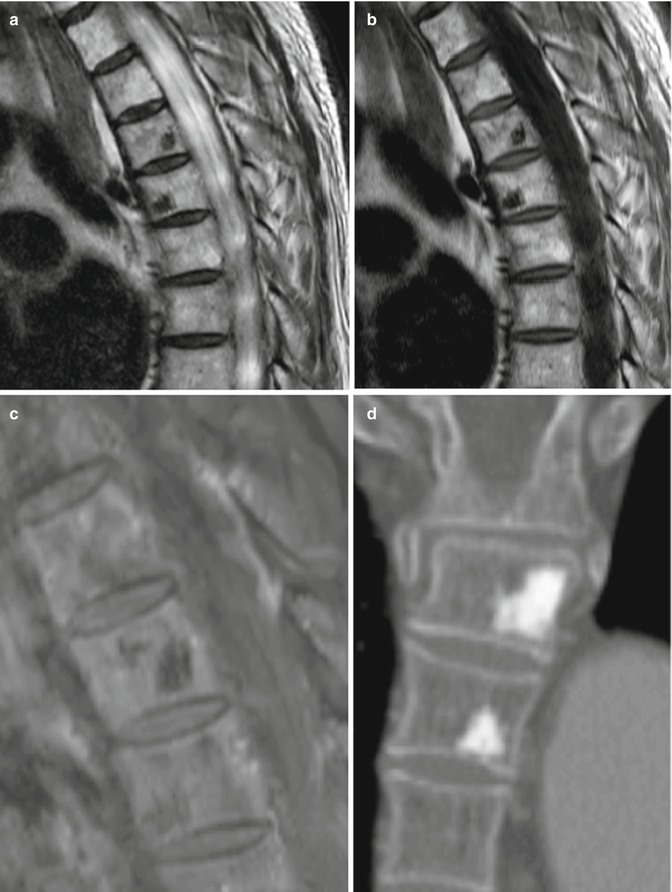
Fig. 5.5
Bone islands in a 75-year-old man. T2-weighted (a) and T1-weighted (b) sagittal MR images show dark signal foci in the T4 and T5 vertebral bodies. T1-weighted sagittal image with contrast enhancement (c) shows no enhancement. Coronal image from the chest CT (d) shows sclerotic bone lesions in the same area

Fig. 5.6
Bone island in a 74-year-old man. Coronal and axial L-spine CT images (a, b) show well-defined dense sclerosis in the left superior aspect of the L1 vertebral body. T2-weighted sagittal MR image (c) shows dark signal intensity of the lesion. T1-weighted sagittal MR image with contrast enhancement (d) shows no enhancement

Fig. 5.7
Growing large bone island in a 66-year-old woman. CT axial image (a) shows a 1.9 cm dense sclerotic lesion in the L1 vertebral body. T2-weighted (b) and T1-weighted axial MR images (c) show dark signal intensity of the lesion. T1-weighted axial MR image with contrast enhancement (d) shows no enhancement. Biopsy reveals histology results consistent with a bone island
5.4 Cavernous Malformation (Intramedullary Cavernous Hemangioma, Cavernoma)
- 1.
Epidemiology
F>M (2:1)
20–50 years
- 2.
Location
- 3.
Characteristic imaging findings
Reticulate appearance with areas of mixed signal intensity on both T1WI and T2WI
Rim of low signal (T2WI) due to hemosiderin
No definite enhancement
- 4.
Spectrum of imaging findings
Acute hemorrhage
Foci of acute hemorrhage: low signal on T2-weighed image and high signal on T1-weighed image
Spinal cord edema and swelling: area of T2-hyperintensity around the hemorrhagic foci
- 5.
Differential diagnosis
Spinal cord AVM
Abnormal vascular mass in the spinal cord
Engorged perimedullary veins
Spinal cord metastasis
Enhancing mass with extensive cord edema
Ependymoma
Enhancing mass
Syrinx
5.4.1 Illustrations: Cavernous Malformation

Fig. 5.8
Intramedullary cavernous malformation of the C2 vertebral body in a 71-year-old woman. T2-weighted sagittal MR image (a) shows a mixed hyperintense mass with hypointense hemosiderin rim in the posterior portion of the spinal cord (black arrow). T1-weighted sagittal MR image (b) shows a peripheral high signal intensity area. Contrast-enhanced T1-weighted sagittal MR image (c) shows no definite enhancement
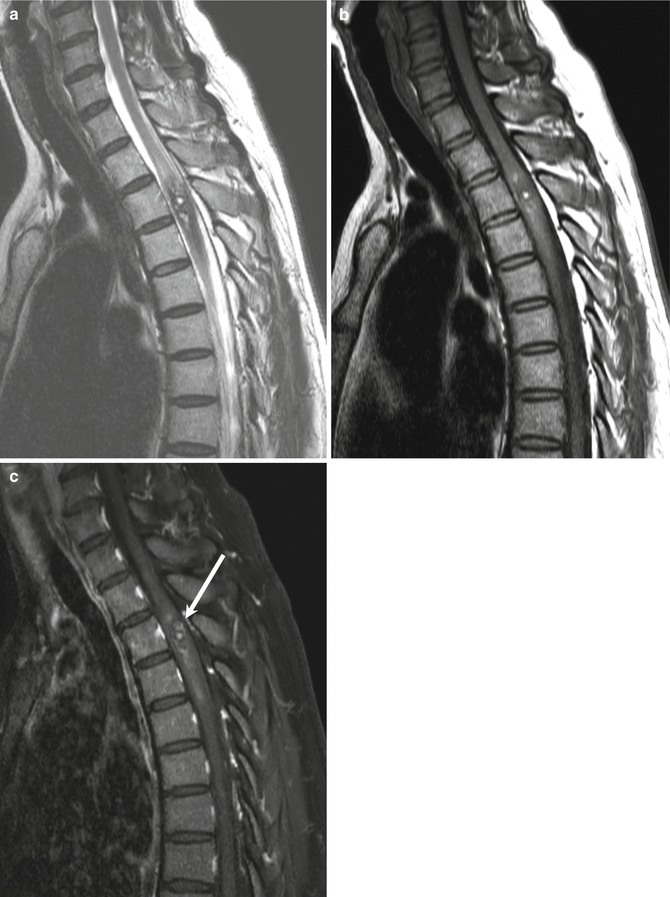
Fig. 5.9
Intramedullary cavernous malformation in a 47-year-old woman. T2-weighted (a) and T1-weighted (b) sagittal images show an ill-defined intramedullary heterogeneous signal intensity mass with extensive hemorrhage and reactive edema/swelling involving the T1–T4 levels. T1-weighted sagittal MR image with contrast enhancement shows (c) mild enhancing portion of the lesion at the T2 vertebral body level

Fig. 5.10
Intramedullary cavernous malformation at T5/T6 level in a 67-year-old man. T2-weighted sagittal MR image (a) shows a small popcorn-like hyperintense intramedullary mass with hypointense hemosiderin rim in the spinal cord. T1-weighted sagittal MR image (b) shows similar signal intensity to the spinal cord. Contrast-enhanced T1-weighted sagittal MR image (c) shows a focal enhancing area

Fig. 5.11
Intramedullary cavernous malformation of the T9 vertebral body level in a 51-year-old woman. T2-weighted sagittal MR image (a) shows a small heterogeneous popcorn-like signal intensity intramedullary mass. Extensive cord edema in the upper thoracic level is noted. T1-weighted sagittal MR image (b) shows a peripheral high signal intensity area. Contrast-enhanced T1-weighted sagittal MR image (c) shows no definite enhancement (white arrow)
5.5 Chondrosarcoma
- 1.
Epidemiology
30 years ( 13–78 years)
M = F
- 2.
Location
Thoracic spine > cervical, lumbar spine
Vertebral body
- 3.
Characteristic imaging findings
“Rings and arcs,” punctate calcifications
Osteolytic mass with paravertebral extension
Mixed areas of high signal (non-mineralized chondroid matrix) and low signal (mineralized) on T2-weighted image
Peripheral and lobulated rim enhancement
- 4.
Spectrum of imaging findings
- 5.
Differential diagnosis
Osteosarcoma
Dense internal ossification
Lumbosacral
Ewing’s sarcoma
Permeative transcortical extension
Younger patients
No internal calcifications
Metastasis
No internal calcification
Chordoma
Bright high signal on T2-weighted image
Multilobular appearance
Less internal calcifications
Sacrum, high cervical
Variable enhancement
5.5.1 Illustrations: Chondrosarcoma

Fig. 5.12
Chondrosarcoma involving a thoracic vertebral body and left rib. Axial CT scan of thoracic spine (a) shows a destructive vertebral mass containing fine, stippled calcifications. Left rib destruction is also noted. T2-weighted axial MR image (b) shows a heterogeneous signal intensity mass extending into the epidural and left paravertebral spaces. Contrast-enhanced T1-weighted axial MR image (c) shows heterogeneous enhancement

Fig. 5.13
Chondrosarcoma at the T3 paravertebral space in a 45-year-old woman. Axial CT scan of thoracic spine (a) shows a lobulated right paravertebral mass widening the right T3/4 neural foramen. A few fine, stippled calcifications within the mass are noted. T2-weighted axial MR image (b) shows predominantly high signal intensity with internal hypointense septa-like structures. Epidural extension compressing the spinal cord to the left is noted. Contrast-enhanced T1-weighted axial MR image (c) shows enhancement of the peripheral rim and internal septa


Fig. 5.14
Chondrosarcoma in a 75-year-old man. Sagittal and axial CT images (a–c) demonstrate calcifications in the left anterior epidural space and neural foramen (white arrows). Bony erosion with a sclerotic rim is seen at the posterior surface of the C7 body. Cervical spine MRI reveals an epidural mass with T2 hyperintensity and peripheral enhancement (d–g), encircling the dural sac and causing cord compression at the level of C5-T1. Axial T1-weighted image (h) shows a nodular lesion with hyperintensity on both T1- and T2-weighted images in the left epidural space and neural foramen (black arrow), suggestive of calcification or ossification. Erosion of the posterior surface of the C7 body is also noted
5.6 Chordoma
- 1.
Epidemiology
>40 years

Stay updated, free articles. Join our Telegram channel

Full access? Get Clinical Tree


