Optimal breast magnetic resonance imaging (MRI) interpretation depends on the image reader’s ability to both detect and accurately characterize contrast enhanced breast lesions. Detecting areas of enhancement involves the tedious process of comparing the precontrast and postcontrast sequences. This process can be facilitated with subtraction images; however, even a small amount of patient motion can degrade subtraction images, limiting their utility.
Once an abnormality is detected, lesion characterization on breast MRI, similar to mammography and ultrasound, relies heavily on morphologic analysis (lesion shape, margins and internal pattern). Because of the considerable overlap in the morphologic features of benign and malignant lesions, reliance on morphology alone has its limitations. Besides using morphology, incorporating a lesion’s enhancement kinetics (enhancement time curve) improves specificity. Although kinetic analysis can be performed subjectively by visually assessing the change of a lesion’s signal intensity between the early to late postcontrast sequences, visual estimation of enhancement kinetics is inaccurate, especially because many breast lesions contain a mixture of kinetic patterns. Therefore quantitative methods to objectively characterize and analyze a lesion’s enhancement kinetics are necessary.
Unfortunately, quantitative kinetic analysis is not possible on most generic picture archiving and communication system (PACS) workstations. Computer-aided detection (CAD) systems have been developed to both improve detection of areas of enhancement and facilitate the extraction and analysis of kinetic information. This chapter will discuss the use of CAD methods to improve breast MRI interpretation.
Principles of Breast Magnetic Resonance Imaging Interpretation
The sensitivity of breast MRI for detecting breast cancer is high, within the range of 93% to 100%. The primary limitation of dynamic contrast enhanced MRI is a relatively low specificity, reported to be between 37% and 97%. Almost all malignant lesions will enhance after gadolinium administration, and comparing the precontrast and postcontrast sequences to detect areas of enhancement is essential in detecting malignancies. In subtraction images, the precontrast images are subtracted from the postcontrast images, making areas of enhancement more apparent. However, because both benign and malignant breast lesions can enhance, identification of enhancement alone is not sufficient.
Breast MRI specificity relies on analysis of a lesion’s morphological features to distinguish a benign from malignant lesion. Benign lesions tend to be oval with smooth margins and homogeneous internal enhancement, whereas malignant lesions tend to have a round or irregular shape with irregular margins and heterogeneous internal enhancement.
Besides using morphology, breast MRI specificity may be further improved by analyzing lesion kinetics. Some malignant lesions produce angiogenic factors, such as vascular endothelial growth factor (VEGF), that induce the growth of existing capillaries and the formation of vessels to allow the tumor to grow and invade the tissue. The vessels formed by tumor angiogenesis are abnormal and are more porous or leaky than native vessels. Increased enhancement of some cancers relative to the normal, surrounding parenchyma may result from both an increased supply of gadolinium through this proliferative network of vessels and their increased permeability. Increased vascular permeability also results in earlier wash-out of contrast from malignant lesions than from normal breast parenchyma. Therefore lesions on MRI that demonstrate rapid early enhancement followed by a wash-out pattern raise suspicion for associated angiogenesis. For detecting enhancing lesions and assessing their enhancement patterns over time, dynamic contrast-enhanced MRI (DCE-MRI) requires a precontrast and multiple postcontrast sequences (usually three to five).
Computer-Aided Detection for Registration Correction
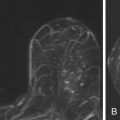
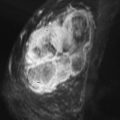
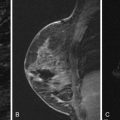
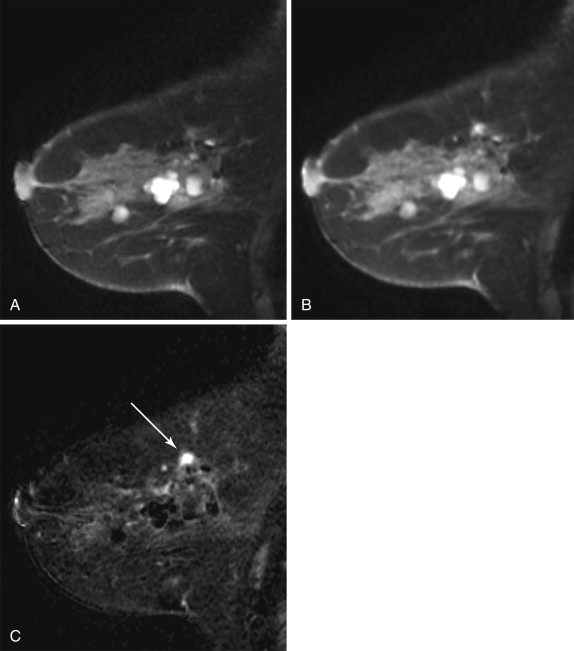
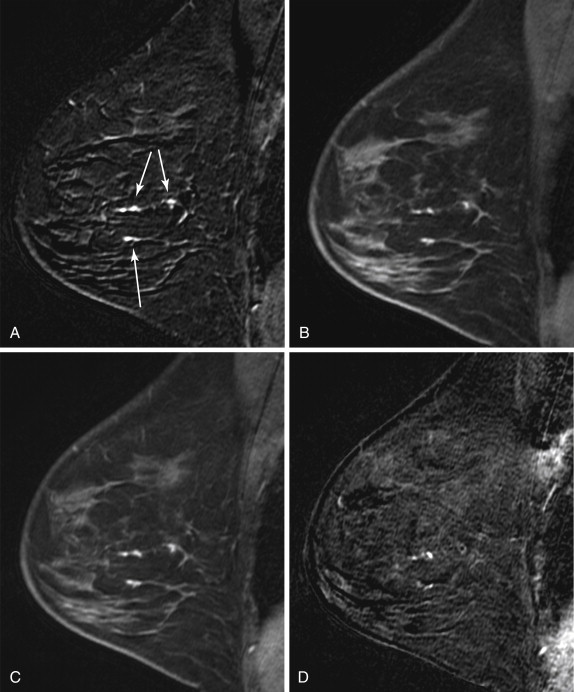
Many radiologists prefer to interpret subtracted images (postcontrast minus precontrast) because only areas of enhancement in the breast are displayed, reducing distractions and facilitating detection of enhancing lesions ( Figure 3.1 ). However, the quality of subtracted images is significantly affected by patient motion. Most MRI CAD systems, which were developed to allow automated kinetic analysis, provide image registration correction to improve alignment of sequences affected by slight patient motion and reduce subtraction artifact ( Figure 3.2 ). MRI CAD systems usually can correct only for two-dimensional patient motion (the patient rolling left-right or in-out of the coil), not for three-dimensional patient motion (the patient sliding up or down in the magnet). Registration correction is particularly important for breast MRI studies in which fat suppression is not performed and subtraction images are heavily relied upon. Additionally, image registration correction allows for improved three-dimensional image reformation and maximal intensity projection (MIP) generation. However, significant patient motion can lead to erroneous findings on the subtraction images that cannot be overcome by MRI CAD registration correction algorithms. In those instances, interpretation should be based on the source images rather than the subtracted images. Generally, subtraction images should be used only to help detect enhancing lesions. Once detected, the unsubtracted (source) images should be used for analysis of lesion morphology.
Enhancement Curves
Breast tumors tend to demonstrate early enhancement, whereas normal breast parenchyma enhances slowly. Therefore neoplasms are most discernible in the early postcontrast phase, about 60 to120 seconds after contrast injection. If the MR acquisition time is longer than 2 minutes, the first postcontrast images may be acquired too late to depict the true time-signal intensity curve of a lesion (low temporal resolution), leading to inaccurate kinetic results.
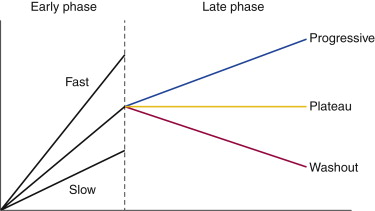
In DCE-MRI, enhancement curves are divided into two phases of enhancement: early phase, between contrast injection and the second postcontrast minute; and late phase, after the second postcontrast minute ( Figure 3.3 ). The American College of Radiology Breast Imaging Reporting and Data System (BI-RADS) lexicon characterizes kinetic curves obtained during the initial early phase of enhancement as slow, medium, or rapid. Typically, malignant lesions exhibit a higher rate of initial enhancement than benign lesions do. The time course of enhancement during the late phases can also be analyzed using time-intensity curves, which are classified into three types:
- •
Progressive (type 1): Enhancement continues throughout the dynamic series.
- •
Plateau (type II): Enhancement reaches a steady state after the early phase. Peak enhancement is reached immediately after the early phase, with little signal variation during the late phases.
- •
Washout (type III): Enhancement decreases after reaching early-phase peak enhancement.