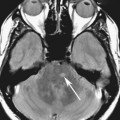
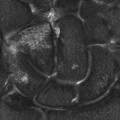
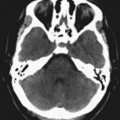
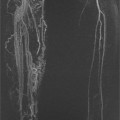
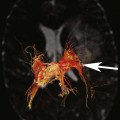
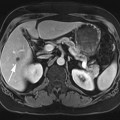
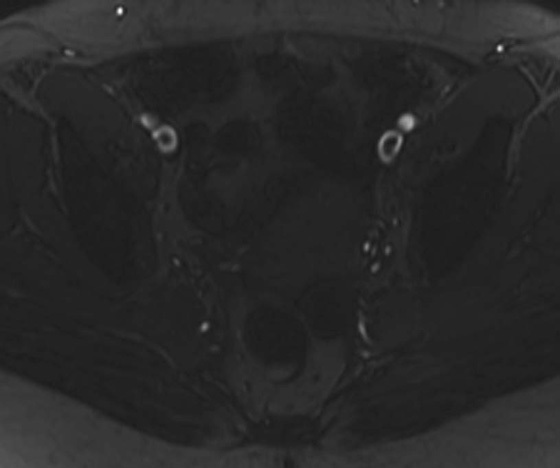
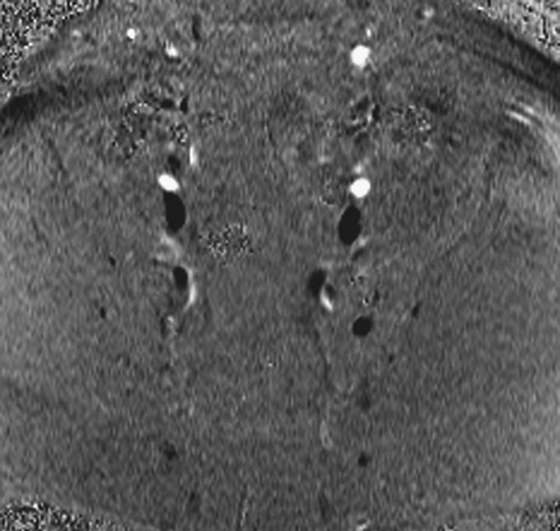
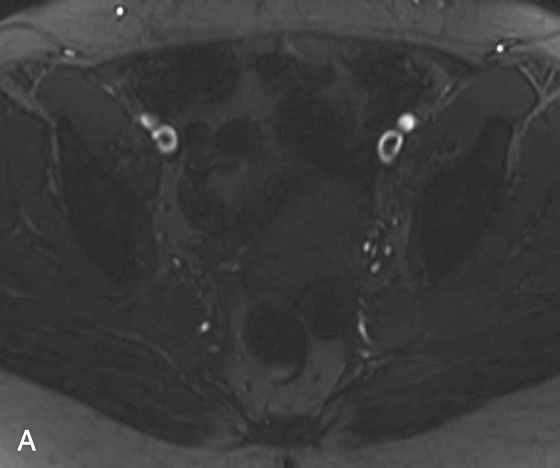
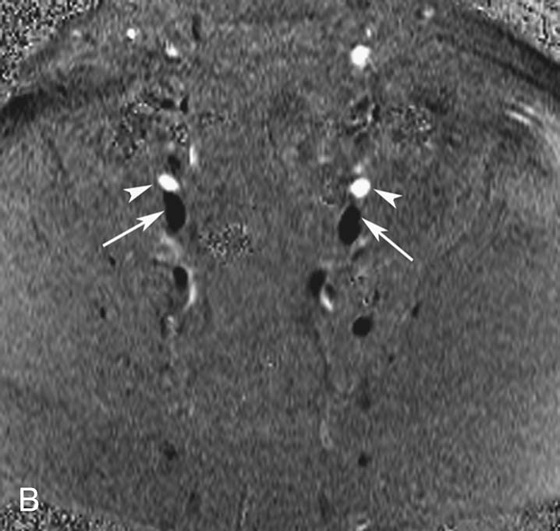
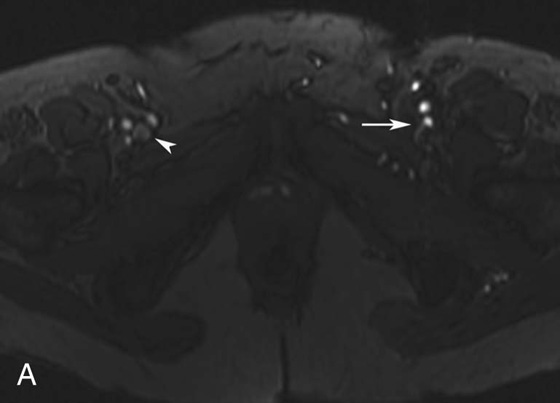
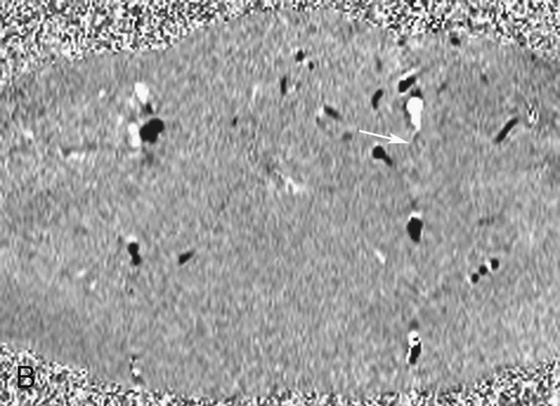
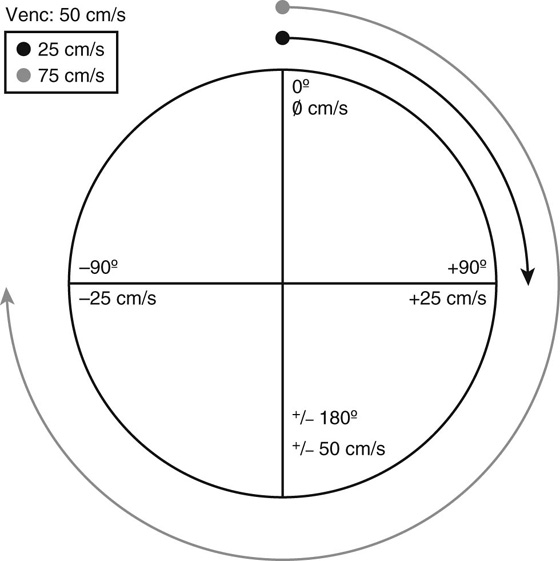
Chapter 13 Scott M. Duncan and Timothy J. Amrhein 1. What are possible etiologies for the low signal intensity within the bilateral external iliac veins? Are there bilateral deep vein thromboses (DVTs)? If not, why are there filling defects on the gradient-recalled echo (GRE) image? 2. What is the most sensitive magnetic resonance (MR) sequence for detecting slowly flowing blood? 3. Why do the arteries and veins have opposite signal intensities on the phase-contrast image (i.e., the arteries appear hyperintense or white and the veins appear hypointense or black)? 4. Which two types of information can you obtain with a phase-contrast sequence? 5. In which plane is flow being detected on this phase-contrast image, perpendicular or parallel to the image? FIGURE 1A. Axial T1-weighted gradient-recalled echo (GRE) image. Filling defects are seen in the bilateral external iliac veins. FIGURE 1B. Axial phase-contrast image. There is hyperintense signal in bilateral external iliac arteries (arrowheads). Hypointense signal is seen in the bilateral external iliac veins (arrows). 1. The low signal intensity centrally within the bilateral external iliac veins may represent thrombus or flow artifacts on the GRE image. However, the phase contrast image confirms that there is no DVT and this represents flow artifacts. There are two reasons for the filling defects on the GRE images. First, there is a component of flow-related dephasing. Second, the flow in the veins is too slow to result in flow-related enhancement. 2. Phase contrast is the most sensitive MR sequence for detecting slowly flowing blood. 3. The labeling of flow direction is arbitrary. Hyperintense (white) signal signifies flow in one direction and hypointense (black) signal signifies flow in the opposite direction. In this case, the hyperintense signal represents craniocaudal flow and hypointense signal represent caudocranial flow. 4. One can generate two images from a phase-contrast sequence, a phase-contrast image and a magnitude image. 5. Through-plane flow, or flow that is perpendicular to the imaging plane, is detected on the phase contrast image. Patent vasculature without deep vein thrombosis (DVT). The central areas of low signal within the iliac veins on the gradient-recalled echo (GRE) image are concerning for bilateral venous thrombosis. However, this finding could also be secondary to slow-flowing blood. A phase-contrast image through the concerning level was obtained for further clarification. On the phase-contrast image, there is hypointense signal within the bilateral external iliac veins confirming flow within the vessel and excluding a thrombus. FIGURE 2A. Axial T1-weighted GRE image. There is flow-related enhancement in the right femoral vein (arrowhead), and no flow-related enhancement in the left femoral vein (arrow). FIGURE 2B. Axial phase-contrast image. Hypointense, black signal is seen at the confluence of the right superficial and deep femoral veins. Only gray signal is seen on the left (arrow). Hyperintense, white signal is seen in the bilateral femoral arteries laterally. DVT in the left femoral vein. In this case, the phase-contrast image supports the findings on the GRE image and confirms a left femoral vein DVT. Given phase contrast’s increased sensitivity to slow flow, the absence of signal within the left femoral vein means the diagnosis of a DVT can be made with more confidence.1,2 Phase contrast is an additional noncontrast magnetic resonance (MR) angiographic technique. The information from phase contrast can be utilized in two separate ways: to produce traditional angiographic images or for flow quantification. Because time-of-flight (TOF) and contrast angiography are much faster sequences, phase contrast is rarely used to produce angiographic images. Instead, it is most often utilized to obtain physiologic information or to problem solve when other angiographic images give equivocal results.3 Specifically, it is the most sensitive sequence for detecting slow-flowing blood, and unlike any other MR sequence, can give velocity, flow, and pressure data.3–5 Two types of information are acquired when an MR echo is recorded: magnitude and phase. It is analogous to a vector; the magnitude determines the length and the phase determines the direction (from 0° to 360°). To generate most images, the phase information is disregarded and only the magnitude information is displayed. However, there are scenarios when the phase information is useful. Phase information is utilized to localize signal in the phase-encoding direction. Protons along the phase-encoding gradient acquire different phases depending on their location along the gradient. For example, a proton at the weaker end of the gradient that experiences a 1.49T magnetic field will spin slightly slower than a proton in the middle of the gradient that experiences a 1.5T magnetic field. As the protons spin at different frequencies, they obtain different phase shifts, which can be used to map the location of the proton within the body. Phase-contrast sequences use this same principle, but employ special gradients to eliminate the phase differences between stagnant protons while accentuating the phase differences in moving protons. In phase-contrast sequences, moving protons experience a changing magnetic field and therefore accumulate a phase that is different from stationary protons, which experience a constant magnetic field. Since faster flowing protons travel a farther distance through the gradient than do slower moving protons, their phase difference (in comparison with stationary protons) will be greater than that of the slower flowing protons. In summary, in phase contrast, phase differences are proportional to a proton’s velocity, which can be calculated.3 In addition to velocity, the phase shift is also proportional to the magnitude of the gradient, with larger gradients producing more phase shift per distance traveled. Therefore, for a given velocity, the degree of phase shift can be manipulated by adjusting the size of the gradient. To illustrate, consider a proton moving through a gradient with a constant velocity of 10 cm/sec. In a gradient ranging from 1.49T to 1.51T, the proton may accumulate +90° of phase shift. If the gradient were doubled to 1.48T to 1.52T, the proton would accumulate twice the phase shift, or +180°. The ability to adjust the gradient is important because phase shifts greater than ±180° result in aliasing, similar to Doppler ultrasound. As another example, consider a gradient that gives a proton with a velocity of 50 cm/sec a +180° phase and one with a velocity of −50 cm/sec a −180° phase. What if a proton has a velocity of 75 cm/sec? The proton will develop a +270° phase shift, which will be incorrectly labeled as a −90° phase shift. This is an example of aliasing as the proton is incorrectly calculated to have a −25 cm/sec velocity (Fig. 1). Fortunately, we do not have to calculate the ideal size of the gradient ourselves. Instead, we enter a VENC value, or velocity encode value, which the computer uses to calculate the size of the gradient. The VENC value is the maximum velocity that can be correctly measured by the sequence before aliasing occurs. In other words, the computer sets the gradient so that the VENC value (maximum projected velocity) will result in a ±180° phase shift (in the example above, the VENC value would be 50 cm/sec). The closer the VENC is set to the measured velocity, the more accurate the measurement. If the VENC value is set too low (as in the example above), aliasing will occur. If the VENC value is set too high, slower velocities will not be measured accurately and the signal-to-noise ratio will decrease. The ideal VENC value for evaluating the venous sinus and veins is usually around 20 to 30 cm/sec.3 For arterial blood, the VENC is usually greater than 100 cm/sec and can be as high as 300 or 400 cm/sec depending on the vessel that is being evaluated and on the degree of stenosis present.3 Adjusting the VENC value is similar to adjusting the maximum velocity of Doppler ultrasound. The ability to manipulate the VENC value is one reason that phase contrast is the most sensitive MR sequence for the detection of slow-flowing blood. In Cases 1 and 2, the VENC was set to 30 cm/sec, resulting in successful detection of the slow-flowing blood in the iliac veins. Phase contrast is a gradient-recalled echo (GRE) sequence that uses bipolar gradients to acquire signal. The two lobes of the bipolar gradient, often called the dephasing and rephasing lobes, are identical in magnitude and time, but exactly opposite in direction. Stationary protons experience two gradients that are exactly opposite to each other, resulting in a return to a net 0° phase. This occurs regardless of the position of the proton along the gradient. Moving protons, in contrast, will change locations in between the two lobes of the bipolar gradient, which results in two different magnetic field strengths influencing the phase of the proton. This difference results in an accumulation of a net change in phase relative to the stationary proton.6
Phase Contrast
CASE 1
ANSWERS
CASE 1
Diagnosis:
Discussion:
CASE 2
Diagnosis:
Diagnosis:
Physics Discussion
Related posts:
![]()
Stay updated, free articles. Join our Telegram channel

Full access? Get Clinical Tree


Contrast