Fig. 1.
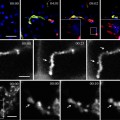
Example of Correlative light–electron microscopy (CLEM) for analysis of the ultrastructure of green fluorescent protein (GFP)-GGA1 transport carriers. (a) HeLa cells were transfected with a plasmid encoding GFP-GGA1, incubated for 30 min with TRITC-dextran (to discriminate between endocytic and biosynthetic structures), and imaged using confocal fluorescence microscopy. The area of interest (outlined by the box corresponding to the inset) contains GFP-GGA transport carriers that were fixed during the acquisition of the time-lapse sequence (numbered as 1–3; indicated by arrows). (b) Sequence of time-lapse frames (B1–B4) shows the movements of the three transport carriers shown in (a) and inset, from the juxtanuclear area towards the cell periphery. The cell of interest was quickly fixed during the course of observation (B4), and all three of these transport carriers were found again (see inset in (a)). (c) The cells were then prepared for immunogold EM with an anti-GFP antibody. This low magnification EM image shows the same cell and the same area of interest (box) as in (a). (d) Appearance of these three transport carriers labeled with an anti-GFP antibody, as shown in four serial thin sections (D1–D4). The white arrowhead, the black arrow, and the white arrow indicate the same three transport carriers shown in the box and inset in (a) (numbered from 1–3, respectively). (e–g) Higher magnification of all three of these transport carriers allows the clathrin coat at their surface to be appreciated. (h, i) Three-dimensional reconstructions of two of these GFP-GGA1-containing transport carriers (numbers 1 and 3), which correspond to structures 1 and 3 indicated in (a–e) and (g).

Fig. 2.
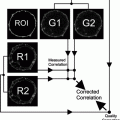
The stages of CLEM. Illustration of the sequence of the main steps during the CLEM procedure. small arrows indicate the structure of interest, while long arrows display transition from one step of the procedure to the other. For further details, see main text.
2 Materials
1.
35 mL Glass grid-bottomed dishes (MatTek Corporation-P35G-2-14-C-grid).
2.
HEPES: 200 mM, pH 7.3.
3.
Paraformaldehyde (PFA): 4% solution in 200 mM HEPES, pH 7.3. Weigh out 4 g PFA and add to 100 mL of 200 mM HEPES in a glass beaker with a magnetic stirring bar, and warm to about 70°C. Stir for a maximum of 10 min to obtain a clear/transparent solution; adjust to a final volume of 100 mL with the 200 mM HEPES. Filter the solution with a piece of soft filter paper using a funnel. Store at 4°C.
4.
Mixture of 4% PFA and 0.05% glutaraldehyde (GA). To 10 mL of 4% PFA solution in 200 mM HEPES (pH 7.3) in a plastic container, add 62.5 μL of 8% GA to obtain a mixture with the required final concentrations.
5.
Phosphate-buffered saline, (PBS, pH 7.4), containing NaCl, KCl, Na2HPO4, KH2PO4.
6.
Blocking/permeabilization solution: 0.5% BSA, 0.1% saponin, 50 mM NH4Cl in PBS. Weigh out 0.5 g BSA, 0.1 g saponin, 0.27 g NH4Cl. Add these to PBS, to a final volume of 100 mL.
7.
Primary polyclonal antibody against GFP (Abcam, Cat N AB 290-50).
8.
Anti-rabbit Fab′ fragment complexed to 1.4 nm gold particles (Molecular Probes, Cat N 2004 anti-rabbit nanogold).
9.
Gold enhancement (Nanoprobes, Cat N 2113, GoldEnhancement for EM).
10.
Phosphate buffer: 100 mM, pH 6.8. Prepare solution A as 200 mM dibasic sodium phosphate. Weigh 35.61 g Na2HPO4·2H2O and dissolve it in 1 L water. Prepare solution B as 200 mM monobasic sodium phosphate. Weigh 31.21 g NaH2PO4·2H2O and dissolve it in 1 L water. Mix 24.5 mL of solution A with 25.5 mL of solution B, and make up to a total volume of 100 mL with water.
11.
Osmium tetroxide (OsO4): 2% solution in water.
12.
Potassium ferrocyanide (K4(Fe(CN)6)·3H2O): 3% solution in water.
13.
Thiocarbohydrizide (CH6N4S): 1% solution in water.
14.
Uranyl acetate (UO2(CH3COO)2·2H2O): 0.5% solution in water.
15.
Ethanol (C2H5OH): 100%.
16.
Epoxy resin (EPON): add 33.6 g EPON (Fluka, Cat N 45345), 21.0 g dodecenyl succinic anhydride (DDSA; Fluka, Cat N 45346), and 16.8 g methyl nadic anhydride (MNA; Fluka, Cat N 45347) together in a test tube. Heat the tube in an oven for 2–3 min at 60°C, and mix gently. Add 0.96 g of 2,4,6-Tris(dimethylaminomethyl)phenol (DMP-30; Sigma, Cat N 45348) and mix gently. EPON aliquots can be frozen and stored at −20°C before use.
17.
Slot grids covered with carbon-formvar supporting film, Cu-slots (Electron Microscopy Science-FCF 2010-Cu-slots).
18.
Pick-up perfect loop (Agar, Cambridge, England).
19.
Tweezers.
20.
Diamond knife.
21.
Hydrofluoric acid: 40%.
22.
Special EPON-made resin blocks. Prepare EPON resin blocks before starting the CLEM procedure. Fill the embedding capsules (Polyscience, Inc., no. 08408-50) with fresh EPON and polymerize in an oven at 60°C for 24 h.
3 Methods
3.1 Cell Transfection, Observation, and Fixation
1.
CLEM starts with placing the cells of interest into the 35-mm glass grid-bottomed Petri dishes, from MatTek (see Note 1).
2.
The day after seeding the cells, they are transfected with the GFP-tagged chimera of interest. Alternatively, stably transfected cell lines can also be used for CLEM.
3.
The following day, observe the expressing cells, or the stable cell line under the light microscope, which allows acquisition of time-lapse series of images (see Note 2).
4.
Draw the position of the cell of interest on the map available from MatTek. Grab the image with the cell position on the MatTek grid in phase contrast and fluorescence channels.
5.
 Intravital Microscopy to Image Membrane Trafficking in Live Rats
 Colocalization Analysis in Fluorescence Microscopy
 High-Pressure Freezing for Scanning Transmission Electron Tomography Analysis of Cellular Organelles
 Morphological Analysis of Autophagy
 A Novel Combined Imaging/Morphometrical Method for the Analysis of Human Sural Nerve Biopsies for Clinical Diagnosis
 Environmental Scanning Electron Microscopy in Cell Biology


Related posts:
Intravital Microscopy to Image Membrane Trafficking in Live Rats
Colocalization Analysis in Fluorescence Microscopy
High-Pressure Freezing for Scanning Transmission Electron Tomography Analysis of Cellular Organelles
Morphological Analysis of Autophagy
Environmental Scanning Electron Microscopy in Cell Biology
Stay updated, free articles. Join our Telegram channel
Full access? Get Clinical Tree
