Fig. 1.
Our combined confocal-pTIRFM-SPM microscope comprising an Olympus IX-70 inverted microscope, an Olympus Fluoview 500 confocal microscope, a home-built 3-line TIRF a Digital Instruments Bioscope scanning probe microscope and a Photometrics Evolve EMCCD (note that water-cooling is not shown in this image) (47).
As will be described later, it is important that the optical and SPM imaging axes be collinear to facilitate image registration between the two imaging modalities. While direct pixel-to-pixel mapping of the optical and SPM fields of view could be accomplished using a stage scanning strategy (19, 23, 51, 52), this is not a particularly convenient solution due to issues with imaging time, SPM feedback control, and the potential for photobleaching.
From an image and feature correlation perspective, features seen in the fluorescence images, especially if sequential imaging is performed, may not be seen in the SPM datasets. This is an important consideration especially if one is contemplating mapping structural rearrangements, such as membrane domain dynamics or aggregation by both topography (SPM), and fluorescence. Conversely, the SPM provides an ideal tool to resolve what structures give rise to a fluorescence signal within a diffraction-limited optical imaging frame, details which are not accessible using conventional optical means.
1.1 Total Internal Reflection Fluorescence Microscopy
Total internal reflection fluorescence microscopy (TIRFM) has been shown to be particularly useful for examining surface-specific phenomena, including cell adhesion, endo- and exo-cytosis (53–68). This technique is predicated on the following: When light passes from a material with a high refractive index, n 2, into a medium with a lower refractive index, n 1, the amount of light transmitted through and reflected by the interface is dependent on n 1, n 2, and the incident angle at the interface, θ i . At the critical angle, θ c, as defined by Snell’s law, total internal reflection occurs, resulting in the generation of an evanescent field that extends into the lower index medium.
(1)
Due to the exponentially decaying intensity, I(z), of the evanescent field, TIRFM is a powerful approach for characterizing phenomena and structures present within ∼200 nm of a surface.
(2)
Of the three conventional TIRFM platforms (prism-, objective-, and coupled waveguide), all of which use camera-based imaging (46), only the objective- and coupled waveguide approaches can be easily integrated with the SPM, with objective-based TIRF using high-numerical aperture objectives (NA > 1.35) being the most popular configuration (25, 69, 70). Exploiting the polarization angle of the incident light in TIR illumination is an innovative approach for examining the orientation of the fluorophore (and by extension the molecules) relative to the surface normal (71–74). This strategy has been used successfully to examine live cell membrane dynamics (74, 75), cell–cell interactions (76), molecular dynamics at surfaces (77, 78) and in supported lipid bilayers (79, 80), molecular motor dynamics in live cells (81–87), and changes in the local order of the membrane (71, 74, 88).
1.2 Coupling SPM and Optical Microscopy
The potential inherent in combining SPM with optical microscopy can been clearly seen in recent studies of various biological structures, interactions, and processes (19–23, 26, 28–31, 33, 36, 69, 70, 89–104). Confocal-SPM has been used to study the effect of local mechanical stimuli by the SPM tip on calcium wave initiation and propagation in live bone cells (105, 106), and the local mechanical properties of live cells (107, 108), while confocal-TIRFM-SPM has been used to study changes in cytoskeletal dynamics and local adhesion of live cells (109–113). Combined TIRFM-SPM is also ideal for single molecule mechanobiology studies, including investigations of forced unfolding (114) and photo-induced conformational changes (91). These latter examples clearly illustrate the potential of these correlative approaches for the field of mechanobiology (115, 116).
Correlated confocal-TIRFM-SPM imaging is well suited for characterizing molecular dynamics in membranes, protein–membrane interactions (26, 27, 35, 117) and structural changes in model phase-segregated membranes induced by ligand association (19, 20, 118–122). We have shown the power of coupled pTIRFM-SPM in our studies of the interactions of the model antimicrobial peptide indolicidin with supported lipid bilayers wherein we were able to clearly resolve peptide concentration- and lipid-dependent rearrangements (27), processes that appeared to be linked with peptide hydrophobicity. We have recently begun to explore the possibility of using pTIRFM in combination with SPM to examine differences or temporal changes in fluorescent membrane probe orientational order and their correlation with SPM topography (123, 124).
1.3 Correlated Confocal-SPM Imaging of Molecular Self-Assembly on Phase-Separated Membrane Bilayers (125)
To illustrate the potential of correlated confocal-SPM imaging, we examined the formation of J-aggregates of the small molecule chromophore, pseudoisocyanine (PIC), on supported planar lipid bilayers prepared on mica from either pure 1,2-distearoyl-sn-glycero-3-phospho-ethanolamine (DSPE), or a mixed gel-fluid-phase composition comprising 1,2-distearoyl-sn-glycero-3-phosphocholine (DSPC) and 1,2-dioleoyl-sn-glycero-3-phosphocholine (DOPC). PIC is known to self-assemble into a specific supramolecular architecture known as a J-aggregate, a motif that can be uniquely identified by a bathochromic shift in PIC emission relative to the monomer (126). However, questions remain regarding the critical dimension associated with the onset of J-aggregate behavior, which is thought to be due to exciton propagation and how the structure of the J-aggregate itself impacts this process.
As can be seen in Fig. 2, fusion of SUV suspensions of DSPC/DOPC and DSPE lipids to mica led to the formation of molecularly smooth islands, as determined by in situ SPM. To identify the gel- and fluid-phase domains in the mixed DSPC/DOPC bilayers, Rho-DHPE was used. This Rhodamine-B headgroup-labeled lipid preferentially segregates to the fluid-phase domains in the DSPC-DOPC domains. This was confirmed by correlated confocal-SPM imaging, which revealed that the Rho-DHPE labeled fluid-phase DOPC domains were ∼5 nm tall while the gel-phase DSPC domains extended ∼6.5 nm above the mica surface. The addition of a 100 μl aliquot of a 364 μM aqueous solution of PIC resulted in the formation of small aggregates on the surface of the lipid bilayers with preferential formation of the aggregates on the gel-state DSPC domains for the phase-separated DPSC/DOPC bilayers. This suggested a specific interaction between the PIC molecules and the charge and/or physical state of the gel-phase lipids. To assess whether the PIC molecules had indeed assembled into a specific motif, we then examined the simultaneously acquired confocal microscopy images. These images clearly illustrated that the aggregates were indeed fluorescent and, using hyperspectral imaging, also confirmed that they had in fact self-assembled into the proposed J-aggregate motif on the gel phase domains. Interestingly the same effect was also seen on the single component DSPE bilayer, again suggestive of a templating effect due to the charge and headgroup packing of the DSPE lipids. Close inspection and registration of the confocal and SPM data sets revealed the presence of irregularly shaped nonfluorescent PIC aggregates ∼20–100 nm tall and ∼50 nm in diameter on the lipid bilayers. These data present an interesting insight into J-aggregate self-assembly. Specifically, these data argue that these small nonfluorescent aggregates are not large enough to facilitate generation of the excitonic signal characteristic of a J-aggregate. Indeed, this suggests that correlated confocal-SPM imaging represents a particularly powerful means of addressing the critical stages of nucleation and growth of supramolecular structures and that mapping fluorescence against topography provides a unique strategy for tracking functional behavior, a characteristic that would be difficult to assess purely from topographical data provided by the SPM.
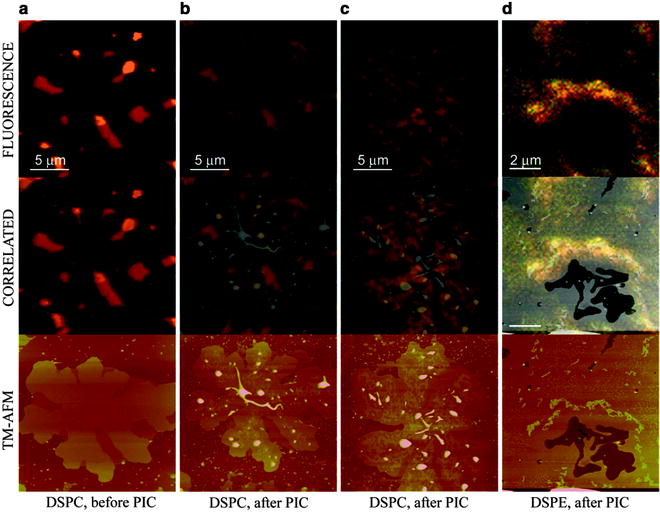
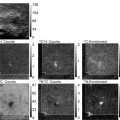
Fig. 2.
Combinatorial confocal fluorescence-SPM imaging of pseudoisocyanine (PIC) J-aggregate formation on supported lipid bilayers. (Top) Confocal; (Middle) Correlated confocal-SPM; (Bottom) in situ SPM images showing preferential growth of PIC J-aggregates on (a–c) DSPC gel-domain of a DSPC-DOPC-Rho-DHPE bilayer, before/after PIC addition. Scale bars: 5 μm; (d) DSPE bilayer after PIC addition. Scale bar: 2 μm.
Combinatorial microscopies based on the integration of scanning probe microscopy with the breadth of optical microscopy tools represent exceptionally powerful approaches for examining molecular phenomena in real-time and with nanometer-scale resolution. This integration is straightforward from a mechanical point of view and the potential of such systems is limited by the imagination of the user. While early adopters of these combinatorial platforms have been restricted in some respects by differences in the spatial and temporal resolution of the two techniques, recent advances in fast-scanning SPM and super-resolution optical imaging are helping to enhance the capabilities and potential of these tools.
2 Materials
For our specific confocal-TIRF-SPM platform, we use the following:
1.
HEPES buffer, pH 7.4.
2.
Ultra-pure Milli-Q water (Millipore).
4.
Inverted optical microscope (IX-70) equipped with 4×, 10×, 20×, and a 60× 1.45 NA PlanApo objectives (Olympus Canada).
5.
Olympus Fluoview 500 confocal microscope (Olympus Canada).
6.
Optical train for TIRF imaging, as described previously (47), including free-space launched 532, 473 and 405 nm diode-pumped solid-state (DPSS) lasers (Extreme Lasers, USA; Power Technology, USA), vibration isolation optical table (Newport Corporation, USA), optical stages, dichroic mirrors, visible wavelength Glan-Taylor linear polarizers prism, achromatic half-wave plates (Thorlabs, USA), Uniblitz mechanical shutters (Vincent Associates, USA), and motorized rotation mount and ESP motion controller (Newport Corporation, USA).
7.
Nanoscope IIIA scanning probe microscope system equipped with a Dimension scan head, phase extender and signal access modules, and a glass cantilever holder for fluid imaging (Digital Instruments Bioscope (now Bruker Nano), California).
8.
SPM tips: model DNP-S (for fluid imaging) (Bruker Nano, California).
10.
μ-Manager microscope automation software (http://www.micro-manager.org; http://valelab.ucsf.edu/∼MM/MMwiki/).
11.
Evolve 512 EMCCD camera equipped with a water-cooling system (Photometrics http://www.photometrics.com) (see Note 1).
12.
Willco glass bottom dishes: GWSt-5030 (Willco Wells, The Netherlands, http://www.willcowells.com).
13.
UV-curable optical adhesive: Norland #63 (NOA63, Cranbury, NJ).
14.
UV curing lamp: Bondwand (Edmund Scientific, New Jersey).
15.
All lipids were purchased from Avanti Polar Lipids (Alabaster, AL, USA) in either chloroform solution or in powder form: 1,2-distearoyl-sn-glycero-3-phosphocholine (DSPC), 1,2-dioleoyl-sn-glycero-3-phosphocholine (DOPC), 1,2-distearoyl-sn-glycero-3-phospho-ethanolamine (DSPE), and stored in chloroform at a stock concentration of 10 mg/ml. Lissamine-Rhodamine-B headgroup-labeled dihexadecyl phosphatidylethanolamine (Rho-DHPE) was purchased from Molecular Probes (Invitrogen) and stored in chloroform at a stock concentration of 1–10 mg/ml.
3 Methods
3.1 Mica-Glass Substrate Preparation Method for Confocal-TIRF-SPM Imaging
1.
Cleave a 1″ round piece of mica to expose a fresh surface, either with a razor blade or with adhesive tape. There should be no visible step edges on the surface of the mica.
2.
Place ∼1.5 μl of a UV-curable optical adhesive in the middle of a clean round 1″ glass coverslip or a 50 mm Willco-dish. Ensure there are no bubbles in the adhesive droplet.
3.
Carefully place the thin mica sheet on the glass surface with the adhesive drop. Press down lightly on the middle of the mica sheet with a gloved finger to help spread the adhesive. The adhesive drop should spread to a very thin layer between these two materials.
4.
Place the mica-glass substrate under a UV lamp (λ = 354 nm) for ∼15 min to permanently cure the adhesive.
5.
The substrate is now ready for liposome vesicle fusion to form a supported lipid bilayer (see Note 2).
3.2 Lipid Bilayer Preparation by Vesicle Fusion (See Note 3)
1.
Dissolve the desired molar ratio of lipids and fluorescent probe in chloroform in a clean glass test tube.
2.
Remove the chloroform by vacuum rotary evaporation to afford a dry film.
3.
Rehydrate the dry lipid film in 10 mM aqueous pH 7.4 HEPES buffer with ultra-pure Milli-Q water to a final liposome solution concentration of ∼1 mM.
4.
Small unilamellar vesicles (SUVs) are formed from the MLV suspension by sonicating the hydrated mixture for 20 min. The SUV suspensions can be stored at 4 °C for up to 2 weeks prior to use.
5.
To form a bilayer, 100 μL of the SUV suspension and 400 μL HEPES buffer are sequentially deposited onto a freshly cleaved mica surface in the confocal-TIRF-SPM sample chamber and left to stand for 3 min. Excess vesicles are removed from the sample by flushing the chamber ten times with 1 mL aliquots of HEPES buffer.
6.
External agents and their perturbing effects on membrane morphology and dynamics can be studied by direct injection of the agent dissolved in aqueous buffer during confocal-TIRF-SPM imaging.
3.3 Confocal-TIRF-SPM Imaging Protocol
The following instructions are specific to an older Digital Instruments Bioscope system equipped with a Dimension scan head mounted on an Olympus IX-70 base. The Olympus base is equipped with a custom-built multi-line laser-based TIRF illumination system and an Olympus Fluoview 500 confocal microscope. From the SPM perspective, we would note that each vendor has specific instructions for setting up their SPM systems. These instructions are also specific for performing SPM imaging in fluid.
1.
Mount a new cantilever into the SPM fluid cell and fit the fluid cell to the SPM scan head.
2.
Place the SPM scan head into its support frame on the inverted microscope. Ensure that there is sufficient clearance between the scan head and the microscope objective to prevent accidental contact between the two. At this point, it is usually easier to align the SPM- and optical axis of the microscope without the sample being present.
3.
With a low magnification (4× or 10×) air objective, focus on the tip and roughly align the SPM laser in air on the SPM tip. Using the SPM stage positioners, position the SPM so that the SPM tip is aligned with the center of the optical microscope’s field of view. If the optical microscope is equipped with a photoframe reticule, try to center the SPM tip in the reticule. If your microscope is so equipped, re-center the SPM tip using higher magnification objectives. If necessary, you may have to lower the SPM scan head so that it is in the focal plane of the objective.
4.
For TIRF imaging, rotate the TIRF objective into place on the optical microscope nosepiece (see Note 4). Re-center the SPM tip in TIRF objective’s field of view. This centering should be performed in air and in the absence of immersion oil. For epifluorescence or confocal imaging, the same procedure can be used (see Note 5).
5.
Align the SPM laser on the SPM tip and center the reflected laser spot on the SPM’s photodetector. Note that this is done in air and it will be necessary to realign the laser once the SPM tip is immersed in fluid (see Note 6).
6.
Raise the SPM scan head so that there is enough space between the scan head and the objective to insert the sample.
7.
Place a drop of immersion oil on the top lens of the imaging objective.
8.
Secure the sample chamber to the microscope stage and focus on the substrate–solution interface using brightfield illumination. Surface defects or calibration spheres adsorbed onto the sample surface may facilitate this step. Do not focus on the SPM tip.
9.
Configure the optical system for TIRF illumination, including the angle of incidence of the laser beam. This process will depend on the specifics of the TIRF platform.
10.
Translate the sample to the region of interest using the optical microscope stage controls. Since the SPM stage is centered on the microscope sample stage, via step 3, the SPM tip should remain centered on the optical field of view.
11.
Gradually lower the SPM tip towards the sample surface using the SPM scan head approach motor drive until the SPM tip is almost in focus. Since the optical microscope is focused on the sample surface, this procedure effectively brings the tip into the focal plane of the microscope. Realign the SPM laser as necessary.
12.
The sample is now ready to be imaged by simultaneous or sequential confocal-TIRF-SPM microscopy. Periodic realignment of the SPM laser and/or refocusing the objective may be necessary to compensate for thermal and/or mechanical drift during extended-duration imaging. Care must be exercised to avoid crashing the sample into the SPM tip during refocusing and withdrawing the SPM tip prior to manual refocusing may be helpful. Commercial autofocus systems may be employed for extended-duration imaging although care must be exercised to ensure physical compatibility with the specific microscope frame and objectives.
3.4 Image Collection and Analysis
Image collection can be performed using the manufacturers’ SPM and optical imaging software. Since the field of the view of the SPM is significantly smaller than that of the optical microscope, it is important to identify specific fiduciary markers that can be clearly identified in both imaging modes. In the context of membrane bilayers, these may be open membrane-free areas that provide both topographical contrast (a “hole”) and lack fluorescent contrast. Fluorescent calibration spheres are also useful.
3.4.1 Scanning Probe Microscopy
Typical imaging parameters for the SPM Digital Instruments Bioscope scanning probe microscope using a Nanoscope IIIA controller, a dual-range Dimension scanner having a maximum lateral scan area of ∼90 μm × 90 μm, using 120 μm long oxide-sharpened silicon nitride V-shaped cantilevers (type DNP-S, Veeco) using the Nanoscope 5.31 software:
1.
512 × 512 pixel images at scan rates of between ∼1 and 2 Hz using a tip oscillation frequency of ∼8.5 kHz.
2.
The tip oscillation frequency is cantilever-dependent and should be selected based on the manufacturer’s protocol, which typically involves obtaining a power spectrum as a function of frequency and voltage, and identifying an appropriate drive frequency and amplitude. This should be determined once the tip is close to the sample surface and immersed in fluid.
3.
All the raw SPM data files should be separated, and then subjected to appropriate flatten and plane-fit filters, as necessary.
3.4.2 Epi-Fluorescence and TIRF Microscopy
On our platform, all epi-fluorescence and TIRF-images are acquired using the open-source microscope automation software μManager (127) using a water-cooled Evolve 512 EMCCD camera (512 × 512 pixels, pixel size: 16 μm × 16 μm) (see Note 7).
3.4.3 Image Analysis
1.
Postacquisition image analysis is performed using the Nanoscope software (SPM) or the open-source package public domain software ImageJ (128).
2.
 Introduction: Nanoimaging Techniques in Biology
 Two-Color STED Imaging of Synapses in Living Brain Slices
 Secondary Ion Mass Spectrometry Imaging of Biological Membranes at High Spatial Resolution
 High Data Output Method for 3-D Correlative Light-Electron Microscopy Using Ultrathin Cryosections
 Functional AFM Imaging of Cellular Membranes Using Functionalized Tips
 Nanoimaging Cells Using Soft X-Ray Tomography


Determining the fluorescence and SPM image overlap can be performed using registration plug-ins in ImageJ or other commercial image processing packages. The quality of the registration is highly dependent on the presence of fiducial points present in both the optical and SPM images. This can be facilitated by the use of calibration microspheres.
Related posts:
Introduction: Nanoimaging Techniques in Biology
Two-Color STED Imaging of Synapses in Living Brain Slices
Secondary Ion Mass Spectrometry Imaging of Biological Membranes at High Spatial Resolution
High Data Output Method for 3-D Correlative Light-Electron Microscopy Using Ultrathin Cryosections
Functional AFM Imaging of Cellular Membranes Using Functionalized Tips
Nanoimaging Cells Using Soft X-Ray Tomography
Stay updated, free articles. Join our Telegram channel
Full access? Get Clinical Tree
