Thoracic Ultrasonography
Until recently ultrasonography of the lungs did not gain widespread acceptance, since its usefulness was questioned given the fact that ultrasound cannot transmit through air-filled spaces or penetrate bony structures. Dr. Lichtenstein and other authors, however, showed that simply evaluating pleural structures and ultrasound artifacts generated at the soft tissue-air interface of the chest wall and pleura may provide important diagnostic information to the clinician. A growing number of scientific papers describe the value of imaging the lung with ultrasonography instead of the conventional studies such as chest x-ray or the thoracic CT scan,1,2 thus avoiding unnecessary exposure to ionizing radiation. Lung ultrasonography is easily performed at the bedside and given the lack of negative effects on the patient, it may be repeatedly used to monitor therapeutic progress in patients with lung pathology.3
Normal lung pattern on ultrasonography
Each intercostal space is visualized by first illustrating the upper and the lower ribs along a longitudinal plane. The proximal rib surface is identified as a bright white (hyperechoic) convex line followed by a clean, black acoustic shadow (Figure 10-1). In between the ribs, the pleura is identified as a hyperechoic line approximately 0.5 to 1 cm deep to the rib surface. During the respiratory cycle a to-and-fro movement of the visceral pleura against the parietal pleura on the chest wall can be seen in the real time or B-mode, and is referred to as the “lung sliding” sign. This finding can only be seen if both pleural sheaths are in direct contact, and thus effectively excludes a pneumothorax at that level.4 If the examiner is unsure about the presence of lung sliding, the time motion mode (M-mode) can be used. With the cursor placed over the pleural line, the “Seashore sign” (Figure 10-2) should become apparent.4 The resulting picture consists of continuous hyperechoic horizontal lines above the pleura representing the static chest wall, followed by a granulous pattern below the pleural line. This “sandy” pattern is created by the moving lung tissue during respiration. The significant difference in tissue densities between the pleura and the air-filled lung tissue creates a reverberation artifact, producing repetitive horizontal hyperechoic lines, called “A-lines,” originating from the pleural line, depicted distal to the pleura at equally spaced intervals (Figure 10-3). A normal lung pattern on ultrasonography, therefore, appears as horizontal A-lines together with lung sliding, also referred to as the A-profile.5
Figure 10-1. (A) Typical view of the intercostal space in the longitudinal plane using a linear array probe. The proximal rib surface (small arrows) is well seen with the following acoustic shadow (R). The pleural line (large arrows) is 0.5 to 1 cm deeper than the rib surface; (B) same view using a phased array probe. The rib surface is not well seen, but the pleural line is (large arrows).
Figure 10-2. Sea-shore sign: To confirm lung sliding, the M-mode cursor is placed across the pleural line and the A-lines. The resulting image shows the so-called “sea shore sign”, describing continuous horizontal lines above (sea) and a granulous pattern below (shore) the pleural line (P).
Figure 10-3. A-lines: A reverberation artifact originating from the strong reflection of ultrasound beams at the pleural-lung interface causes the depiction of multiple hyperechoic lines (arrows) at identical distance from each other underneath the pleural line (red arrow). R = rib.
Technique and equipment
Lung or thoracic ultrasonography can be performed with any modern medical ultrasound device supplied with a linear, phased array or curved linear array probe. Which probe should be used depends mainly on the patient’s body habitus. A linear array probe is characterized by high resolution and poor penetration (max 9 cm) into tissue; thus, it is very useful for lean patients where superficial structures are of interest (eg, the pleura and chest wall). In contrast, a phased array probe has a poorer resolution but a better penetration into tissues (up to 25 cm) and is typically used for transthoracic echocardiography given its small footprint. This probe is useful if deeper structures need to be investigated such as consolidations and large pleural effusions. The curved linear array probe is a combination of both aforementioned probes, with a somewhat better resolution than the phased array and a better penetration than the linear array probe. It is characterized by a large footprint and is mostly used for abdominal ultrasonography. Since lung ultrasonography is typically performed as part of a general ultrasound examination including echocardiography, we recommend to start with one probe that fits all—the phased array probe—and change the probe once the findings warrant a more detailed analysis.
Three different sonographic modes are used in lung ultra-sonography: the real-time B-mode, the time motion mode (M-mode), and the color Doppler mode. For a more detailed description please refer to other chapters in this book.
In order to improve inter-interpreter variability and reproducibility of the ultrasound findings, each hemithorax is divided into three zones: the anterior zone, reaching from the sternal line to the anterior axillary line; the lateral zone, reaching from the anterior axillary line to the posterior axillary line; and the posterior zone, reaching from the posterior axillary line to the spine. Each zone is divided into a superior and an inferior area (Figure 10-4).
Figure 10-4. Lung zones: Each hemithorax is divided into three zones: anterior (A), lateral (L), and posterior (P). Each zone is divided into a superior (s) and an inferior (i) area.
An ultrasonic examination is performed with the patient in supine or semirecumbent position. Depending on the clinical scenario the patient may need to be turned into a lateral decubitus position to access the posterior chest wall. However, the scapula limits the accessibility significantly in most cases. Each examination begins with the identification of the diaphragm on the corresponding side to differentiate the intrathoracic from the intra-abdominal space. Subsequently each intercostal space is thoroughly examined. The ultrasound examination is performed along close longitudinal (caudal to cranial direction) and transverse lines starting at the posterolateral aspect of the thorax and moving toward the sternum. A comprehensive examination of both lungs typically takes approximately 15 minutes, although in skilled hands, it may be performed more quickly.
Common pathological findings on chest ultrasonography
As described above, normal lung tissue may not be seen on ultrasound, since air-filled spaces are poorly penetrated by ultrasound waves. Only if the lung injury or pathological changes extend to the periphery (pleura) can they be seen on ultrasound. Processes such as interstitial pulmonary edema, alveolar flooding and resulting lung consolidation, pneumothoraces, and pleural effusions are characterized by specific ultrasound findings or a combination of them.
Alveolar-interstitial syndrome
Alveolar-interstitial syndrome (AIS) is a nonspecific finding on ultrasound associated with conditions such as acute lung injury (ALI) and acute respiratory distress syndrome (ARDS), interstitial pneumonia, pulmonary edema, as well as chronic diseases such as pulmonary fibrosis. In both instances the interlobular septi are thickened and cause a reverberation artifact leading to the formation of so-called B-lines. B-lines (also known as “comet tails” or “lung rockets”) are ultrasound artifacts caused by the reflection of ultrasound beams within thickened interlobular septa just under the pleura and are seen as hyperechoic vertical lines arising from the pleural line.6 These lines span the entirety of the ultrasound image without fading, are well defined, efface A-lines, and move with the visceral pleura. They may be part of a normal lung picture if they occur occasionally, mostly in the dependent lung zones. Their significance changes as they become more numerous; typically more than three in one window.
Their morphological correlate changes depending on the distance between the B-lines at the pleural line. B-lines ≥7 mm apart (B7 lines) represent thickened interlobular septi on CT scan6 mostly caused by interstitial pulmonary edema of different etiologies. Comet tails, 3 mm or less apart (B3 lines), are typically caused by alveolar flooding or ground glass opacities on CT scan (Figure 10-5).
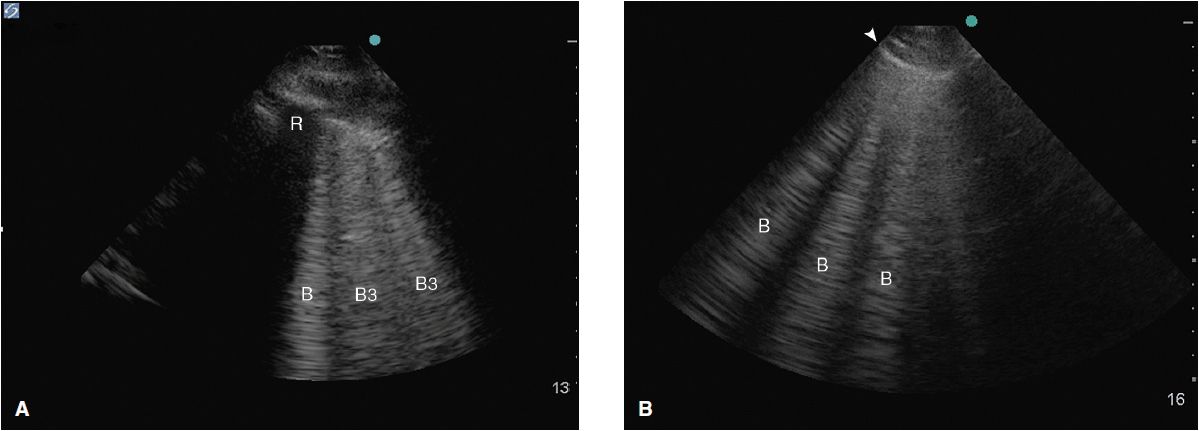
Figure 10-5. (A) B3 lines in a patient with alveolar interstitial syndrome. The B-lines are 3 or less mm apart at the pleural line and correlate to alveolar flooding or ground glass opacities on CT; (B) B-lines about 7 mm apart at the pleural line correlate to interstitial edema with thickened interlobular septi.
Assessing the presence and topographic distribution of the B-lines on the chest wall and taking into account clinical findings may help the clinician to narrow the differential diagnosis quickly in patients with respiratory distress. While AIS is present in both ALI/ARDS and cardiogenic pulmonary edema (findings such as “spared areas” with a normal lung pattern), a heterogenic mixture of B3 and B7 lines together with lung consolidations and focal absence of lung sliding points strongly toward lung injury, whereas a ubiquitous homogenous spread of B7 lines without any of the aforementioned ultrasound findings makes a cardiac pulmonary edema more likely.7 A normal ultrasound pattern (no B-lines) in a patient with acute respiratory distress, on the other hand, would make a COPD exacerbation or a pulmonary embolus more likely than pulmonary edema of any cause.8,9
Lung ultrasonography may also assist in optimizing mechanical ventilator settings and monitoring treatment success. In patients with ALI/ARDS it may differentiate focal from disseminated disease and, therefore, help titrate positive end-expiratory pressure (PEEP) to avoid hyperinflation of the normal lung parenchyma (“baby lung”).10 The changes in lung aeration scores based on ultrasound findings correlate with changes found on chest CT scans after interventions such as pleural drainage or antimicrobial therapy for ventilator-associated pneumonia.11
Atelectasis and lung consolidation
Atelectasis (ATX) and lung consolidations are frequent findings in ventilated critically ill or postoperative patients and may be associated with significant morbidities such as induction of atelect-trauma and lung injury, if left untreated. Two forms of atelectasis are recognized: (a) passive ATX, produced by external compression, mostly due to a large pleural effusion or empyema; and (b) active or obstructive ATX, secondary to the resorption of oxygen. The ensuing lung collapse through loss of aeration leads to the consolidation of the lung tissue and thus allows ultrasound to travel through it and create a picture. A lung consolidation caused by compressive ATX is shown as hypoechoic (shades of dark gray) tissue floating in a large pleural effusion (“waving hand”).12 In obstructive ATX, additional interspersed hyperechoic spots, representing air bronchograms, are present (Figure 10-6) and the accompanying effusion tends to be smaller. Pneumonia also presents as a lung consolidation of different size and location, but is associated with dynamic air bronchograms describing a reinforcement of the hyperechoic spots during inspiration.3 In contrast, this reinforcement of the air bronchograms does not take place in complete ATX, since there is no air flow per se.13 In complete obstruction of a lung segment, eg, after mainstem intubation, the so-called “lung pulse” is seen early on. In this case lung sliding is abolished and a pulsating movement of the pleura is detected, generated by the transmission of cardiac pulsations through the lung tissue.14 This sign is best assessed using the time motion mode. The lung pulse is seen as intermittent vertical lines of granular pattern interrupting the straight horizontal lines underneath the pleural line in synchrony with cardiac contractions on the EKG tracing on the monitor. The clinical value lies in its ability to detect nonventilated lung areas early on, long before the collapse and consolidation of the lung segment occurs. This may be of particular interest in patients with marginal respiratory function, since already consolidated lung areas are much less likely to be re-recruited.10
Figure 10-6. Consolidated left lung within a large pleural effusion. The lung segment is hypoechoic, resembling the liver on ultrasound (“hepatization of the lung”). The hyperechoic spots within the atelectatic lung (white arrows) correspond to “air bronchograms,” caused by microbubbles of air trapped in mucous inside the airways. PE = pleural effusion; S = spine.
Pleural effusion
To assess a pleural effusion sonographically, it is useful to identify the diaphragm first, since the fluid accumulates in the dependent areas, and to differentiate intra-abdominal from intrathoracic fluid (Figure 10-7). Fluid is typically anechoic and thus a pleural effusion will present itself as a black (anechoic) band surrounded by the visceral pleura, the diaphragm, and the parietal pleura during in-and expiration. Since fluid facilitates the propagation of ultrasound, deeper thoracic structures may well be seen. If the lung is still aerated, the visceral pleura is seen as a hyperechoic line followed by the previously described artifacts. If the pleural effusion is large and compressive, floating lung consolidations are seen. Vascular structures such as the descending thoracic aorta may be identified on the left side. Distinction of well-perfused and thus almost anechoic organs or structures may be difficult. Applying color Doppler may help by identifying vessels within the organs such as the spleen or liver. To differentiate a small loculated effusion from edematous and thickened pleura, the “color fluid” sign may help. A positive sign elicits color Doppler signals within the space in question, caused by phasic respiratory movements within the pleural fluid. In addition, the sinusoid sign on M-mode shows the movement of the lung tissue toward the periphery during inspiration (Figure 10-8), confirming the presence of fluid. Although the sonographic characteristics cannot differentiate between transudate and exudate, they may guide further diagnostic workup. Depending on the echogenicity of the pleural fluid, a pleural effusion may be described as anechoic, complex nonseptated, complex septated, and homogenously echogenic. The fluid is anechoic if no echo-genic materials are found within the effusion, complex nonseptated if some echogenic material is floating within the effusion, complex septated if fibrin strands connect to the visceral and parietal pleura, and homogenously echo-genic if echogenic particles are equally distributed within the pleural space.15 In a study evaluating 320 patients with pleural effusions, findings of complex nonseptated, complex septated, and homogenously echogenic pleural fluid always defined an exudate, whereas anechoic fluid could be an exudate or a transudate.15 Homogenously echogenic pleural effusions are typically caused by an hemorrhagic effusion or an empyema (Figure 10-9).
Figure 10-7. Identification of the diaphragm: Before assessing the pleural effusion, the diaphragm needs to be identified. In this picture, the diaphragm (arrows) clearly separates the intra-abdominal space with the spleen (S) to form the intrathoracic space with a pleural effusion (PE). Sp = Spine; K = Kidney.
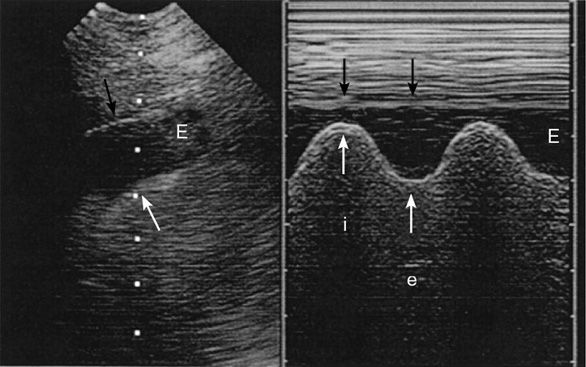
Figure 10-8. Sinusoid sign: the picture on the left shows an anechoic band (E) representing a pleural effusion with the visceral pleura underneath (white arrow) and the parietal pleura above (black arrow). The picture on the right shows the “sinusoid sign,” a sign specific for a liquid-filled pleural space, caused by an inspiratory narrowing of the pleural effusion (i) and expiratory widening (e). (With permission: Lichtenstein DA. Ultrasound in the management of thoracic disease. Crit Care Med. 2007 May;35(Suppl):S250–S261.)
Figure 10-9. Empyema: In this longitudinal view of the right hemithorax, pleural fluid is surrounding the collapsed lung areas (L); however, the fluid is not anechoic but homogenously hypoechoic with floating particles (E). This picture was taken of a 55-year-old gentleman with persistent fevers despite adequate antibiotic treatment.
Ultrasound may also be used for the quantification of the pleural fluid. Two methods have been described achieving good estimates of the actually drained pleural effusion volume and/or estimated volume on CT scan. In 58 postcardiac surgery patients with signs of pleural effusion on chest x-ray (CXR), the prepuncture pleural volume was estimated using the formula Vpre = (15.06 × D [mm]) + 21.45, where D is the distance measured via ultrasound between the midheight of the diaphragm and the visceral pleura at end-expiration in a sitting patient. Only patients with >30 mm distance were tapped and evaluated; a strong correlation between tapped and estimated volume was observed with a correlation coefficient r = 0.89, P <0.001.6 However, most of the methods using the maximal effusion depth have a poor correlation with smaller effusions. Using the cross-sectional area (cm2) of the pleural effusion (PE) instead, a significantly better correlation was reached between the measured PE volume (PEV) on CT and the measured volume on ultrasound. The measurements were taken in supine patients along the posterior axillary line in a transverse plane. The PEV on ultrasound was measured using the formula: PEV = Aus × Lus, Aus referring to the cross-sectional area of the PE at the midlevel between the apical and caudal limits of the PE spread, and Lus standing for the maximal length of the PE in craniocaudal direction. With this method, small, moderate, and large PEs could be accurately predicted compared to CT, with a correlation coefficient of 0.96 and P <0.001.17
CXRs as well as physical examination have a poor accuracy in predicting the extent of the effusion and determining a safe puncture site for thoracocentesis. Lung ultrasound, on the other hand, has several advantages, and since it may be rapidly performed at the bedside, it allows accurate estimates of the extent and finding of a safe puncture site, avoiding procedure-related complications such as a pneumothorax. Even though thoracocentesis is considered safe, accidental pneumothoraces occur in up to 30% of clinically guided attempts.18 Using ultrasound guidance for thoracocentesis led to a 10% reduction in accidental organ puncture and avoided puncture at an inappropriate site in 15% of patients.19 Moreover, in 58% of clinically attempted “dry taps,” subsequent ultrasound examination showed the puncture site to be below the diaphragm.20
There are two ways of using ultrasound for thoracocentesis. Most intensivists do not use real-time ultrasonography for the tapping of a pleural effusion, but rather mark the best puncture site on the patient’s skin and then insert the needle afterward. Since the patient may change his/her position or the mark may fade, the puncture should follow immediately after the site has been marked. In fact, significant delay eliminates the benefit of using ultrasound to avoid a pneumothorax compared to the conventional approach. The other option is to perform the tap under real-time ultrasonography, allowing for control of the needle tip throughout the procedure. The skill set required for this approach is somewhat more advanced, but easily achieved even without formal training.21 The patient may be brought into the sitting position or the supine position with a slight head elevation to tap the effusions.
Pneumothorax
A pneumothorax (PTX) may be caused by trauma, ARDS, mechanical ventilation, severe pneumonia, and procedures such as placing a central line or performing a thoracentesis.22 The sensitivity of AP CXRs to detect a PTX varies from 25% to 60% and is often associated with a significant delay until the diagnosis is established. The gold standard for diagnosing PTX is the CT scan, yet increased transportation risk and exposure to ionizing radiation are limiting factors, especially if repetitive evaluation is necessary. Detecting a pneumothorax on transthoracic ultrasound is much quicker and more sensitive than using a CXR, especially in the emergency setting.23,24 By definition a PTX causes the visceral pleura to separate from the parietal pleura, thereby effectively abolishing the lung sliding seen on ultrasonography. On M-mode the granular pattern below the pleural line is replaced by straight horizontal lines, creating the so-called “barcode sign” (Figure 10-10Ab). In addition, A-lines should be seen without any occasional B-lines or other pleural artifacts (“A-line” sign in PTX). However, absent lung sliding may also be caused by large bullae, severe COPD and overdistention, mainstem intubation, pleural adherences, or a chest tube. A sign of partial pneumothorax is the so-called “lung point” where the normal lung pattern (lung sliding and A-lines) intermittently changes into a pattern of a pneumothorax (absent lung sliding with A-lines) (Figure 10-10). This finding has a 79% sensitivity and a 100% specificity.25 Tracking the lung points in the different intercostal spaces may help delineate the size of the partial PTX. For this purpose the patient should be supine during the examination. The major advantage in the diagnosis of PTX by ultrasonography lies in its high negative predictive value. The presence of lung sliding, B-lines, or the lung pulse effectively excludes a PTX. To improve the positive predictive value of the absence of lung sliding during procedures with a high risk of PTX, it is crucial to perform the examination before and after the intervention. If lung sliding is present before the procedure and is absent afterward, the likelihood of PTX is very high.
Figure 10-10. The “lung point” sign: on the left a normal lung pattern (Aa) is shown in the M-mode function, the seashore sign as described above. In case of a partial pneumothorax the seashore sign intermittently changes with the “barcode” sign (Ab) in the area where the pneumothorax borders with the still expanded lung. The “barcode sign” develops as the lung drops below the scanning plane (Bb) during expiration and describes continuous horizontal lines above and below the pleura. (Ultrasound picture with permission from Bouhemad B, Zhang M, Lu Q, Rouby J-J. Clinical review: bedside lung ultrasound in critical care practice. Crit Care. 2007;11(1):205.)
Pulmonary embolism
Recent evidence suggests that thoracic ultrasound may be useful to evaluate the possibility of pulmonary embolism (PE) in the critically ill. Even though ultrasound can only evaluate the lung periphery and certainly not the central pulmonary vessels, about 80% of the patients with a central embolus also have evidence of smaller peripheral emboli,26 resulting in small pulmonary hemorrhages. In fact up to 66% of the peripheral lesions occur in the lower lobes of the lung,27 potentially allowing their detection on thoracic ultrasound. To optimize access to the lower thorax the patient should be sitting at the bedside with both hands behind his/her head to open up the intercostal spaces. The sonomorphology of a PE lesion has characteristic features: hypoechoic, pleural based, wedge-shaped (85%), or round-shaped (11%) lesions with the majority located in an area of pleuritic chest pain.28 These lesions have to be differentiated from lesions associated with bronchial cancer, lung metastases, and pneumonic infiltrate. A pneumonic lesion typically has an irregular border, is inhomogeneous, and is well perfused on color-Doppler imaging. Thus, it is easily differentiated from a PE-related lesion. Occasionally an air bronchogram may be found inside the lesion. In case of neoplastic disease, the lesion may either have an irregular or polycyclic shape with diffuse borders in case of bronchogenic carcinoma or have a sharp border and a round/oval shape in case of lung metastases (which may therefore be confused with PE lesions). Invasive growth into adjacent tissues such as the parietal pleura or chest wall may give further clues to a neoplastic mass. Accepting either two or more typical wedge-shaped or rounded subpleural lesions or one typical lesion with a corresponding small pleural effusion as sonographic criteria for PE in patients with confirmed PE on CT pulmonary angiography resulted in a 74% sensitivity and 95% specificity of transthoracic ultrasound for diagnosing PE.27 Since only roughly two-thirds of the thorax can be evaluated by ultrasound (due to the ribs and scapula preventing the depiction of the lung), and the fact that peripheral pulmonary hemorrhages may be reabsorbed within a few hours or days, a negative finding on ultrasound does not rule out a PE.27,28 In acutely dyspneic patients, however, the finding of a normal lung profile (A-lines and lung sliding) over both hemithoraces and a deep vein thrombosis on duplex sonography of the femoral veins yielded a positive predictive value of 94%, a sensitivity of 81%, and a specificity of 99% for the diagnosis of PE.5 This implies that lung ultrasound should be performed together with the duplex sonography of the lower extremity veins if a PE is suspected. This approach should be used in patients with respiratory distress but hemodynamic stability. If the patient is in shock, though, an echo-cardiography should be done first, looking for signs of acute right ventricular failure and, if present, thrombolysis or embolectomy may be initiated on these findings alone (see focused echocardiography section).
 Focused Transthoracic Echocardiography
Indications
Every critically ill patient who is hemodynamically unstable may benefit from a focused transthoracic echo-cardiography (FTTE) by the intensivist, especially after the first measures of resuscitation prove to be ineffective. FTTE may be used to obtain a momentary status of the cardiovascular performance or may be used to monitor treatment efficacy. Hüttemann et al showed in a meta-analysis of medical and surgical critical care patients that in case of acute hypotension, echocardiography resulted in a management change in 36% of patients, and led to a surgical intervention in 14% of cases.29 Used as a monitoring tool, TEE detected severe previously unknown heart dysfunction in 8% of newly admitted intensive care patients.
Technique and normal anatomy
The heart is visualized through acoustic windows in the anterior chest wall that allow for a clear view of the heart with minimal interference from lung tissue or bony structures. The sites on the thorax and the related pictures from the heart have been standardized. There are three main access sites (Figure 10-11).
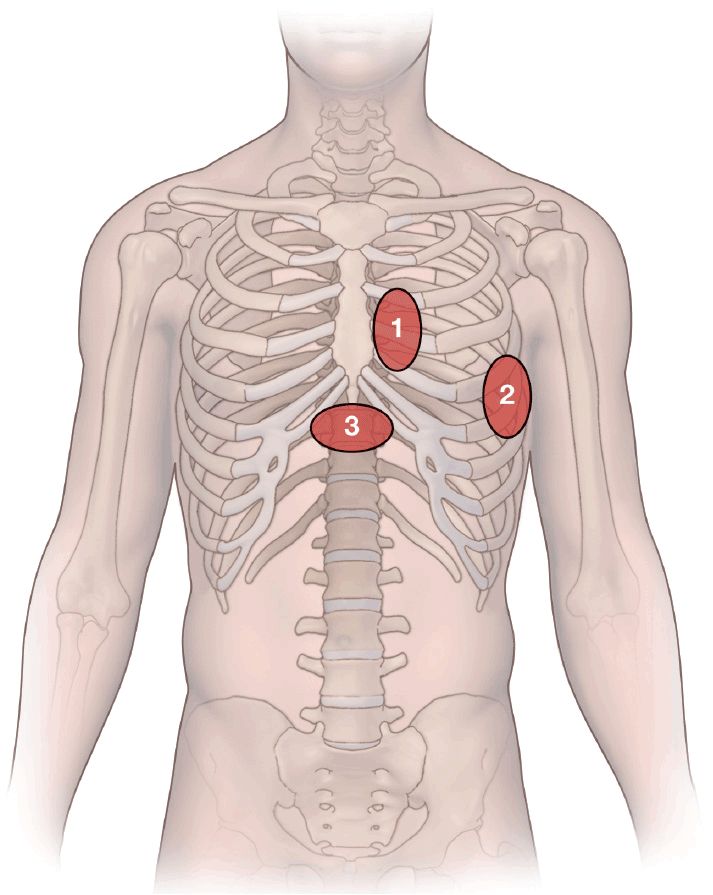
Figure 10-11. Transducer positions on the chest wall: 1. Parasternal area: two views may be taken from here: the parasternal long-axis view and the parasternal short-axis view; 2. apical area: the apical four-chamber view is taken here; 3. subcostal area: subcostal four-chamber view.
Related posts:

Stay updated, free articles. Join our Telegram channel

Full access? Get Clinical Tree


