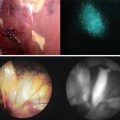
Fig. 5.1
Flowchart of the study procedures regarding the clinical experiments described in this chapter. With permission from: Schols RM, Bouvy ND, van Dam RM, Masclee AA, Dejong CH, Stassen LP; Combined vascular and biliary fluorescence imaging in laparoscopic cholecystectomy. Surgical Endoscopy 2013;27(12), page 4514 © in 2013 Springer Science and Business Media, New York [2]
Intraoperatively a researcher systematically registered whether the localization of the common bile duct, cystic duct, and cystic artery could be identified at set time points, comparing the WL-camera mode to NIRF-mode. For agreement on the identification of the aforementioned structures, the attending surgeon was consulted. A structure was scored as “identified” if its localization was confirmed with great certainty by the experienced surgeon. In case of the common bile duct this does explicitly not mean that it was surgically exposed, as this is contradictory to the CVS-technique.
During all laparoscopic cholecystectomies, the full surgical procedure was recorded on DVD. After completion of surgery, length of time between the “introduction of the laparoscope” until “the first recognition of the following components” was calculated, based on the intraoperative registration: common bile duct (CBD), cystic duct (CD), cystic artery (CA), and Critical View of Safety (CVS). Using conventional imaging the CBD is regularly not displayed; this is partly a result of the CVS technique.
Quantitative Analysis of Fluorescence Images
For objective assessment of the degree of fluorescence illumination in the extra-hepatic bile ducts and artery, OsiriX 5.5.1 Imaging Software was used. The fluorescence images were analyzed by determining target-to-background ratio (TBR). TBR was defined as the mean fluorescence intensity (FI) of two point regions of interest (ROIs) in the target (i.e. CBD, CD or CA) minus the mean fluorescence intensity of two background (BG) ROIs in the liver hilum, divided by the mean fluorescence intensity of the two background ROIs in the liver hilum; in formula: TBR = (FI of target − FI of BG)/FI of BG.
Statistical Analysis
Regarding the primary endpoint (i.e. moment of clear visualization of the extra-hepatic bile duct anatomy), a paired T-test was applied for determination of possible significant differences between the time measurements from “introduction of laparoscope” until “identification of CD/CBD”; comparing fluorescence imaging with conventional imaging.
Results
Thirty patients, undergoing an elective laparoscopic cholecystectomy, were included in this study [1, 2]. Patient characteristics are summarized in Table 5.1.
Table 5.1
Patient characteristics
No. of patients | 30 |
Gender | 11 male |
19 female | |
Age (y) | 53 (26–81) |
Body Mass Index (kg/m2) | 26.7 (19.7–36.8) |
Indication for surgery | 20 cholecystolithiasis |
8 cholecystitis | |
2 cholecystectomy after biliary pancreatitis | |
ICG administration | 2.5 mg directly after induction of anesthesia (n = 30) |
2.5 mg at establishment of CVS (n = 15) |
The median time interval from ICG injection until first fluorescence laparoscopic recordings with the D-Light P System was 34 (19–67) min. Time until first fluorescence visualization depended mainly on whether adhesiolysis had to be conducted before initial exposure of the liver hilum could be obtained. After start of surgery, the common bile duct could be identified significantly earlier using NIRF mode compared with WL-mode (median 23 min and 33 min respectively; p–value < 0.001). Using fluorescence laparoscopy the cystic duct was delineated after an average of 25 min, whereas using WL-mode this took on average of 36 min (p–value < 0.001). Intraoperative observations are summarized in Table 5.2.
Table 5.2
Intraoperative observations
Clear identification of… | Fluorescence cholangiography (n = 30) | Fluorescence angiography (n = 15) | ||||
|---|---|---|---|---|---|---|
Cystic duct | Common bile duct | Cystic artery | ||||
NIRF | WL | NIRF | WL | NIRF | WL | |
Patients | 29/30 (97 %) | 29/30 (97 %) | 25/30 (83 %) | 22/30 (73 %) | 13/15a (87 %) | 13/15a (87 %) |
Median time in minutes [range] | 25 [5–49] | 36 [9–69] | 23 [5–65] | 33 [9–65] | ||
p < 0.001* | p < 0.001* | |||||
Using fluorescence cholangiography, the CBD and the CD could be clearly visualized and delineated before dissection of Calot’s triangle respectively in 25/30 patients (83 %) and 29/30 patients (97 %). In four of five cases (17 %), in which the CBD could not be visualized using fluorescence imaging, a chronic inflammation of the gallbladder was present. One patient appeared to have a chronic, focally active cholecystitis. BMI of these patients ranged from 26.35 to 31.14 kg/m2. However, in the 25 patients in whom the CBD could be delineated before dissection, there were also cases of chronic inflamed gallbladders and BMIs within the same range as these 5 patients.
Conventional laparoscopy provided certainty on the course of the CBD and the CD in respectively 22/30 patients and 29/30 patients. See Figs. 5.2, 5.3 and 5.4 for an example of the peroperative WL-images and corresponding NIRF-images during the dissection of CVS. A short video fragment illustrating the application of near-infrared fluorescence cholangiography during one of the surgical procedures is included as online supplement (see Video 5.1).
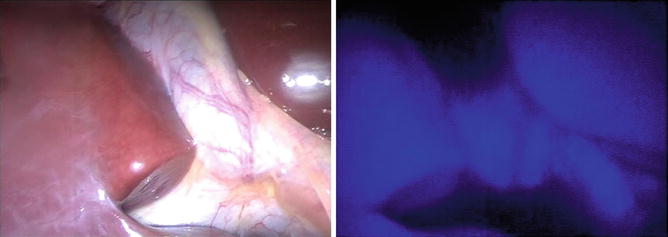
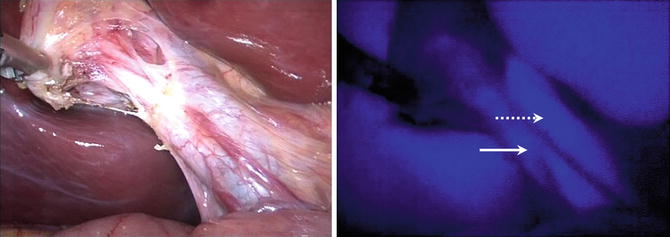
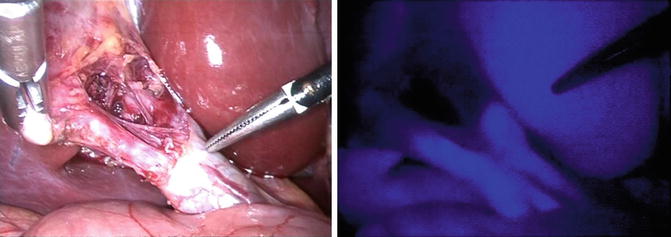

Fig. 5.2
WL image (left) and corresponding fluorescence image (right) at first view of the liver hilum; images were recorded directly after initial exposure of the liver hilum. The liver and extra-hepatic bile ducts are illuminated bright blue. With permission from Schols RM, Bouvy ND, Masclee AA, van Dam RM, Dejong CH, Stassen LP. Fluorescence cholangiography during laparoscopic cholecystectomy: a feasibility study on early biliary tract delineation. Surgical Endoscopy 2013;27(5):1534 © in 2013 Springer Science and Business Media, New York [1]

Fig. 5.3
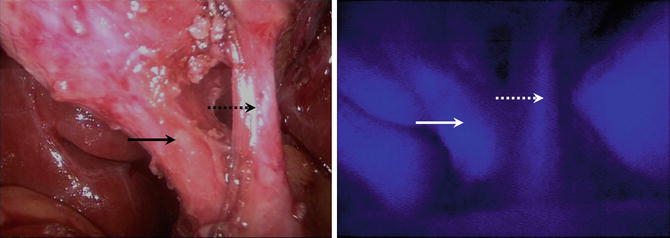
WL image (left) and corresponding fluorescence image (right) during dissection of Calot’s triangle; note the parallel junction between the cystic duct (continuous arrow) and the common hepatic duct (interrupted arrow) in the fluorescence image. The liver remains illuminated as well. TBR of CD was 3.6 and TBR of CBD was 3.9 (28 min after ICG injection). With permission from Schols RM, Bouvy ND, Masclee AA, van Dam RM, Dejong CH, Stassen LP. Fluorescence cholangiography during laparoscopic cholecystectomy: a feasibility study on early biliary tract delineation. Surgical Endoscopy 2013;27(5):1534 © in 2013 Springer Science and Business Media, New York [1]

Fig. 5.4
WL image (left) and corresponding fluorescence image (right) in a later stage of dissection of Calot’s triangle; the fluorescence image confirms the divergent course of the two separate bile ducts as already identified in an earlier stage (see Fig. 5.2). The liver remains illuminated. TBR of CD of 7.9 and TBR of CBD of 6.3 (36 min post-ICG injection). With permission from Schols RM, Bouvy ND, Masclee AA, van Dam RM, Dejong CH, Stassen LP. Fluorescence cholangiography during laparoscopic cholecystectomy: a feasibility study on early biliary tract delineation. Surgical Endoscopy 2013;27(5):1534 © in 2013 Springer Science and Business Media, New York [1]
In one patient a parallel course [14] of the cystic duct and common hepatic duct was identified (see Fig. 5.3).
In one patient conversion to open cholecystectomy followed, due to insufficient sight on the liver hilum after an early perforation of a very thin-walled gallbladder, causing persistent nuisance due to bile leakage.
Critical view of safety was obtained in a median of 45 min after incision. Concomitant fluorescence angiography of the cystic artery (see Fig. 5.5 and Video 5.2) was successful in 13 of 15 patients (87 %). In two patients, the cystic artery was already ligated in an earlier stage of dissection.
