Abstract
Objective
To test and evaluate a sofware dedicated to the follow-up of oncological CT scans for potential use in the Radiology department.
Materials and methods
In this retrospective study, 37 oncological patients with baseline and follow-up CT scans were reinterpreted using a dedicated software. Baseline CT scans were chosen from the imaging reports available in our PACS (picture archiving and communicatin systems). Follow-up interpretations were independently assessed with the software. We evaluated the target lesion sums and the tumor response based on RECIST 1.1 (Response Evaluation Criteria in Solid Tumors).
Results
There was no significant difference in the target lesion sums and the tumor response assessments between the PACS data and the imaging software. There was no over or underestimation of the disease with the software. There was a sigificant deviation (progression versus stability) in three cases. For two patients, this difference was related to the evaluation of the response of non-target lesions. The difference in the third patient was due to comparison with a previous CT scan than to the baseline exam. There was a miscalculation in 13 % of the reports and in 28 % of the cases the examination was compared to the previous CT scan. Finally, the tumor response was not detailed in 43 % of the follow-up reports.
Conclusion
The use of dedicated oncology monitoring software could help in reducing intepretation time and in limiting human errors.
1
Introduction
The advent of cross-sectional imaging in the 1970s made feasible the detection of early cancer and monitoring. The development of anticancer chemotherapies has rapidly reinforced the need for objective disease information to manage and treat these patients [ ].
The need to standardize criteria to evaluate the chemotherapy’s efficacy and to estimate the tumor response, triggered the international collaboration [ , ].
In 1981, the World Health Organization (WHO) published the first draft for the estimation of tumor burden over time based on morphological criteria. The draft integrated the concepts of the initial CT scan (baseline), measurable and non-measurable lesions and size thresholds, which allowed conclusions, respect to the evolution of the tumor [ ]. Considered imprecise, an International Working Group replaced these guidelines in 2000 by the Response Evaluation Criteria in Solid Tumors (RECIST) criteria. These updated guidelines provided the definition of target lesions (10 maximum in total, no more than five per organ) and non-target lesions and specifications on acquisition protocols [ ]. These criteria were again updated in 2009 (RECIST 1.1) by the RECIST Working Group, reducing the number of target lesions to a maximum of five with no more than two per organ as well as adding details on the measurement of lymph nodes and response criteria [ ].
Although RECIST tumor evaluation was validated and widely used, the criteria remained open to interpretation and raised many questions. Thus in 2016, the RECIST 1.1 committee published an update and clarification to address these concerns [ ]. Nevertheless, the updated criteria still have some limitations; the subjective choice of the target lesions entails high interobserver variability and may be the basis of the difference in tumor responses in up to one third of the cases [ ]. Tumor evaluation with RECIST criteria is also sensitive to intraobserver variability [ ]. The subjective assessment of the maximum diameter, sharpness or blurring of tumor boundaries, and the quality of acquisition and contrast injection it is also a source of variability [ ]. Finally, the RECIST 1.1 criteria are not suitable for monitoring certain pathologies (mesothelioma, hepatocellular carcinoma, bone metastases, etc.) or the evaluation of new local treatments (thermoablation, chemoembolization) and the increasingly used systemic treatments (targeted therapies, immunotherapies, etc) [ , ], which has resulted in the development of modified RECIST criteria, modelled for each situation.
Lesion measurements remain time-consuming as the radiologist’s workload continues to increase [ ]. The radiologist can now benefit from the help of trained medical electroimaging (MEM) technicians [ ] or from dedicated diagnostic assistance software progressively developed by manufacturers or start-ups. This save interpretation time [ ] and allows a reduction of interobserver variability [ ]. Additionally, these software programs are enriched by artificial intelligence [ ]. Since the RECIST criteria are used for a large proportion of oncology patients in our institution, we aim to assess the impact of a dedicated software on imaging interpretations.
2
Materials and methods
The institutional review board approved this retrospective study and waived informed consent to participate to the study due to its retrospective nature. This study includes a control group.
2.1
Patients reports
Filtered searches on our radiology information system (RIS) and picture archiving and communication system (PACS) enabled us to select 37 adult patients followed for metastatic solid tumors between April 2016 and May 2021. The selected patients had an initial CT exam (baseline) and at least two follow-up CTs. Baseline was defined as a CT exam performed within the 4 weeks before the first session of chemotherapy treatment.
A resident (1 to 5 years’ experience) or a senior radiologist (more than 10 years’ experience) performed the imaging reports according to RECIST 1.1 criteria. At least three target lesions were measured manually or by a dedicated software Myrian (Intrasense). Patients presenting a new lesion during the follow-up were excluded from the study, because, in this case, the progression was independent of our endpoint of the sum of the targeted lesions.
2.2
Methods of exploration
The follow-up CT scans were all performed in university hospital centers of the APHM except for the pre-treatment CT exam performed in external centers and imported into the PACS. The patients received between 70 cm 3 and 120 cm 3 of iodinated contrast medium (Omnipaque 350 mg I/ml or Xenetix 350 mg I/ml) except for two scans performed in the context of acute renal failure. All acquisitions analysed have a slice thickness of less than 2 mm.
2.3
Data collection
Age and tumor type were collected from our institution’s computerized patient records (Axigate). The date of the examinations, the number of target lesions and the sums of target lesions were extracted from the reports available on our RIS (Xplore, EDL). Tumor response assessment was also collected when specified. When not specified, each follow-up was assigned a response assessment from the conclusion information. No further measurements were performed on the CTs. This was intended in order to evaluate the reported measurements and those obtained using the software.
Irregularities were defined as: 1) human calculation errors, 2) reports comparing measurements to a previous CT rather than to the baseline CT, and 3) tumor response not specified in the conclusion. The sums of the target lesions were recalculated for each report. Only follow-ups #2 and #3 were included in the analyses for comparisons to the baseline CT. Reports were considered non-compliant if they were compared to a previous CT scan, or if the sums of the target lesions used for comparison corresponded to those of a previous scan. Finally, the conclusion was considered non-compliant if the tumor response was not explicitly shown.
2.4
Analysis with the imaging software
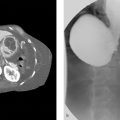
The Intrasense Company permitted us to use a demonstration of their Myrian XL Onco version 2.8 on a dedicated console. This tool is an oncology follow-up application that automatically retrieves the patient’s history from the PACS, resizes the slices using the 3D elastic method and calculates the response to treatment according to the chosen criteria (RECIST, CHOI, etc.). An example of tumor response assessment with the software is presented in Fig. 1 .

All the CT scans were exported from PACS and anonymized on the automatic application. A five years’ experience radiologist was trained by the Intrasense staff. The radiologist then reprocessed each baseline CT exam on the software by selecting the same target lesions and performing nearly identical measurements. All follow-ups were performed under close to routine conditions. All target lesions were measured manually. Non-target lesions were labelled or measured manually. The tumor response assessment was done automatically for the target lesions and manually for non-target lesions. Non-target lesions were classified as a complete response, an unequivocal progression or neither a complete nor a progression response.
2.5
Statistical analysis
To estimate interexam agreement of target lesion sums, the intraclass correlation coefficient (ICC [95 % confidence interval]) was estimated based on mixed-effects, absolute agreement, and single-score models. To estimate the agreement between manually and software assisted tumor response assessments, a weighted kappa coefficient was calculated.
Paired t tests (target lesion sums) and paired Wilcoxon tests (tumor response assessment) were used to assess whether one examination was over- or underestimated as compared to the other. For all 2-sided analyses, a p < 0.05 was considered statistically significant. Statistical analyses were performed using IBM SPSS Statistics 20.0 (IBM Inc, New York, USA) except for weighted kappa calculated using the IRR package of R 4.0 software (The R Foundation for Statistical Computing Platform, Vienna, Austria).
3
Results
3.1
Study Population
Thirty-seven patients (23 men, 62 %) with a total of 121 CT exams were included in this study. The mean age at the time of the pretreatment exam (baseline CT scan) was 61 ± 11 years (range: 22-79 years). The most represented pathology was bronchial adenocarcinoma (13/37, 35 %) ( Table 1 ).
| Characteristics | Value |
|---|---|
| Average a ge (years)* | 61 ± 11 (22-79) |
| Gender (%) | |
| Women | 14 (38) |
| Men | 23 (62) |
| Primary n eoplasia (%) | |
| Bronchial adenocarcinoma | 13 (35) |
| Bronchial squamous cell carcinoma | 4 (11) |
| Poorly differentiated bronchial carcinoma | 4 (11) |
| Small cell bronchial carcinoma | 3 (8) |
| Clear cell renal carcinoma | 2 (5) |
| Invasive ductal breast carcinoma | 2 (5) |
| Melanoma | 2 (5) |
| Non-small cell bronchial carcinoma | 1 (2.7) |
| Small cell neuroendocrine carcinoma | 1 (2.7) |
| Pulmonary large cell neuroendocrine carcinoma | 1 (2.7) |
| Sarcomatoid lung carcinoma | 1 (2.7) |
| Thymic carcinoma | 1 (2.7) |
| Liposarcoma | 1 (2.7) |
| UCNT cavum | 1 (2.7) |
| Number of target lesions (%) | |
| 3 | 18 (48.6) |
| 4 | 11 (29.7) |
| 5 | 8 (21.6) |
| Number of follow-ups (%) | |
| 2 | 27 (73) |
| 3 | 10 (27) |
Related posts:

Stay updated, free articles. Join our Telegram channel

Full access? Get Clinical Tree


