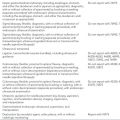
Figure 14-1. B-mode image of normal arterial wall vs atherosclerotic arteries.
Although much of this chapter is devoted to discussing the diagnosis of arterial disease, the most widely used application of ultrasound to the vascular tree is for the evaluation of venous disease, most notably deep venous thrombosis (DVT). In addition, duplex scanning can be of great help in evaluating venous incompetence. Valve failure can be seen by directly using B-mode imaging and time to valve closure can be assessed (Figure 14-3). The duration of venous reflux (time to valve closure) in the normal popliteal vein while standing using rapid deflation cuffs is 0.5 seconds.7 Using more complex techniques, the degree of valvular incompetence can be measured. In order to do this, one uses volumetric techniques, which require the measurement of three variables: vein cross-sectional area, reverse flow velocity, and duration of reflux. Of more practical utility, the use of color flow sampling allows for the immediate assessment of direction of flow, and therefore venous reflux is identifiable at almost any point in the venous tree.
SCANNING TECHNIQUES FOR OBTAINING IMAGES
General Factors: Doppler recordings should be made in a warm room with the patient comfortable, usually supine. Transverse B-mode images are used to identify vessels and map general anatomy. However, when intravascular flow velocities need to be obtained, the probe is placed directly over the artery at a 60-degree angle. It is very important to note that even in this day and age of very advanced technologies ultrasound remains operator-dependent. Determination of the Doppler probe angle is crucial even though the modern duplex machine has an angle correction feature. In general, the angle between the ultrasound beam and the column of blood must be 60 degrees or less.8 The reason this is so important is that in the Doppler equation velocity is a function of the cosine of the angle between the ultrasound beam and the blood flow. At angles greater than 60 degrees but less than 90 degrees, the cosine value changes rapidly; therefore, very small errors in angle above 60 degrees will result in significant changes in velocity.
 Arterial Studies
Extracranial carotid artery
The standard for scanning of the extracranial carotid anatomy was outlined by the University of Washington in 1984.9,10 The fundamentals of this study are based on obtaining velocity criteria. While much work has been done on analyzing the B-mode images and characteristics of the spectral waveform, the majority of the technique is dependent upon accurately assessing the intraluminal arterial flow velocities.
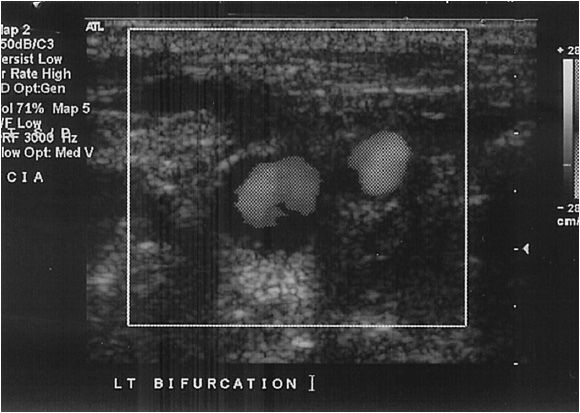
A Doppler probe with a transmitting frequency of 4 to 7.5 MHz should be used. The common carotid artery (CCA) is identified using the B-mode and color flow imaging. The probe is placed transversely at the base of the neck. The CCA should be followed toward the ear until the bifurcation is identified (Figure 14-4). One of the two most critical components of the study is the delineation of the internal carotid artery (ICA) from the external carotid artery (ECA). The ICA is usually the posterior branch and has a low-resistance Doppler signal, whereas the ECA is typically anterior and has a high- resistance signal. It is not uncommon for both of these vessels to have a high-grade stenosis, so correct identification is mandatory. In the case of difficult anatomy, the technologist should look for branches starting with the superior thyroidal, as the ICA fundamentally has no branches. If still in doubt, the “temporal tap” can be used; this maneuver consists of tapping the temporal artery at the zygomatic arch and evaluating the reflected wave in ECA Doppler signal. Color flow is also useful for following the tortuous ICA.
Once the correct arteries are identified the study is completed with a sagittal and transverse imaging survey. In this way, appropriate velocity points are identified. The peak systolic velocity (PSV) and end diastolic velocities (EDV) at numerous points are recorded; the CCA is examined as far centrally as possible, and any points of stenosis are noted. The Doppler sample volume probe is used to record both the PSV and EDV, as well as spectra at the points of maximal stenosis. The probe must be kept at an angle of 60 degrees or less to allow for appropriate velocity readings. To aid in preoperative planning, it is helpful to note the location of the bifurcation in the neck as well as the presence of a normal segment of ICA beyond the plaque.
Brachiocephalic arteries
This area is a difficult area to scan due to the clavicle and the manubrium. However, in skilled hands duplex scanning has good sensitivity in this location.13 With the standard probe technology the origins of the arch vessels cannot be assessed due to interference from the sternum, manubrium, and clavicle. Much of this assessment is based on the flow characteristics in the more distal segment of the arch vessels. If great vessel stenosis is seen directly, it should exhibit the characteristic prestenotic through poststenotic pattern, with significant changes in PSV ratio. The proximal stenosis dampens the waveform and decreases peak systolic (PSV) and end diastolic velocity (EDV). However, other indirect findings of central stenosis may include increased turbulence with increased spectral broadening, a very dampened waveform, a notched vertebral waveform, or reversal of flow with diastolic antegrade flow.11
Vertebral arteries
This arterial bed is a portion of the routine carotid examination. The best window in which to image these vessels is between the transverse process of the cervical vertebrae, which is generally posterior and slightly medial to the CCA. The vertebral arteries can then be followed centrally to their origin from the subclavian artery. Duplex ultrasound has been shown to be 93% sensitive for significant vertebral artery disease.12 Color flow Doppler has been shown to be helpful in diagnosing dissections and for direction of flow, while power Doppler may be useful for evaluation of vertebral artery origin disease.13,14,15 Unlike the carotid artery, there is no quantitative grading scale for vertebral artery stenosis. Therefore, the technologist’s job focuses on identification of the vessel and checking for presence, quantity, and direction of flow. The technologist’s direct output should include comments on subjective interpretation of flow signals, excessive flow, dampened waveforms consistent with proximal stenosis, and high-resistance signals.
Transcranial Doppler
Transcranial Doppler (TCD) is not widely used outside of the operating room and requires some unique probes. First described in 1982, one uses a low-frequency (2 MHz) Doppler device to penetrate the skull and measure velocities and direction of flow. While the primary indication for the technique is the diagnosis of vasospasm after subarachnoid hemorrhage, it can also be used intraprocedurally during carotid revascularization (both open and percutaneous) to detect emboli, to determine if an intraoperative shunt needs to be placed, and to confirm shunt function. The difficulty in maintaining the adequate transtemporal window is a key limiting factor. Technical failure rates range from 15% to 40%.16,17
The actual technique starts with the identification of the best transtemporal window outlined by the bony landmarks, the petrous ridge, and the sphenoid bone. The middle cerebral artery (MCA) is identified first as having blood flow toward the probe. Velocities and sampling depths are then recorded at three depths along the artery. The bidirectional anterior cerebral artery (ACA)–MCA bifurcation signal serves as a landmark. The transoccipital approach is used to sample the vertebral arteries. These vessels traverse the foramen magnum and flow away from the probe.
 Aorta and Abdominal Visceral Arteries
Renal arteries
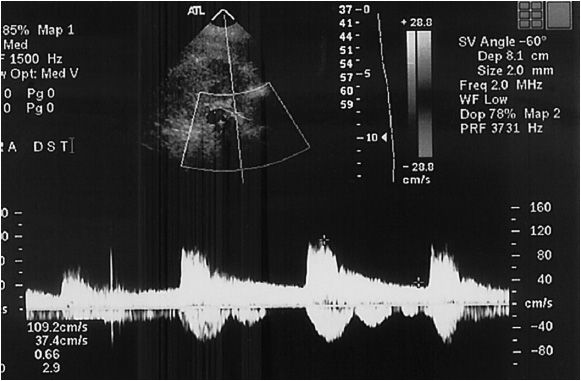
Due to the deleterious effect of air on ultrasound waves, abdominal studies are best performed after an overnight fast to help reduce bowel gas. A low-frequency transducer is preferred (3.0 MHz). The patient is initially evaluated in the supine position, from a midline approach, starting vertically at the xiphoid. The first anatomic landmark is the suprarenal aorta where an aortic velocity is obtained. The technologist then rotates the probe 90 degrees to obtain a transverse image to identify the left renal vein as it crosses the aorta. This is an excellent landmark for the renal artery origin. While most renal artery disease is at the origin of the artery, the entire artery should be evaluated from its beginning to the renal parenchyma (Figure 14-5). Angle-corrected velocities are collected from the aorta to the parenchyma. The aorta should also be assessed for the presence of accessory renal arteries. If overlying bowel gas is obstructive, placing the patient in a lateral decubitus position often shifts the viscera away and allows for visualization. Obesity can also impair the visual windows to the renal artery. While lower imaging frequencies are of some use in the obese patient, the loss of resolution that results can make it ineffective.
Like the carotid artery, spectral analysis and PSV are recorded, as they are important for the determination of the level of stenosis. In addition, the kidneys themselves need to be assessed in their coronal view to determine the length of the kidney. It must be noted that transabdominal renal artery studies are notoriously difficult, with 5% to 12% incidence of unsatisfactory examinations.
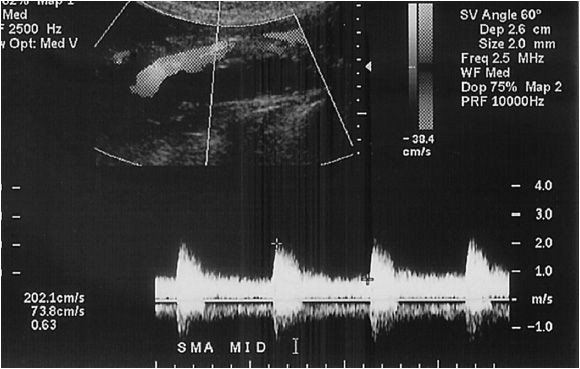
Mesenteric arteries
In this, vascular bed fasting is important in not only reducing obstructing bowel gas, but also to manage the velocity of blood in the superior mesenteric artery (SMA). The SMA waveform changes from a low-flow/high-resistance pattern to a high-flow/low-resistance waveform after eating. The patient is usually imaged supine, and as with renal studies, low-frequency transducers are used (3.0 MHz). The transducer is placed just below the xiphoid, but in some cases, a right lateral approach using the liver as an acoustic window is the most useful, especially with a thick abdominal wall or excessive overlying bowel gas. The hepatic, celiac, and superior mesenteric arteries are all evaluated. The skilled technologist will be able to delineate the splenic, gastroduodenal, and inferior mesenteric arteries (Figure 14-6). It should be noted that body habitus and gas can make these studies difficult for the uninitiated. In addition, a thorough understanding of the anatomic variations is necessary in order to recognize anomalous anatomy, which may be present in up to 20% of patients.
Aorta and iliac arteries
Again, while not as important as in the evaluation of the smaller vessels, an overnight fast is desirable in order to reduce bowel gas. Once again the 3-MHz transducer is used, and while lateral windows can be necessary, a midline approach is usually adequate. Similar to the renal study, the aorta is insonated just below the xiphoid. The study then proceeds to the bilateral inguinal creases. For severe aortic and iliac stenosis no strict criteria correlate to a physiologic effect of stenosis. B-mode imaging takes on a larger role in these anatomic beds, as diameter (ie, aneurysm) matters more in many cases than stenosis. For the aneurysmal vessel the cross-sectional area of the vessels is evaluated with great care in the correct orientation to ensure appropriate sizing of the vessel. To aid in the potential decision for endovascular repair, the distance between the lowest renal artery and the dilation of the aorta should be measured.
Peripheral Vessels and Arteriovenous Grafts/Fistulas
The 7- to 7.5-MHz transducer is typically used to study these peripheral vessels. As the vessels get smaller (such as the tibial arteries), color flow imaging becomes much more useful. In the distal arterial beds, technical adequacy of the examination for vessel anatomic lesion identification exceeds 90%.18
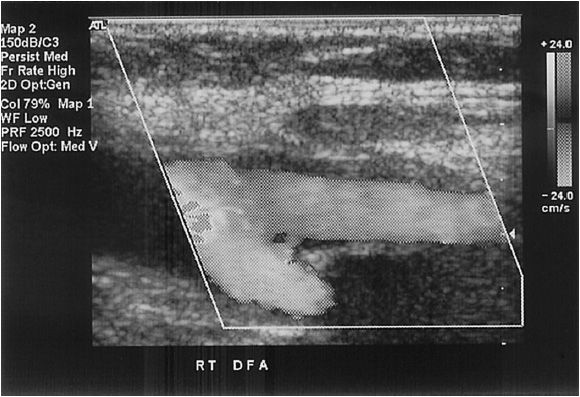
Femoral artery
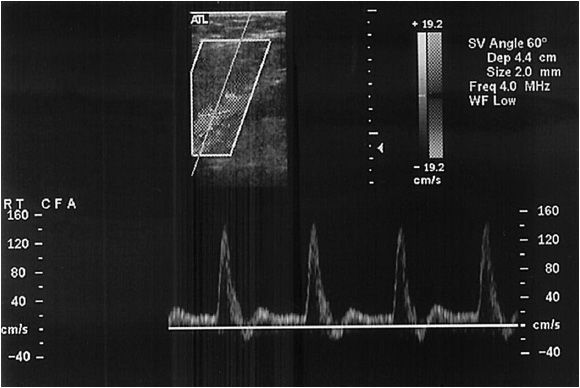
This artery is examined above the groin crease, as the inguinal ligament is defined by the pubic tubercle and the anterior superior iliac crest, which is usually above the groin crease. The end of the common femoral artery is defined as the point where the profunda femoris originates and bifurcates to become the superficial femoral artery (Figure 14-7).
Superficial femoral artery/popliteal artery
The probe can be placed medially in the thigh, in the groove between the quadriceps and the adductor muscles. For the popliteal artery the probe can be placed medially or posteriorly. From a medial approach, flexion of the knee and mild external rotation of the leg facilitate visualization of the artery.
Surgically created arteriovenous fistula
This study is designed to assess the location and any abnormality in a hemodialysis access. In these settings, it is paramount to understand the anatomic configuration of the access. In order to understand the anatomy, one should find the arterial to conduit (vein or graft) anastomosis first; this will be an end-conduit to side-artery configuration in almost all cases. It can be difficult to insonate this area at 60 degrees to the angle of flow due to the configuration, but the area can also be recognized by its high flow and turbulence. Once the origin of the arterial inflow is found, the conduit is traced toward its venous outflow. The initial evaluation of the fistula for diameter and stenosis is performed with gray scale imaging. Once completed, color and spectral Doppler are used for further characterization. The PSV is obtained at the anastomosis and in the artery 2 cm proximal to the anastomosis. The vein graft needs to be insonated along in its entire course, examining both sagittal velocity images and cross-sectional images, which may delineate clot burden and/or aneurysmal dilations. The two most likely sites of stenosis are the arterial anastomosis and, if a graft is used, the anastomosis to the outflow vein.
Any visible narrowing of the access on B-mode image should be assessed with velocity criteria, and any color flow aliasing should be assessed carefully as well. Aliasing is a form of artifact that occurs during spectral analysis, where the spectrum is “wrapped” around the screen so that the top of the waveform is seen at the bottom. This problem can be corrected by increasing the pulse repetition frequency (PRF) (aliasing occurs when the highest Doppler shift is greater than half the PRF), increasing the Doppler angle, shifting the baseline, lowering the emitted frequency, or using a continuous wave device. If a narrowing is found, the velocity at the narrowing is compared to the velocity 2 cm distal (within the access) from the narrowing. The direction of flow distal to the anastomosis should be assessed for directionality. Distal artery steal is found in 20% of AV access, although it is usually asymptomatic.19 Though hard to detect with ultrasound, in some cases of steal reversal of flow in the artery distal to the conduit anastomosis can be seen during diastole.
Somewhere between 28% and 53% of surgically created AVFs fail to mature.20 If an AVF does not appear to be maturing four weeks after creation, ultrasound may be performed to determine the underlying cause. The above criteria should be measured as well as volumetric blood flow in the midportion of the draining vein. A portion of the vein that is straight, nontapering, and nonturbulent is selected; a time-averaged PSV (over 3–4 cardiac cycles) is obtained. The area of the access is obtained using the B-mode function; then by multiplying the cross-sectional area with the velocity, one obtains the volume of flow. For accurate determination of flow rates a 9- to 15-MHz transducer is necessary, preferably a linear array transducer. Venous side branches are identified, and their size and the distance from the anastomosis are assessed. Such veins can be ligated to help a nonfunctioning access to mature.21
 Venous Studies
Evaluation for deep venous thrombosis
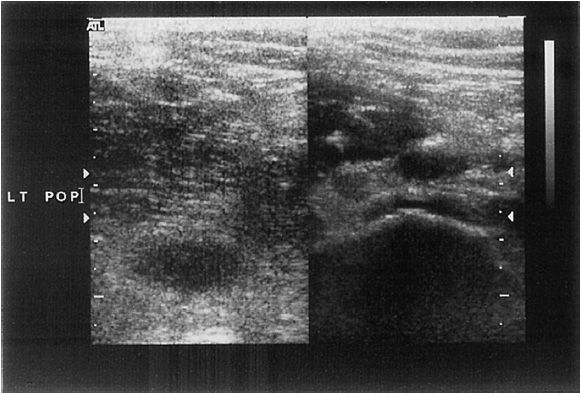
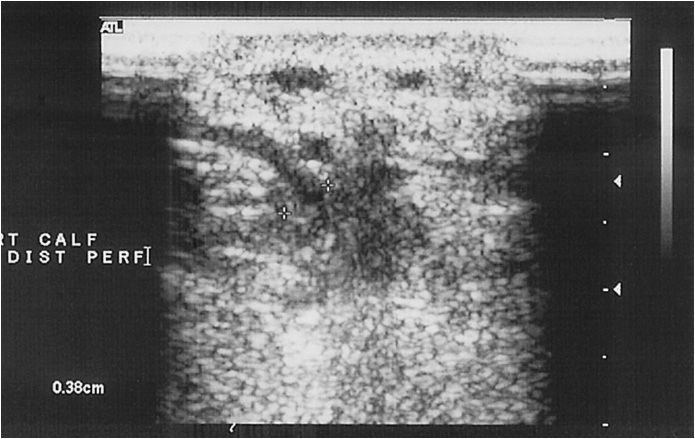
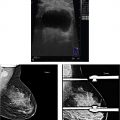
The most commonly performed vascular ultrasound study is the “rule out DVT” study. The fundamental purpose of this study is to determine if the patient has a potentially life-threatening condition, namely, thrombosis of the lower extremity vessels. The procedure consists of compressing the popliteal, superficial femoral, and common femoral veins, ensuring that the vein is fully compressible (Figure 14-8) and that it reforms normally with no evidence of obstructive clot (Figure 14-9). The addition of normal respiratory movement within the vessel is an indicator that the proximal veins are patent.
Complete examination involves interrogation of the lower extremity from the inferior vena cava to the tibial veins. At each position, the technologist must assay the vein for venous compressibility and the presence of echo-genic thrombus with B-mode imaging; venous flow characteristics are assessed to determine proximal occlusion. The deep veins should be interrogated in both transverse and longitudinal views. Compression maneuvers are performed in the transverse view every 1–2 cm from the inguinal ligament to the calf. If the vessel walls coapt completely with gentle pressure, thrombosis can be excluded. Longitudinal views are then obtained, evaluating both spectral Doppler images and color flow images. Color flow is helpful in identifying partial vessel occlusion of acute echolucent thrombus.
The head of the bed should be elevated approximately 20 degrees in reverse Trendelenberg to facilitate venous filling. The examination starts at the level of the umbilicus, ideally, where Doppler flow evaluation of the iliac veins can be achieved. Although compressibility is limited secondary to the abdominal wall, bowel gas, and patient discomfort, in a thin and compliant patient one can try compression maneuvers. Once at the inguinal ligament, the origin of the greater saphenous and profunda femoris vein can be identified by holding the probe transversely to the vessels’ course. The superficial femoral vein is best examined with the leg slightly flexed and abducted, while the superficial femoral vein in the abductor canal may be noncompressible. Color flow is used to assess for duplicate superficial femoral veins that are common.22 While the popliteal vein is best examined with the patient prone, most technologists just move the probe posteriorly to the popliteal fossa to allow for patient comfort.
However, once the popliteal vein is assessed, it is much easier to assay the infrageniculate veins in the prone position. Many technologists keep the patient sitting, though, which is not only more comfortable for the patient but facilitates venous filling.23 The paired posterior tibial veins are identified adjacent to the posterior tibial artery at the groove between the medial malleolus and the Achilles tendon and are then followed cephalad. The paired pero-neal veins are identified along the medial border of the fibula, again abutting the centrally located peroneal artery. If thrombus or a postphlebitic state is present proximally these distal veins may be quite distended and prominent. Similarly, the gastrocnemius and more notably soleal veins may be distended in the presence of infrageniculate vein thrombosis. For a complete examination both the peroneal and the posterior tibial veins need to be assessed. Isolated calf vein thrombosis most often involves the peroneal veins, followed by the posterior tibial veins, while isolated anterior tibial vein thrombosis is very rare.24
The upper extremity veins and the thoracic inlet examination are performed with the patient supine, with the neck turned to the contralateral side. The upper extremity is abducted to facilitate access to the axilla. First the internal jugular vein is identified in the neck and followed into the mediastinum to identify the medial subclavian and innominate veins, which are insonated from a supraclavicular window. The probe is then moved to the infra-clavicular lateral window to image the lateral subclavian and axillary veins. While with patience and in the right body habitus the entire subclavian vein can be seen, overlying bone and muscle prevent the use of compression as a mode of fully evaluating these vessels in most cases. Therefore, color flow Doppler and appropriate variation with respiration are very helpful in assessing patency. The examination can then proceed down the arm to evaluate the axillary, paired brachial, basilic, and cephalic veins. If need be, the paired radial and ulnar veins in the forearm can also be assessed.
Evaluation of chronic venous disease
In the evaluation of chronic venous disease, the author feels it is best to separate the problem into the components of venous disease as outlined in the CEAP classification scheme.25 While the (C)linical classification portion is very helpful to the clinician, for the ultrasonographer it is (E)tiology, (A)natomic, and (P)athophysiologic classification systems (Table 14-1) that allow the individuals using ultrasound to determine the cause of the disease, and to place the appropriate weight on their findings. Fundamentally, when assessing the patient with chronic disease one wants to determine where (anatomic classification), what (pathophysiologic classification), and why (etiologic classification).
Chronic deep venous disease
Duplex ultrasound is well suited to visualize partial and complete anatomic obstruction of the deep and superficial venous system. In addition, it can assay valve closure times and characterize direction and duration of flow in the deep, superficial, and perforating venous systems. In general, the initial assessment of the patient with chronic venous disease is carried out as described in the section on assessing for DVT. However, there are many added maneuvers to aid in the diagnosis.
Valve closure is a passive event, which is initiated by the reversal of flow. This occurs as the venous pressure grade is reversed; therefore, there is a short period of physiologic reflux until the gradient is sufficient to result in valve closure. Valve closure, in part, depends upon flow velocity; at reversed flow velocities greater than 30 cm/s, valve closure will occur as rapidly as 100 m/s; at velocities less than 30 cm/s, valve closure can take significantly longer. Therefore, the determination of valvular incompetence requires that pathologic reversal of flow be reproduced. In addition, since clinically relevant reflux occurs during calf muscle contraction and relaxation while standing, tests to elicit valvular incompetence should mimic this condition. In the supine position, the combination of Valsalva and manual compression has been noted to be 88% sensitive and 93% specific for detecting reflux in the SFV.26 Therefore, the patient is best tested in the standing position,27 and rapid inflation and deflation pneumatic cuffs should be used. Rapid distal cuff deflation simulates calf muscle relaxation and is the most reproducible method for eliciting valve closure. Pressures of 80 mm Hg in the thigh, 100 mm Hg in the calf, and 120 mm Hg in the foot with 3 seconds of inflation time and 0.3 seconds of deflation time have been shown to be appropriate.28 Using these techniques, both the deep and the superficial systems can be assessed. In the supine position, Valsalva and manual compression have been noted to be 67% sensitive, while 100% specific for detecting superficial reflux.26 When assessing the superficial system, not only should valvular reflux times be reported, but GSV diameter should be reported at the junction with the CFV, mid thigh, and distal thigh, and duplications of the GSV should be reported as well. When assaying the short saphenous vein (SSV), reflux times in addition to diameters should be reported.
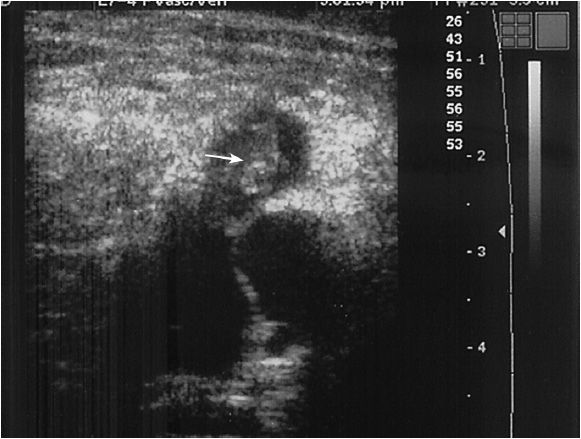
Perforator disease
The perforating veins are evaluated while standing, and can be seen along the course of the superficial femoral vein in the distal thigh. In the distal calf, perforating veins are evaluated along the posterior tibial veins. Usually, one to six perforating veins can be found, and the veins are traceable as they penetrate the fascia between the superficial and deep venous compartments (Figure 14-10). These veins are variable in location and may occur anywhere along the medial calf; the most common locations are just below the malleolus, 15 to 19 cm and 30 to 34 cm proximally.27,28 Flow in nonpathologic perforators is only from superficial to deep, and occurs during distal compression of the foot or calf. Any bidirectional or reversal of flow during the relaxation phase after compression is consistent with pathology.27 Duplex ultrasound for perforators has been noted to be 82% sensitive and 100% specific when compared to surgical findings.29
COMMON FINDINGS/ABNORMALITES
 Arterial Studies
Extracranial carotid artery
In this author’s opinion, probably more has been written about the findings and interpretation of carotid studies than any other vascular ultrasound procedure. The carotid artery study needs to include the PSV and EDV within the tightest portion of the carotid. The original University of Washington study focused on frequency shift where angle-adjusted velocities were 4 kHz=125 cm/s, and 4.5 kHz=140 cm/s (Table 14-2). The CCA velocity is noted as many grading scales use a ratio of ICA:CCA velocity to aid in determining the degree of stenosis (Table 14-3).30 The degree of plaque and the characteristics of the plaque should be commented upon, in addition to any unusual anatomy; twists, kinks, and loops should be documented. The amount of plaque should clearly be described, as the carotid bulb can be dilated and therefore a significant amount of plaque can be present with low velocities. Waveforms that are consistent with proximal stenosis should also be noted. A finding of the pathognomonic “string of pearls” or “chain of lakes” appearance of fibromuscular dysplasia must be documented, especially if the patient is a middle-aged female.
In the mid 1990s debate around two pivotal carotid artery surgery trials, the North American Symptomatic Carotid Endarterectomy Trial (NASCET) and the Asymptomatic Carotid Artery Surgery (ACAS), defined a new convention for the radiographic method of determining stenosis. Since ultrasound is still compared to contrast arteriography, it is necessary to understand what portion of the carotid is defined as “normal” against which the percentage of stenosis is determined. The narrowest portion of the lumen is now compared to the “normal” appearing distal internal carotid artery, while historically the stenotic area was compared to the bulb of the carotid to determine the percentage of stenosis.33,34
Contralateral ICA stenosis/occlusion can result in very significant compensatory flow increases in the ipsilateral CCA/ICA. Therefore, in patients with a contralateral occlusion PSV-based stenosis criteria may be artificially elevated. No strict grading scales have been devised for this situation. The author recommends using CCA:ICA ratio and B-mode imaging in addition to EDV ratios in this situation. Also, in the setting of bilateral high-grade stenosis, repeat of the contralateral carotid ultrasound is necessary after ipsilateral carotid revascularization, as the decreased need for compensatory flow may downgrade the measured level of stenosis.
Postcarotid intervention studies are performed on a scheduled basis by most centers. This usually follows a schedule of 1 month, 3 months, 6 months, and 1 year post intervention. Classically, it is agreed that technical errors will be noticed at the 1-month ultrasound, accounting for this relatively short follow-up interval. Neointimal hyperplasia can cause restenosis at up to 2 years; and after 2 years, recurrent disease is recognized as the cause of restenosis. Most labs use their standardized velocity criteria to evaluate postoperative restenosis. However, with the addition of carotid stenting, whether of questionable utility or not, the criteria for restenosis needed to be modified in the cohort that undergo stenting. In addition, since this group did not have an atheroreductive procedure, carotid duplex is recommended previous to and 24 hours after placement of the stent in order to establish baseline PSV data for the ICA and CCA. Otherwise, the patient should follow the same schedule as above,; if there is an increase in PSV of 80% in the stented segment, an 80% increase in the ICA:CCA ratio, or the finding in Table 14-4, the patient should undergo further radiographic reimaging, usually contrast arteriography.35,36
TABLE 14-4
Related posts:
Stay updated, free articles. Join our Telegram channel

Full access? Get Clinical Tree


