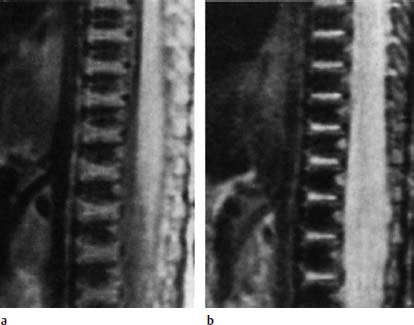
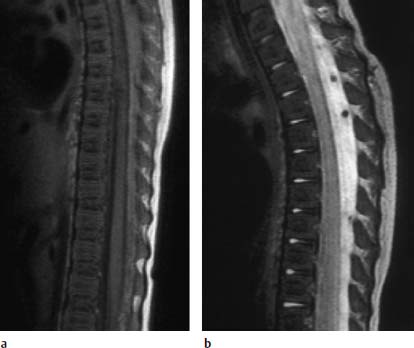
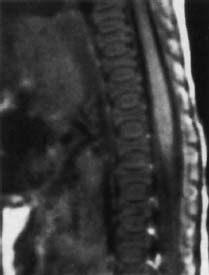
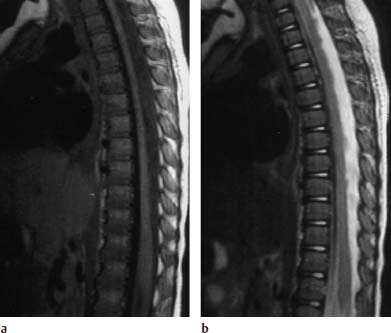
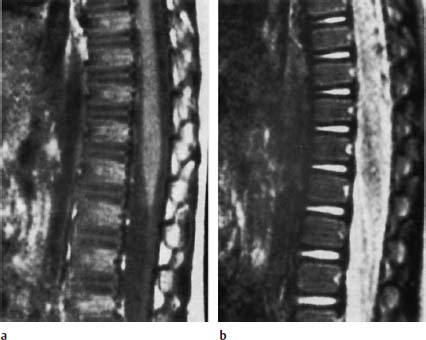
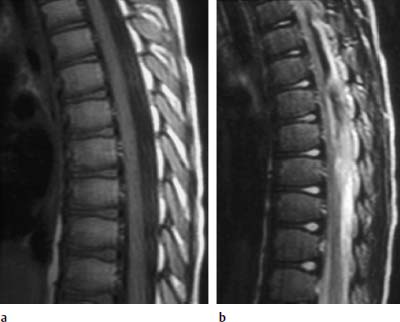
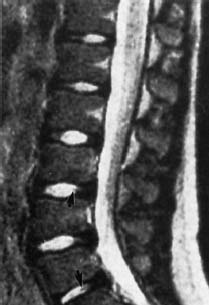
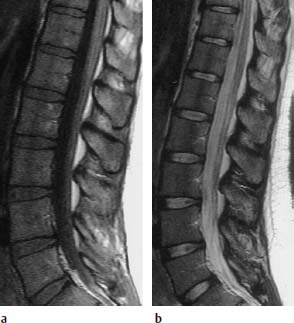
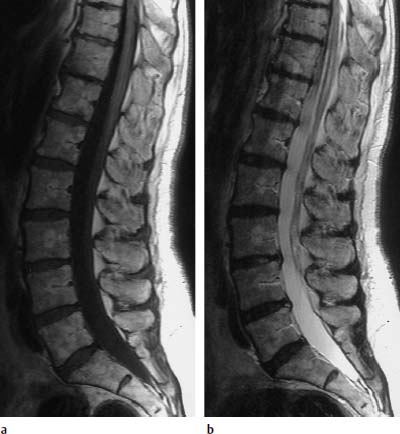
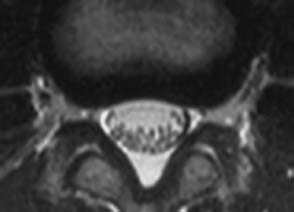
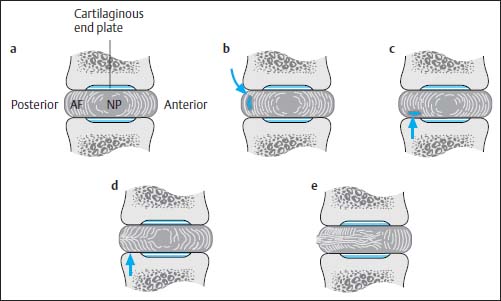
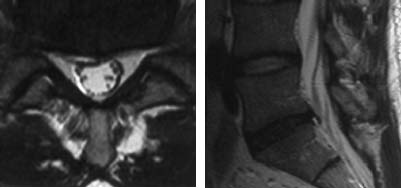
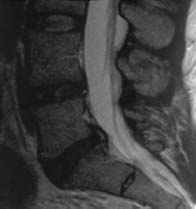
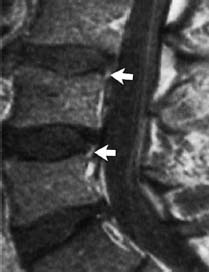
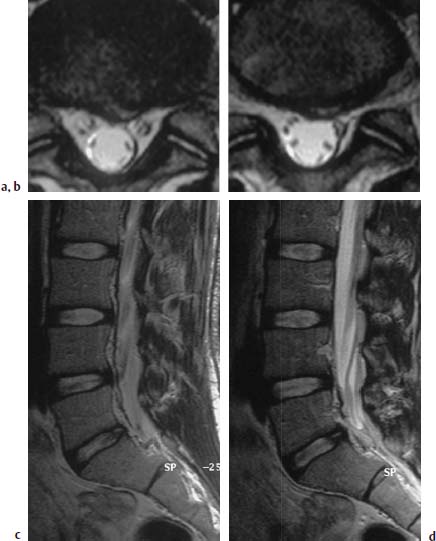
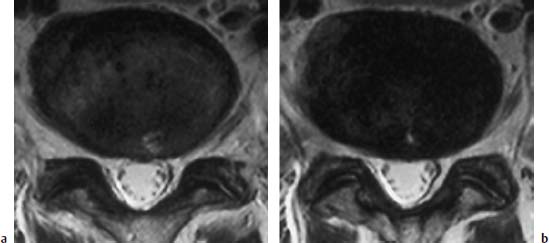
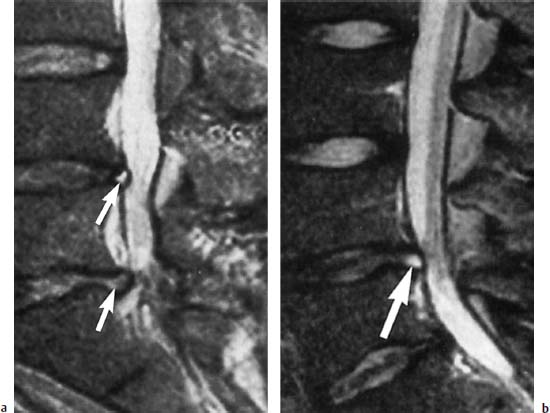
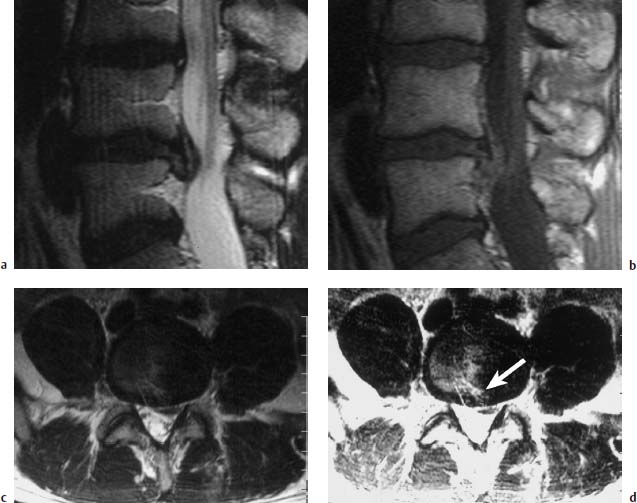
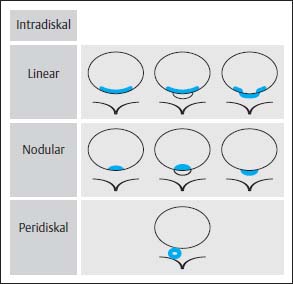
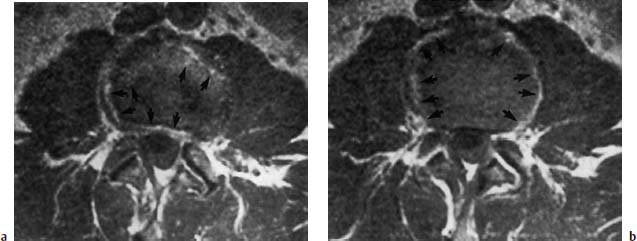
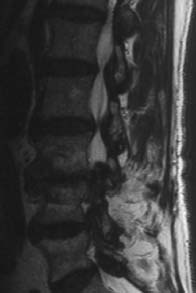
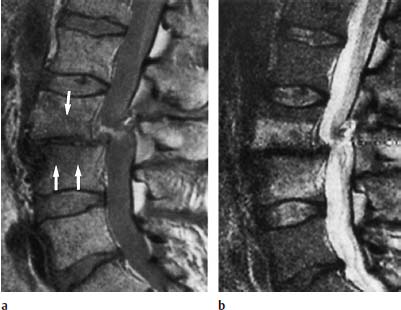
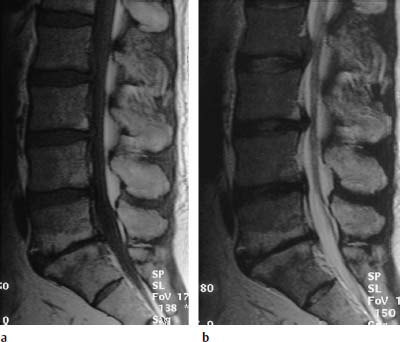
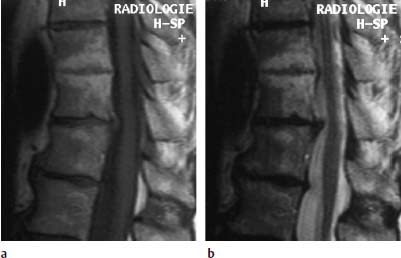
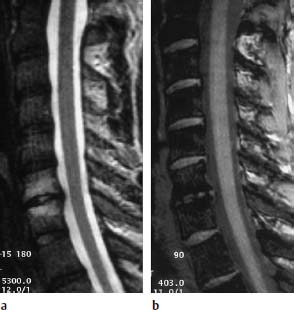
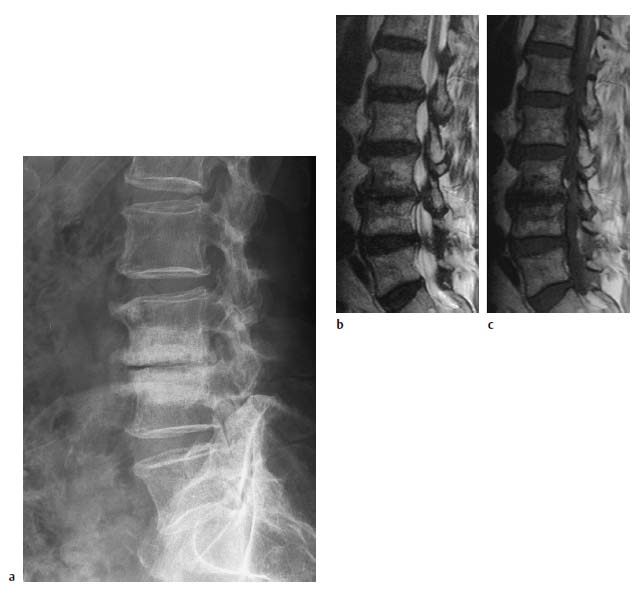
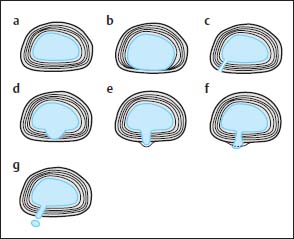
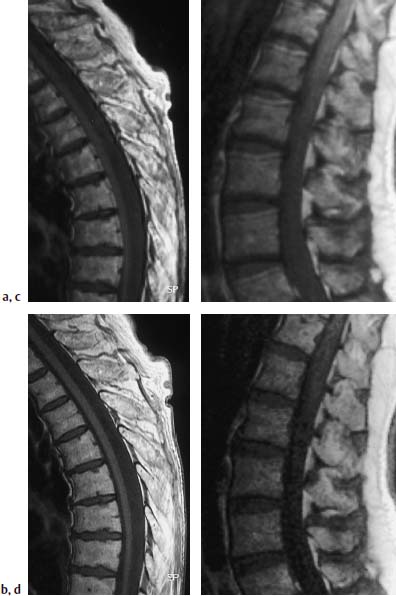
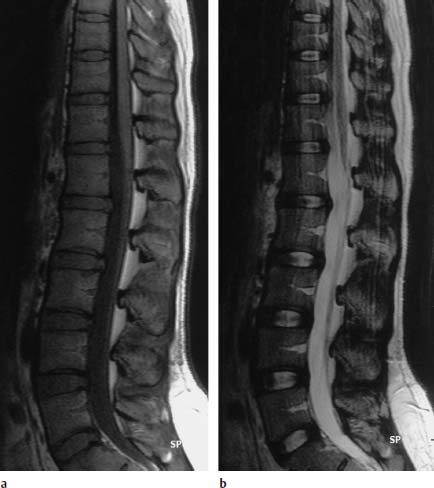
4 Degenerative Disorders of the Spine Contents The Ageing Process of the Intervertebral Disk Classification of Intervertebral Disk Degeneration Degenerative Changes of the Vertebral Body End Plates Classification of Intervertebral Disk Herniation Degenerative Changes of the Lumbar Spine Degenerative Changes of the Thoracic Spine Degenerative Changes of the Cervical Spine Acquired Spinal Canal Stenosis In collaboration with W. Weber, H. Henkes and D. Kühne MRI Findings after Lumbar Disk Surgery MRI Findings after Cervical Disk Surgery Degenerative processes of the diskovertebral and synovial joints as well as degenerative changes of the ligamentous system are all included under the term “degenerative disorders of the spine.” Pathogenesis Degenerative disorders are basically the consequence of the normal ageing process, resulting in damage to the intervertebral disks, the adjacent bony structures, the other joints, and the ligamentous system. The factors promoting degeneration are the morphological changes that affect the biomechanics of the axial skeleton and include e.g. • scoliosis, • lumbosacral assimilations, • other congenital vertebral anomalies. Instabilities, e.g. due to laxity of the ligamentous system, spondylolisthesis or disorders of the joints, can also accelerate a degenerative process. In individual cases, continual bad posture or bearing abnormally heavy weights, as can happen with occupational overloading or sports activities, are of clinical relevance. Other causes such as genetic factors and autoimmune processes are also under discussion. In the majority of cases there are several factors that determine the pathogenesis of degenerative disorders of the axial skeleton. The clinical relevance of the degenerative changes found can vary considerably in individual cases. Clinical symptoms may be completely lacking in one patient, while their clinical presentation in another may be more striking despite only the slightest sign of a degenerative process. The Ageing Process of the Intervertebral Disk A major factor in the pathogenesis of degenerative disorders of the spine is the ageing process of the intervertebral disk involving a biochemical and histological remodeling; this is the cause of a large proportion of clinically relevant symptoms. A great number of radiological and, in particular, MRI examinations are focused on the state of the intervertebral disk. Structures of the Intervertebral Disk Cartilaginous end plate. The cartilaginous end plate is the morphological, and also in a sense the metabolic, connection between the nucleus pulposus and the vertebral body end plate. Degenerative processes of the disk spread to the vertebral body via the end plate. Because the end plate in the adult no longer contains blood vessels, metabolic exchange between the structures is by diffusion. The various structures of the intervertebral disk Annulus fibrosus. The annulus fibrosus forms the anterior and posterior margins of the intervertebral disk. Its fibers are firmly attached to the bone via Sharpey’s fibers. The fibers of the annulus are also attached to the anterior and posterior longitudinal ligaments. Nucleus pulposus. The nucleus pulposus is composed of a gelatinous matrix with a high water-binding capacity. About 85–90 % of the nucleus consists of water while the water content of the annulus fibrosus is around 80 %. Elasticity is a characteristic of the nucleus pulposus (Modic et al., 1988; Ho et al., 1988; Yu et al., 1988). Histology Histologically the nucleus pulposus and annulus fibrosus are composed of fibrocartilaginous ground substance and collagen. Protoglycans are the principal macromolecules found, and are present in larger numbers in the nucleus pulposus than in the annulus. The periphery of the annulus fibrosus (Sharpey’s fibers) consists of dense collagen (type I) with lower water content. Collagen fibers with a higher water-binding capacity are found towards the center (type II collagen fibers) (Modic et al., 1988). In the normal disk, the MR signal represents the difference between the low signal intensity of the collagen and the high signal intensity of the fibrocartilaginous ground substance of the intervertebral disk. During the ageing process and in the course of the degeneration of the intervertebral disk, the disk loses water. This process is more pronounced in the nucleus pulposus than in the annulus fibrosus. The water content is reduced in both structures to about 70 % overall. The reduction of the water-binding capacity of the nucleus pulposus is mainly due to the loss in molecular weight of the proteoglycan complexes, which is explained by shifts within their individual biochemical components. Furthermore, there is an increase in the fibrous structures of the nucleus pulposus, which grow towards the center of the intervertebral disk from the anterior or posterior margin. In the final stage, nucleus pulposus and annulus fibrosus are no longer sharply demarcated from one another. In fact, a uniform amorphous fibrocartilaginous tissue with only slight elasticity and a clear reduction in height is found (Aguila et al., 1985; Modic et al., 1988; Yu et al., 1988). Degeneration of the Intervertebral Disk Changes of the Cartilaginous End Plate The degeneration of the intervertebral disk is associated with changes of the cartilaginous end plate. The chondrocytes situated near the vertebral body calcify and become degraded by the bone. The end plate consequently becomes reduced in thickness; its attribute of separating the vertebral body from the nucleus pulposus is lost. Fissures and microfractures develop that are partly lined with granulation tissue. In addition, regenerating chondrocytes are also found. Nucleus pulposus material can penetrate into the fissures; intravertebral hernias can develop and are found together with disk degeneration. At this stage the vertebral end plates show signs of subchondral sclerosis on plain films and are sometimes interrupted and in parts irregularly contoured. Herniations within the cancellous bone are bordered by marginal sclerosis, which can be quite pronounced. In severe cases the subchondral sclerosis can involve large portions of the vertebral body. In rare instances complete eburnation of the vertebrae is found (Resnick and Niwayama, 1978). The development of gas, which is found within the disk but can also leak out into the spinal canal via cracks and fissures, is typical for disk degeneration. This gas is nitrogen oxide. Degenerative Changes at the Apophyseal Joints Degenerative changes at the apophyseal joints can occur in conjunction with degeneration of the intervertebral disks. Disk degeneration leads to a reduction in height of the intervertebral space, which results in a caudal posterior dislocation of the vertebra situated proximal to the intervertebral disk. This leads to subluxation of the apophyseal joints, which alters articular load bearing and can result in reactive bony changes at the facets, particularly in the form of hypertrophy. Furthermore, disk degeneration also directly leads to additional load bearing. The loss of disk elasticity exposes the small vertebral joints to increased motion, particularly torsion movements. In addition, the loss of the nucleus pulposus displaces the center of rotation during movements within the spine further dorsally, even as far as the vertebral joints if the changes are pronounced. Instead of sliding motions, jerking movements occur which, in particular, lead to instability of the vertebral joints; this instability can be demonstrated on conventional functional views. In turn, as a result of the instability, increased tractive forces develop at the capsule-ligament complex of the joints with corresponding secondary bony reactions in the form of osteophyte formations. Instabilities can also be the result of surgery involving generous clearing of the intervertebral space. They can also occur secondary to chemonucleolysis or spondylolisthesis. Conversely, infectious or traumatic and, ultimately, also tumor-related processes, all of which result in instability of the small vertebral joints, can be the initiating cause of intervertebral disk degeneration (Resnick and Niwayama, 1988). Degenerative Changes at the Ligament and Joint-Capsule Insertions onto the Bone Degenerative changes are also found at the ligament and joint-capsule insertions onto the bone. These include, on the one hand, deforming spondylosis, which particularly develops anterior to the intervertebral space. Increased tractive forces are regarded as causative, originating from the annulus fibrosus, especially from Sharpey’s fibers, and being transferred to the bone. These tractive forces are caused by ventral disk protrusions which, when extensive, can lead to partial ruptures of individual fibers and result in a progressive extrusion of the disk in an anterior direction. This results in additional traction on the anterior longitudinal ligament, which is transferred directly to the bone at those sites where the longitudinal ligament has its osseous attachments. It is at these attachment sites that osteophytes develop from the anterior margins of the vertebral body. The osteophytes first extend anteriorly, growing in a subligamentous fashion and spanning the protruding disk. In severe cases complete osteophytic bridging is found. A distinction should be made from syndesmophytes, which in the typical case display ossification and enclose the region of the annulus fibrosus. They grow in a vertical direction. Calcifications Calcifications are a further form of degeneration of the capsule-ligament complex. They are found in all segments of the vertebral ligamentous system and are of clinical relevance, especially when they occur in the region of the posterior longitudinal ligament and the ligamenta flava. Their development is promoted by instability associated with abnormal range of joint motion and thus by an increased traction on capsule and ligaments. Because the ligaments contain abundant nerve fibers, these lesions can be the source of a considerable amount of pain in some cases (Resnick and Niwayama, 1988). Classification of Intervertebral Disk Degeneration Changes in the intervertebral disk have been further differentiated and classified by post-mortem MRI studies (Ho et al., 1988; Yu et al., 1988). Types of nucleus pulposus The MR image of the intervertebral disk of the neonate differs completely from that obtained in the juvenile and adult. On T1-weighted SE images the ossification center is demarcated and oval in shape. In the neonate it demonstrates slightly lower signal intensity than cartilage and intervertebral disk, though it becomes higher after a few weeks. There is no distinction between cartilage and the disk, which together display a structure of biconcave form with intermediate signal intensity. The annulus fibrosus too cannot be distinguished from the rest of the disk material, nor can the outermost fibers (Sharpey’s fibers). On PD-weighted images the ossification center appears relatively dark, while cartilage and disk are brighter, creating a contrast between these structures. Furthermore, disk and cartilage are demarcated on these images with the disk demonstrating the higher signal intensity and the cartilage appearing medium gray. On the T2-weighted image the ossification center appears very dark, the cartilage dark gray and the disk very bright. Sharpey’s fibers can be distinguished on T2-weighted images as a dark peripheral structure. The intervertebral disk appears very flat; the disk height is a maximum of 40 % of the vertebral body height (Figs. 4.1–4.4). Fig. 4.1a, b 14-day-old child: a PD-weighted image (SE; TR = 2100 ms, TE = 20 ms): The ossification center is oval in shape and dark. A mild, band-like signal enhancement is defined in part within the ossification center. The cartilage demonstrates intermediate gray signal intensity, while the intervertebral disk appears relatively bright. Cartilage and disk together give the impression of a biconcave structure. b T2-weighted image (SE; TR = 2100 ms, TE = 80 ms): On this image the bone appears black, the cartilage dark gray and the disk bright. The disk appears as a small linear structure. Fig. 4.2a, b 5-week-old child: a Sagittal T1-weighted section (TSE; TR = 1120 ms, TE = 12 ms): The bone appears dark but shows a small signal-intense center, which is depicted predominantly as a band-like structure. Cartilage and disk cannot be differentiated from each other, but form a biconcave structure with intermediate signal intensity. b T2-weighted image (TSE; TR = 6130 ms, TE = 120 ms): Bone and cartilage almost form a unit. The bone appears as a central core slightly darker against the dark-gray cartilage. The intervertebral disk appears signal-intense as a flat band. Sharpey’s fibers are delineated as black structures, as are the posterior and anterior longitudinal ligaments. The confluence point of the basivertebral vein is well shown dorsally, in the form of a wedge-shaped signal-intense structure in the middle of the vertebral body. Fig. 4.3 3-month-old child. (SE; TR = 650 ms, TE = 25 ms): The T1-weighted sagittal image now shows a slightly higher signal in the bone in comparison with the images in Figs. 4.1 and 4.2, while the bone has an oval configuration. Intervertebral disk and cartilage appear with almost the same signal intensity. These two structures cannot be differentiated from each other; they form a biconcave structure of intermediate signal intensity, not differing significantly from that of the bone. The bone demonstrates high signal intensity on T1-weighted images. The cartilage is well delineated as a dark gray stripe. The disk on the other hand appears bright. A differentiation between nucleus and annulus is not possible, whereas Sharpey’s fibers are delineated as a thin black line. On T2-weighted images the bone is medium gray, the cartilage very dark, the nucleus shows high signal intensity, annulus and Sharpey’s fibers demonstrate a clear reduction in signal. In the juvenile the structuring of the connective tissue of the nucleus begins with a band-like formation, which penetrates from a dorsal and ventral direction into the central core of the gelatinous tissue. The border between annulus and nucleus is sometimes rather ill defined. In addition, Sharpey’s fibers are well differentiated due to their particularly low signal intensity. The core of the intervertebral disk gains in height and shows a rounded form (Figs. 4.5–4.7). Fig. 4.4a, b 1-year-old child: a T1-weighted image (TSE; TR = 690 ms, TE = 12 ms): The vertebral body now demonstrates a higher signal intensity than the disk and cartilage. It has clearly gained in size. On the T1-weighted images the contour of the vertebral body is now already well differentiated with its almost rectangular form. Cartilage and disk are poorly differentiated; the cartilage shows lower signal intensity than the bone, as does the disk. b T2-weighted image (TSE; TR = 3500 ms, TE = 120 ms): Intermediate signal intensity of the bone, very low signal intensity of the cartilage and high signal intensity of the intervertebral disk. Sharpey’s fibers and annulus are demarcated as a black structure, both dorsally and ventrally. Fig. 4.5a, b 2-year-old child: a T1-weighted image (SE; TR = 660 ms, TE = 25 ms): The bone has gained in height and demonstrates a relatively high signal intensity. In contrast to Fig. 4.4, intervertebral disk and cartilage are now well differentiated. The cartilage appears dark gray; the disk shows moderately high signal intensity. Annulus and Sharpey’s fibers cannot be differentiated with certainty. b T2-weighted image (SE; TR = 2100 ms, TE = 80 ms): On this image there is a high signal intensity for the nucleus pulposus. Annulus and Sharpey’s fibers appear dark gray to black. The cartilage also demonstrates low signal intensity, appearing merely as a relatively thin band and only becoming slightly broader ventrally and dorsally. The bone reveals intermediate signal intensity. The entry points of the basivertebral veins are very well delineated as bright, rounded or wedge-like zones, each at the posterior margins of the vertebral bodies. Fig. 4.6a, b 7-year-old child: a Sagittal section using T1 weighting (TSE; TR = 800 ms, TE = 12 ms): Essentially no significant change has occurred from the images from the 2-year-old child. The bone demonstrates moderately high, relatively homogeneous signal intensity. The cartilage is shown as a somewhat inhomogeneous, signal-reduced, circumferential zone. The disk material reveals slightly higher signal intensity than the cartilage. Neither the annulus nor Sharpey’s fibers are sharply demarcated. b T2-weighted image (TSE; TR = 4000 ms, TE = 120 ms): Intermediate signal intensity of the bone. Very high signal intensity of the nucleus pulposus which now begins to gain in height and therefore assumes an oval, almost rounded configuration. The cartilage is demonstrated as a very thin, narrow, dark-gray to black band. Sharpey’s fibers and the annulus gain in thickness and show good delineation against the rest of the disk tissue because of their almost signal-free structure. Fig. 4.7 10-year-old child. T2-weighted image (SE; TR = 2100 ms, TE = 80 ms): The intervertebral disk gains further in height and the nucleus now appears demarcated with an ellipsoid form. In the distal lumbar spine it lies further anteriorly than in the proximal section of the spine. The annulus appears black. The caudal disks show initial horizontal stripes of connective tissue in the nucleus pulposus (arrows). In about one-fifth of cases the type III intervertebral disk already demonstrates tears in the annulus fibrosus (Yu et al., 1988). On T1-weighted images the bone appears relatively hypointense due to its high proportion of blood-forming marrow. The disk demonstrates high signal intensity. Differentiation between nucleus and annulus is not possible. Sharpey’s fibers can be delineated due to their lower signal intensity. On T2-weighted images bone signal intensity remains low. The nucleus pulposus appears hyperintense. The central connective-tissue structures have expanded and now appear as a largely continuous hypointense line within the nucleus pulposus. The annulus is well differentiated from the nucleus due to its low signal intensity (Fig. 4.8). Fig. 4.8a, b 27-year-old woman: a T1-weighted sagittal section (TSE; TR = 800 ms, TE = 12 ms): The vertebral bodies demonstrate an intermediate signal intensity. Only dorsally, at the level of the entry point of the basivertebral vein, is there slightly higher signal intensity. The intervertebral disk shows signal intensity similar to that of the bone, leaving a relatively poor contrast between the structures. The annulus is not distinct, while Sharpey’s fibers are demarcated as a thin black structure. b T2-weighted image (TSE; TR = 5300 ms, TE = 120 ms): The bone has a low signal intensity. The intervertebral disk allows a good differentiation between nucleus and annulus. the horizontal stripes of connective tissue in the nucleus pulposus are continuous and appear very bold in part, which is typical for this age, and these changes have clearly increased in comparison with Fig. 4.7. The annulus and Sharpey’s fibers appear normal, demonstrating respectively a low or absent signal. The posterior longitudinal ligament is not distinguishable in its course from the annulus. With type IV there is an evenly distributed reduction in signal from the intervertebral disk and usually a distinct reduction in height too. The nucleus pulposus can no longer be differentiated from the annulus fibrosus by signal intensity due to the dense connective tissue that is interspersed with the nucleus. Histologically, there is always a rupture of the annulus fibrosus present in these disks. A subchondral bony reaction in the adjacent vertebral body end plates is also typical, displaying a corresponding reduction in signal in the T1- and especially in the T2-weighted images (Fig. 4.9). Fig. 4.9a, b 61-year-old woman: a T1-weighted sagittal section (TSE; TR = 800 ms, TE = 12 ms): These images display a distinctly higher signal intensity in the bone in comparison with the intervertebral disk, in contrast to Fig. 4.8a. This results from the involution of the blood-forming bone marrow and its replacement by fatty bone marrow. The entry points of the basivertebral veins now make a hypointense impression. The bone marrow shows somewhat patchy signal intensity. The intervertebral disks have slightly lost height in total. The signal intensity of the disks is also becoming hypointense in the T1-weighted image as compared with Fig. 4.8a, recognizable from the low contrast between the CSF and disk signal. The annulus is poorly demarcated. b T2-weighted sagittal section (TSE; TR = 5300 ms, TE = 120 ms): The vertebral bodies display an intermediate signal intensity, although a slightly higher signal can be seen at the level of the veins entering dorsally. The patchy delineation of the bone marrow is also conspicuous on this image. Overall the disks display an advanced stage of degenerative remodeling or a process of ageing and therefore show largely homogeneous signal attenuation. There are solitary signal enhancements in the region of the annulus, particularly in last three disks, which are signs of tears. Slight protrusions are present, although there is no distinction between annulus and nucleus. Fig. 4.10 Normal finding of the intervertebral disk. T2-weighted transverse section (TSE; TR = 4465 ms, TE = 120 ms): Circumferential fibrous ring of the intervertebral disk, dark in appearance and looking completely intact in all sections. The nucleus pulposus is hyperintense and forms the core of the disk. Types of Annular Tears Fig. 4.10 demonstrates the normal appearance of an intervertebral disk. The changes of the annulus have been classified with the aid of post mortem studies. Annular tears can be subdivided into four different types with regard to their form and location (Fig. 4.11) (Yu et al., 1989). Types of annular tears A concentric tear results from disruption of the short transverse fibers connecting adjacent lamellae, but there is no interruption of the longitudinal fibers within the lamellae themselves. The tear extends vertically and lies within the transverse fibers of the annulus, although there is no connection with the nucleus pulposus. It frequently has an oval configuration (Fig. 4.12). Fig. 4.11a—e Types of tear: a Normal finding. AF = Annulus fibrosus, NP = Nucleus pulposus b Concentric tear. c Transverse tear. d Radial tear. e Complete tear of the annulus fibrosus and the posterior longitudinal ligament. Histologically, fluid or a mucoid tissue is found is this fissure. Since the intradiskal regions are not supplied with nerve fibers, this type of tear is not painful. It is therefore of no distinct clinical significance and is also seen without intervertebral disk degeneration. A concentric tear can, however, develop into a radial tear. Histologically it is frequently located in the ventral part of the annulus. Usually the ventral tear is not detectable by MRI (Nowicki et al., 1997). The transverse tear is found in the outermost fibers of the annulus (Sharpey’s fibers) near the marginal contour of the vertebral body. This type of tear is only found in the adult disk (type III) and in disks with degenerative changes (type IV). However, it is uncertain whether the tear should be regarded as the starting point of disk degeneration. It is assumed that the tear arises secondary to a particularly pronounced torsion involving the spine and disk tissue. These tears are depicted as transverse structures within the upper or lower parts of Sharpey’s fibers, they contain mucoid material and sometimes even nitrogen oxide. Pain can develop from a transverse tear. Since it can be well defined by MRI on T2-weighted images as a bright zone, it should also be taken into consideration when assessing intervertebral disks (Fig. 4.13). After contrast administration, enhancement within the tear may appear as an expression of granulation tissue formation (Fig. 4.14). Fig. 4.12a, b Vertical tear (concentric tear): a Transverse image (TSE; TR = 4470 ms, TE = 120 ms): Signal enhancement within the outer transverse fibers of the annulus in the immediate vicinity of the posterior longitudinal ligament. This signal enhancement has no connection with the nucleus pulposus. b Sagittal section displaying the vertical tear. Here too, there is no recognizable connection with the nucleus. Fig. 4.13 Transverse tear in the penultimate disk. There is also a vertical tear in the last disk. The sagittal T2-weighted image (TSE; TR = 4000 ms, TE = 120 ms) shows the small transverse tear near the marginal contour of the vertebral body in the lower part of Sharpey’s fibers. The last disk displays a large vertical tear in the outermost parts of the fibrous ring. This type of tear is only seen in the degenerative disk (type IV). It represents fissures, which extend from the central parts of the nucleus pulposus to the periphery of the disk and are associated with a significant disruption of the integrity of the annulus fibrosus. A high percentage of disk protrusions with an expansion of only a few millimeters will already show such radial tears of the annulus (Yu et al., 1988). It is therefore a misconception that disk protrusions are associated with an intact annulus. Radial tears are subject to a remodeling process, which takes on the character of a repair mechanism. Fibrovascular granulation tissue is formed that invades the fissures and can also develop along the annulus fibrosus (Yu et al., 1988). Radial tears are the cause of pain (so-called diskogenic pain). On T2-weighted images the radial tear displays high signal intensity within the annulus. Any granulation tissue possibly situated within this tear can contribute to the linear or globular appearance of a zone of contrast enhancement within the annulus fibrosus (Figs. 4.15–4.17) (Ross et al., 1990). Fig. 4.14 Depiction of granulation tissue enhanced by contrast medium. Sagittal section after administration of contrast (SE; TR = 780 ms, TE = 25 ms): Signal enhancement at the attachments of Sharpey’s fibers on the posterior border of L3 and L4 as a sign of the tear undergoing reparative remodeling. Fig.4.15a—d Radial tear: a T2-weighted transverse image (TSE; TR = 4850 ms, TE = 120 ms): Oblique radial tear with subligamentous extension. b Image immediately cranial to a. On this image the radial tear merges into a vertical slit-like tear. c, d Sagittal sections (TSE; TR = 5300 ms, TE = 120 ms) of a 29-year-old patient revealing a radial tear in the annulus at the level of L5/S1. a Fine radial tear running diagonally through the dorsal part of the annulus fibrosus and displaying a high signal intensity (TSE; TR = 4800 ms, TE = 120 ms). b Caudal to a. Fig. 4.17a, b Tears of the annulus fibrosus Sharpey’s fibers: a Signal enhancement in the annulus and Sharpey’s fibers on the T2-weighted image at L4 (arrows) as a sign of a tear (SE; TR = 2100 ms, TE = 80 ms): Complete radial disruption of the annulus at L5 with subligamentous herniation of the nucleus. b Signal enhancement in the annulus at L4 as a sign of a broad tear (SE; TR = 2100 ms, TE = 80 ms). This is a broad disruption of the annulus, usually associated with disk protrusion. As a result, more pronounced lumbago- or sciatic-type clinical symptoms are found (Fig. 4.18) Fig.4.18a—d Complete tear of the L4/L5 annulus involving the posterior longitudinal ligament: a T2-weighted sagittal image (TSE; TR = 3400 ms, TE = 120 ms): Broad annular tear with a large disk herniation displaced far caudally. On this image the posterior longitudinal ligament appears intact. The L3/L4 disk displays a small transverse tear near the contour of the posterior vertebral margin. b T1-weighted sagittal image slightly off midline towards the left (TSE; TR = 800 ms, TE = 12 ms): On this image the wide annular tear is visible with an associated rupture of the posterior longitudinal ligament. The disk herniation extends far caudally resulting in a distinct compression of the dural sac. d Transverse images with different window settings (TSE; TR = 5785 ms, TE = 120 ms): The wide tear runs obliquely in the region of the annulus and appears less rich in contrast using the standard window setting (c) than in the bone-windowed image (arrow) (d). Contrast Enhancement Patterns of the Unoperated Intervertebral Disk, the Intraspinal Structures and the Vertebral Joints In a systematic analysis, Geum-Ju Hwang et al. (1997) examined the contrast enhancement patterns of the degenerative intervertebral disk. Contrast enhancement displayed a particularly linear pattern along the posterior aspect of the annulus fibrosus and the bulging disk, less often a nodular pattern in the dorsal components of the disk. Apart from intradiskal contrast enhancement, nodular peridiskal enhancement is also seen, albeit less frequently (Fig. 4.19). The frequency of a contrast-enhancement effect around the annulus fibrosus correlates with the degree of disk damage. Normal disks were enhanced in only 20 % of cases, bulging disks and protrusions in 55–95 % of cases, and sequestered disks with a sequestered herniation displayed peridiskal enhancement in all cases, with involvement of the sequester being an expression of the formation of granulation tissue. Zones of increased signal intensity (consistent with a concentric, transverse or radial tear) displayed a higher percentage of contrast enhancements as compared with disks without zones of increased signal intensity. Granulation tissue formation usually corresponds histologically to the region of contrast enhancement (Figs. 4.20–4.22). Fig. 4.19 Diagram of enhancement patterns within the lumbar disk. The administration of contrast material can lead to reactions along the course of the nerve root (Jinkins et al., 1993). In 25 % of patients with radicular symptoms there is nerve root enhancement after administration of contrast material without there having been any previous surgery. This enhancement pattern can be followed from an intra- to an extradural location and corresponds to the course of the nerve root. Whether it is an inflammatory irritation of the nerve root with a corresponding pial reaction or contrast enhancement of radicular veins remains a controversial issue. Fig.4.20a, b Linear intradiskal contrast enhancement. Transverse images of the L3/L4 disk after application of contrast material (SE; TR = 750 ms, TE = 25 ms): There is a distinct linear contrast enhancement along the annulus fibrosus (arrow), involving not only the parts toward the spinal canal but also the more peripheral sections. Fig. 4.21 a, b Nodular contrast enhancement: a T2-weighted image of the L3/L4 disk (TSE; TR = 4465 ms, TE = 120 ms): Broad radial tear with a corresponding signal enhancement along the annulus. b T1-weighted image with fat saturation after application of contrast material (SE; TR = 540 ms, TE = 20 ms): There is nodular, very strong contrast enhancement along the wide annular tear. Fig. 4.22 a—c Peridiskal contrast enhancement with a large disk herniation: a Sagittal section after administration of contrast material (TSE; TR = 921 ms, TE = 12 ms): Large disk herniation at the level of L4/L5 resulting in extensive compression of the dural sac. There is peridiskal, marginal signal enhancement. b Transverse T2-weighted image of the disk herniation (TSE; TR = 6600 ms, TE = 120 ms): The large left mediolateral disk herniation displays marked compression of the dural sac. c Image after administration of contrast material (TSE with fat saturation; TR = 539 ms, TE = 20 ms): The disk herniation shows an apparently circumferential, peridiskal contrast enhancement. The part of the disk herniation projecting cranially appears in cross-section. The ventral section of the herniation is also surrounded by contrast material, as shown in a. Furthermore, there is relatively diffuse contrast enhancement along the annulus. In addition, there is distinct periarticular contrast enhancement, most notably along the right vertebral joint as an expression of an inflammatory reaction in the form of an activated osteoarthrosis. Radicular veins are responsible for the drainage of venous blood from the conus medullaris and cauda equina into the epidural venous plexus. In doing so, these veins course in either a superior or inferior direction, depending on the level of the segment. At the L2 level, or above, drainage of the venous plexus proceeds into lumbar veins, which in turn reach the inferior cava vein or ascend to the azygos/hemiazygos vein. Below L2 there is a descending course, with radicular and foraminal veins draining into the iliolumbar veins from which, in turn, there is a connection with the common iliac veins. Radicular veins are present in the cauda equina in varying degrees. They can attain a diameter of 0.5–1.2 mm. Veins of this size are found primarily in the lower thoracic and upper lumbar region. In about one-quarter of all cases veins of this caliber are also found more distally and course along the filum terminale or one of the lumbosacral nerve roots (Fig. 4.23). Fig. 4.23a—i Radicular vein coursing along the filum terminale (arrows): a Non-contrast scan of the spinal canal with fat saturation (SE; TR = 931 ms, TE = 20 ms): Flow-related enhancement in a radicular vein at the level of the filum terminale. b The same slice, image after application of contrast material: The vein displays a slight increase in signal intensity. c Slice 8mm lower: On this image the vein shows loss of signal. d Image after application of contrast material: Enhancement of the radicular vein. e Image 1.2 cm further caudally: Here the radicular vein also displays slight signal loss, it lies somewhat further ventrally. f Here too, clear enhancement after application of contrast material. In addition, a dorsal radicular vein also demonstrates circumscribed enhancement. g Another case with evidence of a larger radicular vein on the right side along the course of the L4 nerve root. Image after contrast material application (previously operated patient) with clear enhancement along the spinal process of the left side (SE with fat saturation; TR = 930 ms, TE = 20 ms). On the right, there is a strongly enhanced vein at the level of the L4 root. h Slice 4 mm caudal to a: This vein courses towards the intervertebral foramen. On this image there is also a second, small, contrast-enhancing structure recognizable in the vicinity. Considering its size, it is presumably a collecting vein. i Transverse image after application of contrast material (SE with fat saturation; TR = 686 ms, TE = 20 ms): On this image many small radicular veins are recognizable displaying a corresponding contrast enhancement. Enhancement of these veins by MRI depends primarily on contrast uptake by the larger radicular veins, although admittedly the limited resolving power of MRI does not allow a differentiation between vein and nerve root. In individual cases a flow-related increase of signal intensity in the vein is recognizable on transverse sections, applying above all to the first slice of a non-contrast axial T1-weighted SE sequence. The subsequent slices can demonstrate a reduction in signal (Fig. 4.23). A preceding saturation pulse can suppress the signal. The contrast-enhancing veins can be readily traced in a proximal direction on the transverse slices as far as their confluence with the larger radiculomedullary veins. This enhancement pattern is also seen in cases where asymptomatic patients have been examined. Should root compression subsequently occur, this will lead to impairment of venous drainage, and consequently to venous stasis, with the result that even small veins that are not normally visible will also demonstrate enhancement (Fig. 4.24). These small veins do not usually allow detection of any flow-related enhancement either. The enhancement resolves after removal of the cause of the compression, e.g. within 6 months after surgery. Nor are these small vessels detectable by MR angiography, although larger radicular veins can be portrayed in individual cases during MR angiography. In a study involving 227 patients presenting with low back pain or sciatica or both, Tyrrell et al., (1998) reach the conclusion that nerve root enhancement with disk-caused compression of the nerve-root correlates in a high percentage of cases. The sensitivity for nerve root enhancement in the presence of disk prolapse is reported to be 23.5 % with a specificity of 95.5 %, which amounts to a positive predictive value of 76 % and a negative predictive value of 69.3 %. In the presence of degenerative changes in the vertebral joints, marked effects of contrast enhancement can arise. Plain views will reveal the spondylarthrotic joints secondary to bony hypertrophy of the facets, disrelationship of the joint facets to one another even to the point of subluxation, and in individual cases joint-space widening and increased intra-articular accumulation of fluid. The capsule can be thickened. Clear enhancement of periarticular soft tissues, the facet joint and also of the bone can at times be seen after contrast application. Images with fat saturation are suited for the exact assessment of the effect of contrast enhancement (Figs. 4.25, 4.103, 4.106–4.108). a T2-weighted transverse image (TSE; TR = 4500 ms, TE = 120 ms): The image shows the herniated disk with corresponding compression of the nerve root on the left in the immediate vicinity of the foramen. b Slice 4mm caudal to a: The expansion of the herniated disk on this slice is greater mid-laterally on the left. There is clear dorsal displacement and compression of the nerve root exiting on the left. c, d Corresponding slices to a and b after contrast administration (SE with fat saturation, TR = 930 ms, TE = 20 ms): Strong, in part very linear, enhancement at the level of the nerve root exiting on the left. A secondary finding of a clear enhancement in the vertebral joint on the right is also recognizable. The clinical relevance of this contrast enhancement is not clear. It is possibly connected with the presence of a pseudoradicular syndrome. Fig. 4.25a—d Marked degenerative changes of the vertebral joints: a T2-weighted slice at the level of L4/L5 (TSE; TR = 5500 ms, TE = 120 ms): Conspicuous facet hypertrophy on the right, mild narrowing of the spinal canal from the right. b Image with fat saturation after contrast application (TSE; TR = 930 ms, TE = 20 ms): Clear periarticular enhancement of the soft tissue and capsule on the right side. c Slice 8mm caudal to a: Clear sclerotic reaction of the inferior articular surface on the right side. d Corresponding slice 8mm caudal to b: Apart from a periarticular enhancement of the soft tissues, there is an additional enhancement of the bone at the level of the pedicle on the right. Degenerative Changes of the Vertebral Body End Plates Degenerative changes of the intervertebral disks often appear on MRI together with signal alterations of the bone marrow of the adjacent vertebral bodies. On MRI three types can be distinguished (Modic et al., 1988): Type I is the combination of low signal intensity on the T1-weighted image with high signal intensity on the T2-weighted image. Edema and, in most cases, the formation of fibrovascular tissue within the bone in conjunction with a subsequent replacement of the bone marrow underlie this finding. A more or less pronounced trabecular thickening is also found (Fig. 4.26). Plain radiographs will often reveal no signs of bony changes (Fig. 4.27). In addition, this type is also found on MRI in the presence of radiologically detectable sclerosis of the vertebral body, in which case the signal enhancement on the T2-weighted image can be less pronounced and is at times found at the junctional region between sclerosed and normal bone. Hemispherical spondylosclerosis can also present changes of this type on MRI (Jensen et al., 1989; Fig. 4.28). Some authors have also implicated type I changes of the vertebral bodies with segmental instability. These signal changes have therefore been demonstrated in the presence of an unstable spondylodesis, while type II signal changes have been displayed in stable cases (Lang et al.,987). Type I MRI signal changes can develop into type II. Such signal changes can also be seen after disk surgery involving generous clearance of the interspace, possibly as a result of a postoperative segment instability, yet without there having been similar findings before surgery. They are probably the expression of an edematous (non-inflammatory) reaction of the bone and are therefore reversible (Fig. 4.29). Fig.4.26a—e Type I reactive bone marrow changes: a T2-weighted sagittal section (TSE; TR = 3635 ms, TE = 120 ms): Wide signal-intense zone along the inferior and superior end plates of L4 and L5 in the presence of marked disk degeneration with osteochondrotic alterations. b T1-weighted image (TSE; TR = 800 ms, TE = 12 ms): Altogether there is a relatively low signal intensity of the bone marrow. Additional reduction in signal is found subchondrally at L4/L5, corresponding to the signal enhancement on the T2 weighting. c Another patient with a type I reactive bone marrow change. T1-weighted sagittal image (TSE; TR = 800 ms, TE = 12 ms): Clear subchondral reduction in signal in the L4/L5 region; the disk itself shows a slight loss of height. d T2-weighted image (TSE; TR = 5300 ms, TE = 120 ms): Signal enhancement corresponding to the changes in Fig c. The disk shows a relatively high signal, loss of height and frank protrusion. This patient had undergone left-sided surgery of the L4/L5 disk. e Post contrast image: Clear enhancement of the subchondral vertebral-body sections of L4 and L5. In addition there is contrast enhancement recognizable in the dorsal part of the disk consistent with granulation-tissue formation in this section. Fig. 4.27a—d Type I reactive bone marrow changes in a 77-year-old female patient who had undergone an extensive laminectomy of L3–L5: a The lateral radiograph demonstrates severe sclerosis with concomitant erosive osteochondrosis at the level of L3/L4 and slightly less marked at L2/L3. L1/L2 reveals disk degeneration with a vacuum phenomenon, alongside of which there is anterior spondylosis. There is no unequivocal finding in the vicinity of the inferior and superior end plates. b T2-weighted sagittal image (STIR): Marked subchondral edema formation at L1/L2. Concomitant evidence of frank disk degeneration and protrusion. c T1-weighted image (TSE; TR = 800 ms, TE = 12 ms) with reduction in signal. d Corresponding subchondral signal enhancement with T2 weighting. Fig. 4.29a, b Spondylolisthesis at L3/L4 with instability in this segment. Type I change of the vertebral bodies: a PD-weighted image (SE; TR = 2100 ms, TE = 20 ms): Reduction in signal of the bone marrow of L3 and L4. Extensive disk deterioration with severe loss of height. b T2-weighted image (SE; TR = 2100 ms, TE = 80 ms): Clear signal enhancement of the bone marrow of L3 and L4 consistent with edema. A clear signal enhancement on the T1-weighted image and a mild signal enhancement on the T2-weighted image are seen with the type II signal change. Histologically, transformation of the blood-forming bone marrow into fat marrow is noted, often accompanied by trabecular thickening. This finding is not usually detectable on plain x-rays. Type II possibly precedes an osteochondrosis of the bone, which appears later on plain x-rays (Figs. 4.30–4.32). Fig. 4.30a, b Fatty marrow degeneration (type II change of the vertebral-body end plates): a T1-weighted sagittal image (TSE; TR = 800 ms, TE = 12 ms): Subchondral signal enhancement along L5 and S1 in the presence of disk degeneration. b T2-weighted image (TSE; TR = 3635 ms, TE = 120 ms): The signal is enhanced against the other bone-marrow areas in the region of L5 and S1 due to fatty marrow. Concomitant evidence of a subligamentous disk herniation that has migrated cranially at the L2/L3 level, with a similar disk herniation at L3/L4. Protrusion with annulus tear at L4/L5. Fig. 4.31 a, b Type II changes of the vertebral-body end plates at the level of T10/11: a T1-weighted sagittal image (TSE; TR = 800 ms, TE = 12 ms): Clear subchondral signal enhancement of the vertebral bodies projecting far dorsally with concomitant, extensive disk deterioration. b T2-weighted sagittal image (TSE; TR = 3635 ms, TE = 120 ms): Using T2 weighting, considerable signal enhancement is also evident in this segment. Fig. 4.32a, b Degeneration of fatty marrow in the region of the cervical spine at the level of C6/C7: a T2-weighted image (TSE; TR = 5300 ms, TE = 112 ms): Clear subchondral signal enhancement in the region of C6 and C7. Concomitant disk degeneration in this segment with protrusion and loss of disk height. The signal enhancement of the disk corresponds to loosely packed calcium deposits. b GRE sequence using T1 weighting (TR = 90 ms, TE = 403 ms, flip angle α = 11°) with signs of clear reduction in signal of the subchondral bone. This type shows low signal intensity both on T1- and T2-weighted images and corresponds to a dense sclerosis of the vertebral body. A corresponding finding of sclerosis can also be detected on plain radiographs (Fig. 4.33). Fig. 4.33a—c Type III change of the vertebral bodies in the presence of hemispherical spondylosclerosis at the level of L3/L4: a Lateral radiograph of the lumbar spine with marked subchondral sclerosis of L3 and L4. Severe disk degeneration, erosive changes of the inferior and superior end plates. Marked spondylosis. b T2-weighted sagittal MR image (TSE; TR = 3600 ms, TE = 120 ms): Reduction in signal in the region of L3 and L4 consistent with spondylosclerosis. c T1-weighted image (TSE; TR = 800 ms, TE = 12 ms): The largely homogeneous reduction in signal with segmental degeneration in the periphery of the fatty marrow of the vertebral bodies can also be seen on this image. Toyone et al. (1994) classify bone-marrow alterations solely according to T1-weighted images and differentiate between: • Type A with decreased signal intensities on T1-weighted SE images, • Type B with increased signal intensities. The authors reach the conclusion that a high percentage of patients in group A present clinical symptoms of low back pain, while only a small proportion of patients in group B have clinical findings. Classification of Intervertebral Disk Herniation There are a great many classifications of intervertebral disk herniations with no common central concept to be found either in the radiological literature or among radiologists, neurosurgeons and orthopedic surgeons. Classification of intervertebral disk herniation is often reduced to the question of whether or not the finding “merits surgery,” thus prompting radiologists to incorrectly interpret “prolapse” as meriting surgery and “protrusion” as not meriting surgery. The terms that have been adopted in the fields of CT and myelography do, indeed, go beyond what the radiologist can actually observe. In fact, the distinction of a prolapse from a protrusion requires delineation of the nucleus from the annulus, which is not possible using myelography or CT. In the literature a protrusion is usually defined as an eccentric displacement of disk material in which the fibers of the annulus fibrosus are still essentially intact. Histological studies have shown that this is sometimes incorrect (Yu et al., 1988), but the definition implies that nucleus pulposus material has not extruded through the annulus fibrosus. A special form of protrusion is “bulging” of the intervertebral disk, which has been particularly emphasized in the English literature. It involves a uniform, circumferential thinning of the annulus with a dorsal displacement of the nucleus pulposus. Prolapse on the other hand is defined as a protrusion of the nucleus pulposus through the fibers of the annulus, involving a more or less extensive disruption of the annular fibers. A distinction can be made between a prolapse of nucleus pulposus tissue, which is still subligamentous in location and a prolapse that is already extraligamentous in location but is still in continuity with disk material (extraligamentous prolapse). In contrast, the extraligamentous sequester has lost contact with the disk material and is epidural in location or, in extremely rare cases, intradural (intradural sequester) (Fig. 4.34). Sometimes the literature will refer to a sequester if the disk herniation is already extraligamentous in location but still maintains connection with the nucleus pulposus (Modic et al., 1989). Computer tomography is unable to outline the posterior longitudinal ligament, and similarly there is no possibility of assessing the annulus fibrosus fibers. In this respect, attempts at distinguishing between protrusion and prolapse by CT are often not borne out by intraoperative observations. Radiological differentiation is based primarily on the form of the disk herniation: Fig.4.34a—g Various forms of intraspinal disk displacement: a Normal disk. b Bulging. c Annular tear. d Protrusion. e Subligamentous disk herniation. f Transligamentous disk herniation. • a protrusion is assumed if there is a uniform, broad-based dorsal displacement of disk material, • a prolapse is assumed if there is a tongue-shaped displacement. Studies have however shown that this differentiation contains a high margin of error (Haughton et al., 1982). MRI has the advantage over CT in as much as the annulus together with the posterior longitudinal ligament can be distinguished from the nucleus pulposus. With the exception of diskography, MRI allows a better differentiation between protrusion and prolapse in this respect than is the case with the other imaging techniques. Examination Technique MRI is being used increasingly for the examination of disk herniations. The option of obtaining a complete overview of a larger portion of the spine using sagittal sections is one of its advantages over CT. The images are richer in contrast, especially when delineating the disk from the surrounding structures. MRI allows assessment of the state of the nucleus pulposus and can detect incipient disk degenerations. The option of obtaining images in two planes allows a better assessment of the spinal canal and, in particular, of the foramina. MRI combines the clarity of myelography with the option of directly imaging the herniated disk. The choice of sequence will depend on the region to be examined: In the lumbar region, mainly T1- and T2-weighted SE sequences should be used. A T1-weighted sagittal TSE sequence, a T2-weighted sagittal TSE sequence and a T2-weighted transverse TSE sequence are recommended as basic examination techniques. T1-weighted images. The T1-weighted sagittal SE sequence provides a good anatomical overview of the individual structures, although it does not provide for optimal contrast between disk tissue, dural sac and, in particular, the nerve roots. In this setting, bone marrow demonstrates intermediate signal intensity, depending on the age of the patient, with younger patients displaying a somewhat lower signal intensity due to a higher proportion of blood-forming marrow than older patients with a high proportion of fatty marrow. The contrast between bone-marrow signal and disk signal is usually only slight, with the age of the patient again playing an important role in the differentiation. In the young patient the bone-marrow signal equates approximately to that of the disk, while in old age the bone-marrow signal is higher. The vertebral cortex is sharply defined as a thin dark peripheral margin, although the cortex can display a less sharp delineation in the direction of the readout gradient than in the direction of the phase-encoding gradient because of the chemical-shift artifact. The following therefore applies: if the phase-encoding gradient is switched in the craniocaudal direction, then an exact demarcation of the cortex along the contour of the posterior vertebral margin will be absent; conversely, if the phase-encoding gradient is switched in the AP direction, there will be a shift in the area of the cranial and caudal vertebral-body contour, e.g. with enhancement of the superior vertebral end plate and an ill-defined, reduced presentation of the inferior vertebral end plate (Fig. 4.35). The intervertebral disk appears largely homogeneous, making differentiation between annulus and nucleus impossible. Sharpey’s fibers, on the other hand, reveal a reduction in signal, although there is no delineation with respect to signal intensity between these fibers and the posterior longitudinal ligament. Fig.4.35a—d Influencing the chemical-shift artifact by altering the phase-encoding gradient: a Sagittal section using T1 weighting (TSE; TR = 800 ms, TE = 18 ms). Phase-encoding gradient switched in the craniocaudal direction: marked chemical-shift artifact in the dorsal direction. The posterior and the anterior peripheral margins of the vertebral bodies display a distinct double contour, resulting in an ill-defined delineation of the marginal strips (bandwidth: 78 Hz/pixel; one acquisition). b Switching the phase-encoding gradient in the craniocaudal direction can give rather good image results if a not too narrow bandwidth is used (bandwidth: 195 Hz/pixel). Note the artifact-free reconstruction of the spinal canal on this image. The chemical-shift artifact along the posterior and anterior margins of the vertebral bodies is acceptable and does not impair assessment of the disks or the marginal contours of the vertebral bodies (same patient as in a). Admittedly, raising the bandwidth does increase image noise (S/N is proportional to BW-1/2), but this can be compensated for, e.g. by a larger number of acquisitions. For this reason, c was generated with three acquisitions. c Switching the phase-encoding gradient in the AP direction: the chemical-shift artifact now appears in the region of the inferior and superior end plates. The typical double contouring is recognizable in the area of the superior end plate. The inferior end plate appears widened. At the same time, the sometimes-disturbing motion artifacts now appear on the image as vertical lines, which contribute to a loss of detail at the boundary between cauda and spinal cord. Low bandwidth. d Same slice as in c, merely with doubling of the bandwidth and unchanged number of acquisitions: clearly increased image noise, fewer chemical-shift artifacts. The images are not suitable for assessing intramedullary lesions. Spinal cord edema is only rarely distinguishable. Disk protrusion or prolapse is usually poorly defined against the spinal canal because CSF only appears slightly dark in comparison with disk tissue. T2-weighted images. Bone marrow appears dark on T2-weighted images, while the disk is displayed bright or even dark, depending on the age of the patient. Annulus and nucleus are well-defined in the younger patient, but this delineation gradually disappears with degenerative remodeling of disk tissue, which becomes increasingly apparent with age. Nerve roots are usually well recognizable as thin black lines. Since CSF appears bright, there is high contrast between disk tissue and CSF (Fig. 4.36). A T2-weighted TSE-image can by all means be obtained using a high turbo factor in order to achieve a contrast similar to that of myelography between disk tissue, CSF and nerve fibers. There is, in addition, sufficient differentiation between disk tissue and bone to allow a good distinction between fresh and older disk herniations with reactive bony bridging. Axial T2-weighted images allow a particularly good differentiation of the nerve roots owing to the high signal intensity in CSF (Fig. 4.37). They are also suitable for assessing arachnoid adhesions, thickenings of the nerve root, and inflammatory alterations of the nerve root. An inflammatory reaction will display thickening and signal enhancement of the nerve root. Both the sagittal and the axial images allow a differentiation of annular tears, which usually appear signal-intense. Fig. 4.36a, b Normal finding of the lumbar spine in a 25-year-old female patient: a T1-weighted sagittal section (TSE; TR = 800 ms, TE = 12 ms): This image provides a good overview of the anatomical structures. Relatively poor differentiation of the nerve roots along the cauda equina. The contrast between disk and dural sac is not good either. The bone-marrow signal in this young patient is low and differs little from the signal of the disk. Only dorsally, at the level of the exit points of the basivertebral veins, is there slightly higher signal intensity in the bone marrow. The disk displays intermediate signal intensity, while differentiation between nucleus and annulus is not possible. Only Sharpey’s fibers are delineated dorsally as thin black lines. Differentiation of these structures from the longitudinal ligament is not possible. Good visualization of the conus medullaris. b T2-weighted sagittal section (TSE; TR = 5200 ms, TE = 120 ms): There is good differentiation of the cauda equina and individual nerve roots. The bone marrow displays a dark signal. Hence the disk is well demarcated, above all toward the nucleus. Nucleus and annulus are well differentiated. The annulus in this case is of normal thickness and shows no tears. There is high contrast between disk tissue and CSF. Fig. 4.37 Normal finding of the lumbar spine with axial slice orientation. Axial T2-weighted image of the lumbar canal at the level of L2/L3 (TSE; TR = 4465 ms, TE = 120 ms): The nerve roots appear dark and are well delineated due to the bright CSF signal. Anteriorly the posterior and anterior roots are each demarcated on the right and left. Both structures are situated at the level of their points of exit from the spinal canal. Conclusion. T1- and T2-weighted images are usually sufficient for assessing bone-marrow changes (types I–III). If a particularly high-contrast reproduction of bone-marrow edema is required, T2-weighting with additional fat saturation or, alternatively, the use of a STIR sequence is useful. It may be wise to supplement routinely used sequences with a T1-weighted GRE sequence if a particularly high-contrast differentiation between disk tissue and bony structures is required. This may be necessary in particular cases in order to highlight dorsal osteophytes, which is more successful with the GRE sequence than with the SE sequence. In doing so, these images should also be obtained using a sagittal slice orientation. The application of a contrast agent for diagnostic confirmation, particularly in cases of degenerative changes of the lumbar spine, is not usually necessary. Contrast administration can, however, be considered in particular cases in order, for example, to differentiate a sequester from a tumor if the sequester has lost contact with the parent disk and therefore presents differential-diagnostic problems. In this respect it should not be overlooked that even old disk herniations can display peripheral enhancement due to scar-tissue formation. If the demonstration of even mild enhancements is required, then fat-saturated T1-weighted images using an SE or GRE technique are recommended. In individual cases, subtraction of a plain from a contrast-assisted sequence may be useful, provided exactly identical examination parameters have been used. Both SE and GRE sequences are suitable for the thoracic region. T1-weighted images. As in the lumbar region, T1-weighted images do not allow an exact assessment of pathological intramedullary processes, unless they are space occupying or exhibit syringomyelic changes. Particularly a myelon edema secondary to compression of the spinal cord (e.g. due to a large disk herniation) is usually not assessable using a T1-weighted examination technique. The images do, however, show a sufficiently good contrast between bone and CSF, which appears dark, as well as the spinal cord, which displays light gray signal intensity. Even disk herniations are already definable on these T1-weighted images. T2-weighted images. The T2-weighted GRE sequence is also suitable for detecting disk herniations since there is a high contrast between CSF and disk tissue. Alternatively, T2-weighted TSE sequences can be used, although here CSF flow artifacts are more strongly marked, which can make evaluation of the intradural space considerably more difficult in individual cases. The use of both techniques, i.e. a T2-weighted TSE technique together with a T2-weighted GRE technique, may be necessary in particular cases to provide more reliable information. Both TSE and GRE sequences may be considered for transverse images, with T2-weighted sequences being particularly useful (Fig. 4.38). Fig.4.38a—g Normal finding of the thoracic spine: a T2-weighted sagittal image (TSE; TR = 4800 ms, TE = 120 ms), phase-encoding gradient switched in the AP direction: The image displays a high signal intensity of the nucleus pulposus, allowing a good distinction between annulus and nucleus. The vertebral bodies show intermediate signal intensity. There is good differentiation between myelon and CSF. The image shows artifacts in the form of stripes resulting from breath excursions. b Same patient as in a. T2-weighted sagittal image with phase-encoding gradient switched over to the craniocaudal direction (TSE; TR = 3400 ms, TE = 120 ms): The spine and the spinal canal are displayed without artifacts on this image. Truncation artifacts now appear in the region of the vertebral bodies with corresponding multiple horizontal hyper- and hypointense lines due to the switching of the phase-encoding gradient. There is also a good distinction on this image between nucleus and annulus. Chemical shift artifact in the AP direction, although there is a good delineation of the posterior margin. Artifact-free presentation of the spinal canal with good contrast between CSF and myelon. The myelon demonstrates homogeneous signal intensity. The image displays fewer CSF artifacts than in a. c T2-weighted FLASH (TR = 714 ms, TE = 22 ms, flip angle α = 35°). Phase-encoding gradient switched in the AP direction: Artifacts very strongly interfering with the image, with not only motion artifacts but above all flow artifacts spoiling image quality. Very dark signal from the vertebral bodies. High signal intensity in the individual disks resulting in good contrast between these structures. The annulus is delineated as a very thin black structure, dorsally and ventrally. The contrast between CSF and myelon is poorer than on the SE images. Marked truncation artifact along the myelon. d T2-weighted FLASH (TR = 714 ms, TE = 22 ms, flip angle α = 35°). Phase-encoding gradient switched in the craniocaudal direction: This image displays far fewer artifacts along the spine. The vertebral bodies are more easily delineated in this respect. The spinal canal is also more readily assessable along its entire course. The contrast between myelon and CSF remains as poor as on the SE sequence. Signal inhomogeneities along the myelon are also recognizable on this image. e T1-weighted sagittal image (TSE; TR = 747 ms, TE = 12 ms), phase-encoding gradient switched in the AP direction: Intermediate signal intensity of the vertebral bodies with relatively poorer contrast in comparison with the disks. The annulus is delineated only ventrally and dorsally as a thin dark line. The spinal cord displays intermediate signal intensity with sufficient contrast against the CSF. The image shows mild streak artifacts due to respiratory movements. It is typical that these images display fewer flow artifacts than the images obtained using a GRE technique. f T1-weighted SE image with the phase-encoding gradient switched in the craniocaudal direction (TSE; TR = 747 ms, TE = 12 ms): Overall, a very artifact-free reconstruction of the spinal canal. In comparison with e clear accentuation of the vertebral end plates, truncation artifacts along the direction of the phase-encoding gradient, and slightly ill-defined demarcation of the dorsal vertebral margins due to the chemical-shift phenomenon in the AP direction. g T2-weighted transverse image of the spinal canal (TSE; TR = 3100 ms, TE = 120 ms): Most artifact-free presentation of the spinal cord, although CSF flow artifacts are recognizable, appearing dorsally as circumscribed, linear phenomena with reduction in signal along the course of the CSF. Sagittal images should be obtained using T1- and T2-weightings. T1-weighted images. The use of a GRE sequence with T1 weighting has proven itself in achieving a better differentiation between bony structures and disk tissue. This distinction is far less possible with an SE sequence where the extent of retrospondylosis can be underestimated in some cases. T2-weighted images. Both GRE and TSE sequences are suitable for T2-weighted images. GRE sequences have the advantage of obtaining a high contrast between spinal cord and CSF, and the TSE sequence sometimes has the disadvantage of producing CSF flow artifacts, which could give cause for misinterpretation. Its advantage, on the other hand, lies in its otherwise lower susceptibility to artifacts as compared with the GRE sequence. Transverse images should be obtained using T2 weighting, with GRE sequences being advantageous in this respect, although T1 weighting is useful in individual cases, particularly when contrast administration is intended (Fig. 4.39). Imaging in two planes is necessary for the reliable detection of lateral herniations, which are more readily recognized on transverse than on sagittal slice orientations. Sagittal slices, on the other hand, are suitable for a broad survey of the entire cervical spine. They portray spinal cord alterations better than the transverse scan, particularly in the presence of compression-related spinal-cord atrophy. Slice thicknesses should be no more than 3 mm. Fig. 4.39a—f Normal finding of the cervical spine: a T2-weighted sagittal image (TSE; TR = 4600 ms, TE = 112 ms): A somewhat decreased signal intensity in the disks of this 37-year-old patient. On the whole, however, differentiation between annulus and nucleus is still possible. The annulus appears as an intact structure dorsally. The bone-marrow signal is low. High contrast between disk tissue and CSF. Decreased signal intensity of the spinal cord with truncation artifacts visible as bright and dark lines along the spinal cord. Very good demarcation of the ligamenta flava and the interspinous ligamentous structures. b Transverse slice orientation using T2 weighting (FLASH; TR = 703 ms, TE = 15 ms, flip angle α = 20°): High signal intensity of the CSF. Good delineation of the anterior and posterior roots. There is also a good presentation of the ganglion in the course of the right and left intervertebral foramina. Demarcation of the vertebral artery is possible on either side without difficulty. c T1-weighted sagittal image (SE; TR = 351 ms, TE = 12 ms): The dorsal vertebral body margins are relatively poorly delineated. The differentiation between a retrospondylosis and CSF is often impossible on account of the dark CSF. The chemical-shift artifact is well recognizable in a craniocaudal direction after switching the phase-encoding gradient in the AP direction. The inferior end plate appears as a sharply defined dark line, the superior end plate displays a somewhat ill-defined border with the disk while signal cancellation by the cortex is lacking. d T2-weighted image (TSE; TR = 5300 ms, TE = 112 ms) of a 63-year-old female patient: The image shows an unremarkable finding of the myelon. Disk degeneration at C5/C6 and C6/C7. Evaluation of the dorsal structures is difficult because there is hardly any difference in signal intensity between bone and intervertebral disk. e T1-weighted SE image of the same patient (SE; TR = 500 ms, TE = 12 ms): The image gives the impression of small disk prolapses at C5/C6 and C6/C7. f GRE T1-weighted (FLASH two-dimensional; TR = 403 ms, TE = 11 ms, flip angle α = 90°): In contrast to the SE image, the reactive bony bridging around the C5/C6 and C6/C7 disks is now well demonstrated. In addition, this sequence readily displays the osteochondrosis with subchondral sclerosis at C6/C7, whereas this finding is recognizable neither on the T2-weighted TSE image nor on the T1-weighted SE image. MR images not infrequently contain an abundance of pathological findings, which may, however, be of only slight clinical relevance in some cases. Alternatively, the finding responsible for the clinical symptoms may be unobtrusive or difficult to identify. This applies, for example, to lateral disk herniations or sequesters that have been extruded far into the spinal canal and have no connection with the disk of origin. These can elude the examiner if the clinical symptoms and their evaluation are not taken into account when planning the examination. It is therefore also important for the radiologist to become acquainted with the segmental innervation of the trunk and the extremities, to have an overview of the key muscles of the individual nerves, and to be able to interpret reflex patterns and their assignment to the individual spinal segments. Various types of pain are differentiated according to its quality, origin and radiation: Diskogenic pain. The region of a potential disk herniation, i.e. the posterior longitudinal ligament, the outermost components of the annulus fibrosus, parts of the periosteum and the vertebral body, as well as the meninges and blood vessels in the epidural space, has a direct somatosensory nerve supply. Therefore, changes in this region that are induced, for example, by a disk protrusion can lead to circumscribed, so-called diskogenic, pain. This pain syndrome is known by the term “lumbago.” Radicular pain. So-called radicular pain arising from irritation of the nerve root is different. Here the most common causes are disk protrusions or herniations, possibly combined with bony alterations of the vertebral end plates or the small joints between the vertebral bodies. Radicular pain is associated with pain radiation that corresponds to the respective dermatome. The segmental innervation of the skin is summarized in Fig. 4.40. This should not be confused with the innervation of peripheral nerves, which differs from the dermatomes. The peripheral nerve contains fibers from various segments of the spinal cord, as opposed to the dermatome, which has nerve fibers from only one segment of the spinal cord. With root lesions, it is algesia that is foremost. Vegetative reactions on the part of the autonomic nervous system, such as sweating, vasomotor function, piloerection, are lacking. On the other hand, paresthesias can occur along the corresponding dermatomes. Sometimes there is a reduction in the power of the key muscles and, with more severe damage, muscular atrophy is seen. Reflex disturbances are characteristic and correspond to the damage. Other pain symptoms. A completely different symptomatology is presented if there is direct compression of the spinal cord, e.g. secondary to disk herniation in the cervical or thoracic region. Apart from concomitant signs and symptoms of radiculopathy, these cases can present clinically with symptoms consistent with myelopathy. Myelopathy is characterized by: • spastic paresis of the extremities, • sensory deficit.
D. Uhlenbrock
 cartilaginous end plate
 annulus fibrosus
 nucleus pulposus
 Type I: in the neonate.
 Type II: in the child and juvenile.
 Type III: in the younger adult.
 Type IV: in the older adult.
 Nucleus Pulposus Type I
 Nucleus Pulposus Type II
 Nucleus Pulposus Type III
 Nucleus Pulposus Type IV
 Concentric tear.
 Transverse tear.
 Radial tear.
 Complete tear.
 Concentric Tear
 Transverse Tear
 Radial Tear
 Complete Tear
 Type I Signal Change
 Type III Signal Change
 Toyone Classification

Related posts:
Stay updated, free articles. Join our Telegram channel

Full access? Get Clinical Tree


