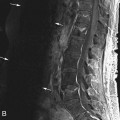
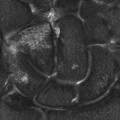
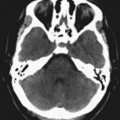
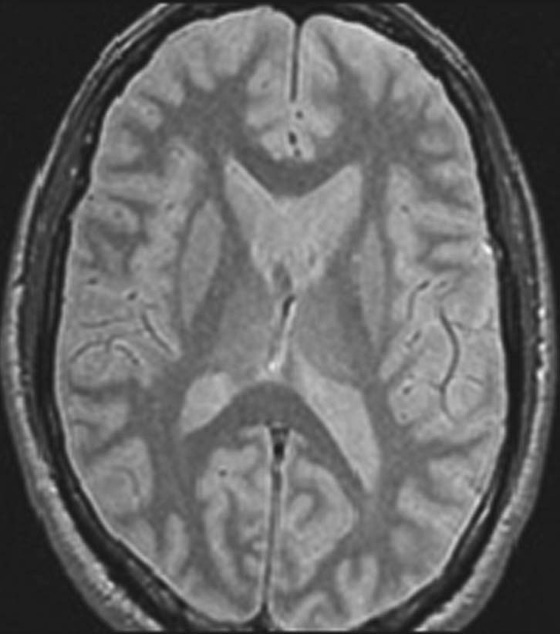
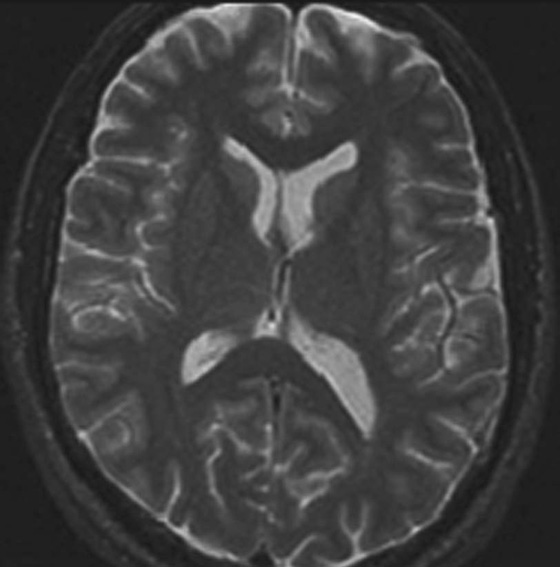
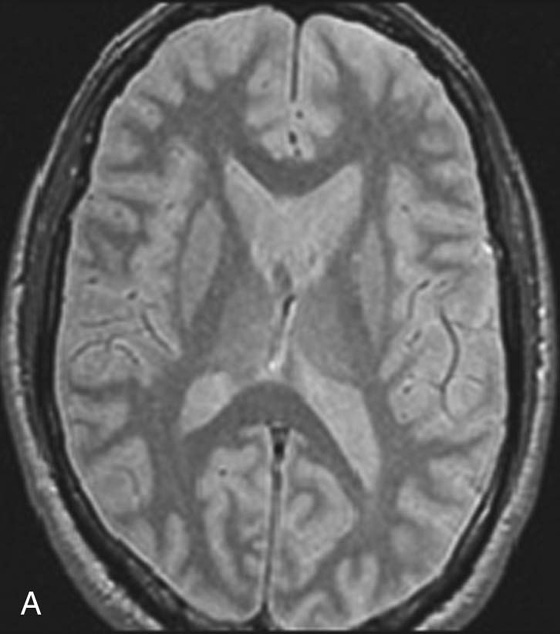
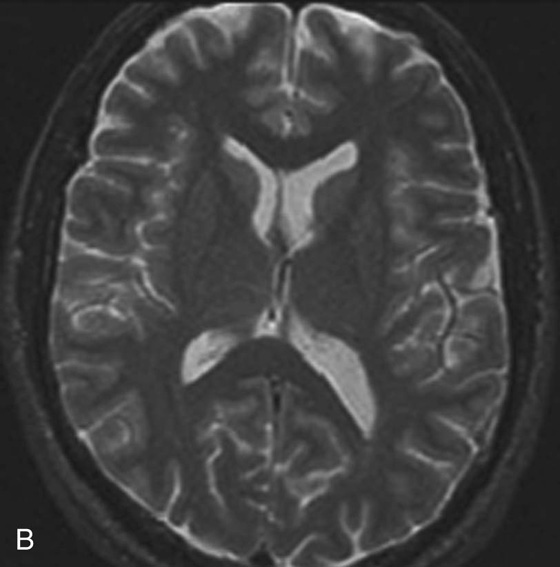
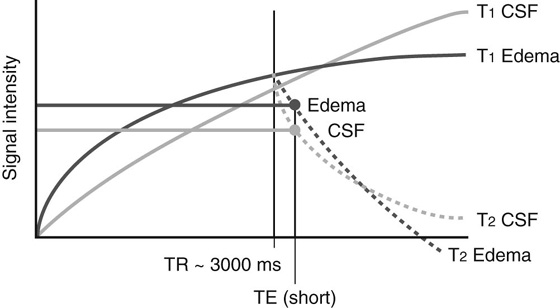
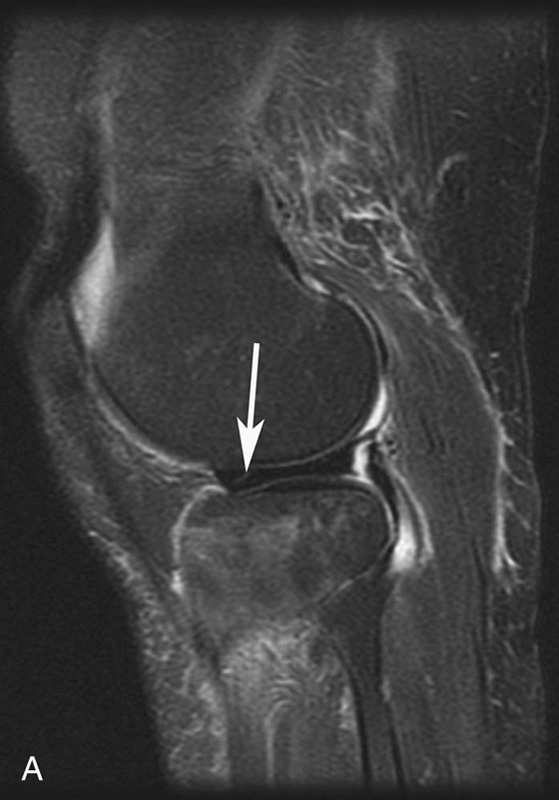
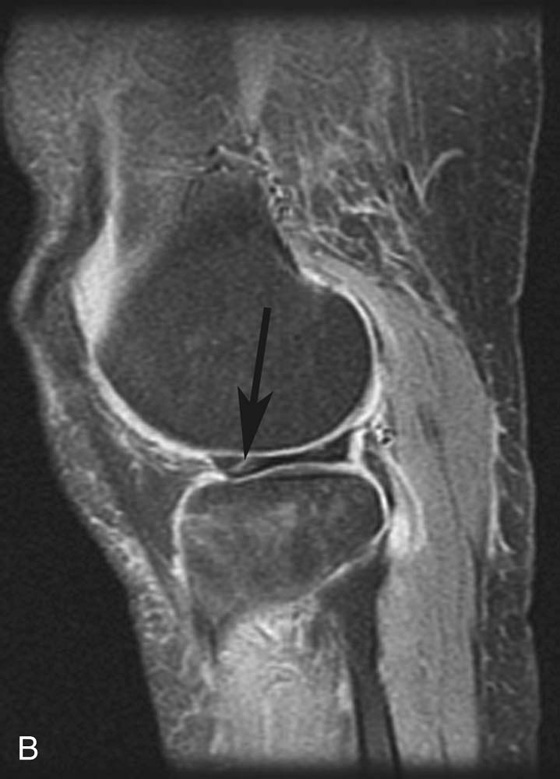
Chapter 3 Kimball L. Christianson, Rodney D. Welling, Allen W. Song, and Christopher D. Lascola 1. What are the two sequences above? 2. What are the imaging characteristics that help distinguish these sequences? 3. Which sequence has greater SNR? 4. What are some clinical applications where proton density images may be most helpful? FIGURE 1A. Axial PDW image. FIGURE 1B. Corresponding T2W image. 1. Axial proton density–weighted (PDW) image on the left, and corresponding T2-weighted (T2W) image on the right. 2. Intrinsic contrast between gray matter, white matter, and cerebrospinal fluid (CSF) is diminished as compared to the adjacent T2W image; CSF is intermediate and isointense to gray matter; overall signal intensity of the image is greater than the corresponding T2W image. 3. Proton density (PD). 4. PD images have a signal-to-noise ratio (SNR) that is higher than any comparable T1-weighted or T2W image. PDW imaging is particularly helpful for imaging complex tissues with limited SNR, such as in the posterior fossa, neck, and spine. In some musculoskeletal applications, differences in PD within tissue elements is inherently high so that PDW imaging provides both excellent contrast and superior SNR. As discussed in Chapter 2, magnetic resonance (MR) image contrast is not exclusively due to differences in T1 or T2 characteristics, but rather varies along a spectrum of two parameters, time to repetition (TR) and time to echo (TE). Different combinations of TR and TE produce three major types of tissue contrast: T1 weighted, T2 weighted, and proton density weighted. T1-weighted (T1W) imaging enhances the T1 effect and minimizes T2 weighting by shortening TR and TE. T2-weighted (T2W) imaging enhances the T2 effect and minimizes T1 weighting by lengthening both TE and TR. Proton density–weighted (PDW) imaging minimizes both T1 and T2 by lengthening TR and shortening TE. By reducing the contribution from T1 and T2, signal intensity in PDW imaging becomes proportional to the number of protons in each tissue (i.e., “proton density”). In “true” PDW imaging, pure water will have the most signal since its proton density (PD) is higher than that of any tissue. In practice, however, sequence parameters for PDW imaging are modified so that T1 and/or T2 contributions are moderately increased to optimize contrast within the tissue of interest. In brain, for example, PDW imaging sequences are designed to depict edema as brighter than cerebrospinal fluid (CSF), even though CSF has a higher PD. TR is shortened to reintroduce more T1 contribution and take advantage of the differences in T1 relaxation between edema and CSF (Fig. 1). Although CSF has higher PD, edema has a shorter T1 recovery. For PDW imaging in the brain, TR is shortened to a time when T1 contrast between CSF and edema is present, and signal intensity related to T1 recovery is still higher for edema (see Fig. 1). One may wonder what utility remains for PDW imaging, given the near-universal adoption of fast spin echo (FSE) sequences, especially those with inversion recovery preparatory pulses (e.g., fluid-attenuated inversion recovery [FLAIR], short tau inversion recovery [STIR]) that provide excellent contrast in brain and bone. Indeed, PDW images demonstrate little intrinsic contrast, since variations in PD between different tissue elements is often small (< 10%). Before FSE became commonplace, PDW imaging did not add imaging time because PD images were acquired “free” during conventional spin echo (CSE) T2W sequences. PD signal was collected at an intermediate TE within the same TR. With FSE, PDW imaging must instead be run as an entirely separate sequence. PD images are still useful because their signal-to-noise ratio (SNR) is higher than any comparable T1W or T2W image. High SNR is achieved because longitudinal recovery is maximized and transverse decay minimized. PDW imaging is most helpful in those settings where SNR is at a premium, and the advantages of higher SNR outweigh any disadvantages related to lower intrinsic tissue contrast. These settings include deep, complex tissues with significant magnetic field inhomogeneity, such as the posterior fossa, neck, and spine. In some musculoskeletal applications, intrinsic differences in PDs between tissue elements (e.g., bone/soft tissue) are high enough that PDW imaging provides both excellent contrast and high SNR. FIGURE 2A. Sagittal T2W image demonstrates subtle linear high signal (white arrow) in the anterior horn of the lateral meniscus. FIGURE 2B. This same area of linear high signal is better visualized on the PDW image and is clearly seen to extend to the articular surface (black arrow).
Proton Density
CASE 1
ANSWERS
CASE 1
Physics Discussion
CASES 2 AND 3: COMPANION CASES
Case 2
Related posts:
![]()
Stay updated, free articles. Join our Telegram channel

Full access? Get Clinical Tree


Density