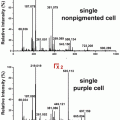
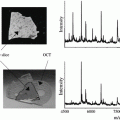
Fig. 1
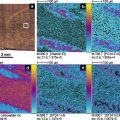
MSI analysis workflow: (a) The first step is sample preparation, which requires minimal or sometimes no sample preparation; (b) data acquisition includes the steps of desorption/ionization, mass analysis, and ion detection, and (c) data analysis is the last step, where the spectra are converted in two-dimensional ion images using a color intensity scale with the relative ion intensity reflected by the intensity of the color
Data acquisition includes the steps of desorption/ionization, mass analysis, and ion detection. DESI-MSI data acquisition is performed by using microprobe mode as method for sample interrogation. In this mode, the whole surface of the sample is divided conceptually into small areas (pixels) which are scanned individually and sequentially in time. The steps of desorption and ionization in DESI are fully integrated and a single agent (the solvent) is employed. The ionization/desorption agent is set to provide the desired spatial resolution. The data from a single pixel are normally represented by a single mass spectrum or an average of two or more acquired mass spectra within the specific spot or by continuously rastering the surface with the ionizing agent. In the common microprobe mode, the use of an automated moving stage is required to assure the reproducibility of the scan velocity in order to accurately reproduce the geometry of the system [24, 25].
After the sample has been ionized, the ions either solvated in microdroplets or free gas-phase ions are directed into the mass spectrometer and mass analyzed. Several types of analyzers have been employed for ambient ionization MSI including linear triple quadrupoles (QqQ), quadrupole ion traps (Q-Trap), OrbiTraps, time of flight (ToF), and Fourier transform ion cyclotron resonance MS (FTMS). Mass analysis is followed by the data processing step, the third stage in the sequence of steps leading to creation of MS images. The recorded mass spectra are converted into a 2D image file, which can then be opened and visualized by imaging programs (e.g., the freeware BioMap or commercially available software, FlexImaging). Two-dimensional ion images are displayed using a color intensity scale with the relative ion intensity reflected by the intensity of the color. Appropriate contrast in the color bar and overlay can also be used to improve the visualization of the ion images. These ion images can be used to represent intensity distributions of ions of a single m/z ratio or they can be more complex representations, including ion populations that embody a particular chemical, biological, or bioinformatics parameter, for example, a principal component derived from a multivariate statistical analysis [26, 27].
1.2 Solvent, Substrate, and Geometrical Optimization
Optimization of the DESI sprayer is important for obtaining a high-quality MS image. The solvent system needs to be optimized to obtain an adequate signal level, depending on the sample analyzed and the target compounds [24]. The distances between the spray tip, the substrate, and the inlet of the mass spectrometer should be adjusted to obtain an appropriate small spray spot. The size and shape of the spray spot are also affected by the solvent being used, the flow rate, the DESI source tip dimensions, and the nebulizing gas pressure [26]. As indicated in studies of DESI sampling, there are three distinct regions in the sampling spot, with most desorption taking place in the inner region [28, 29]. It is important to have a well-defined spot on the surface to minimize redeposition and mixing of the sample during imaging.
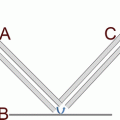
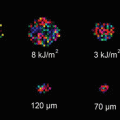
Other important parameters are spatial resolution and sensitivity, which need to be balanced. The typical spatial resolution in DESI is ~200 μm, but this value can be reduced to 40 μm under particular operating conditions [30] even for biological tissue [31]. However, it should be kept in mind that increasing the spatial resolution will lead to a decrease of the signal intensity and hence affects the quality of ion images and the needed time to record them. The spray angle also plays an important role. Typically a spray angle of 52° (from the surface plane) provides higher signal intensity, whereas when the sprayer is perpendicular to the substrate (spray angle: 90°), the signal intensity decreases due to decreased secondary droplet transfer efficiency. This perpendicular spray, also called geometry-independent DESI, requires an enclosure and a coaxial return tube to optimize sensitivity [32].
1.3 Protocol Overview
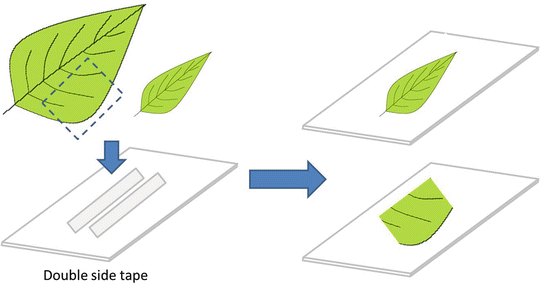
This procedure is intended to illustrate the application of DESI-MSI of biological tissues with emphasis on small-molecule detection. Three different sample preparation procedures are presented: direct analysis of the sample surface, cryosectioning tissue sample [33], and imprinted sample surface [34]. The methodology for sample preparation should be chosen considering the sample characteristics. Samples that cannot be directly accommodated in front of the MS due to their irregular/soft surfaces or large sizes can be easily imprinted on an absorbent surface and then imaged without the need to use a cryostat. The efficiency of blotting is directly influenced by the chemical properties of the surfaces as well as the properties of the chemical compounds which are transferred into the surface.
2 Materials
2.1 Samples
1.
Ginkgo leaves (Gingko biloba L.).
2.
Zebra fish (Brachydanio rerio).
3.
Strawberry fruits (Fragaria × ananassa Duch.).
2.2 Solvent and Reagents
1.
Water (ultrapure, 18 MΩ-cm).
2.
Methanol (MeOH: HPLC grade).
3.
Acetonitrile (ACN: HPLC grade).
4.
Compressed nitrogen (99.995 %).
5.
Carboxymethyl cellulose.
6.
Tricaine methanesulfonate (MS222).
7.
Dry ice.
2.3 Molds, Surfaces, and Other Materials
1.
Plain glass slides.
2.
Plastic histological mailer.
3.
TLC plates, 200 μm of thickness and 25 μm of pore size.
4.
Aluminum foil.
5.
Disposable embedding mold, rectangular 22 × 40 × 20 mm.
6.
Embedding media (FSEM—Shandon Embedding Matrix).
7.
Insulating container.
8.
Desiccator.
2.4 Microtome and Mass Spectrometer
1.
Cryomicrotome.
2.
Microtome blades.
3.
Tissue sample holder.
4.
Hot plate or nonstick iron.
5.
Syringe 500 μL.
6.
Mass spectrometer (linear Ion-Trap LTQ Thermo Fisher Scientific, San Jose, CA—USA).
7.
Extended ion-transfer tube (custom-built).
8.
PicoTip emitter (New Objective, cat. no. TT150-50-50-N-5).
9.
DESI source (custom-built or commercially available).
2.5 Software
1.
Xcalibur 2.0 software (Thermo Fisher Scientific, San Jose, CA).
2.
ImageCreator-v3.0 software.
3 Methods
3.1 Sample Preparation
3.1.1 Direct Analysis: Gingko Leaf
3.1.2 Histological Sections: Zebra Fish
1.
First, prepare a tank with tricaine methanesulfonate solution (MS222, 200–300 mg/L) for fish euthanasia by prolonged immersion (see Note 1 ).
2.
Remove the zebra fish from its main tank and place it in a tank with tricaine methanesulfonate solution. The fish should be left in the solution for at least 5–10 min following cessation of the opercular movement.
3.
Remove the euthanized fish from water; let the excess water drain and place it in aluminum foil. The euthanized fish should be kept in the fridge until mold preparation (see Note 2 ).
4.
Heat water (200 mL) in a beaker on a hot plate at 35–45 °C and add small portions (10 mg each time) of carboxymethyl cellulose (CMC) while stirring. The CMC should be added until the right level of viscosity, like a paste/gel consistency.
5.
Fill the mold with CMC until 1/3 of total volume and put in the freezer by 25 min.
6.
Remove the mold from the freezer and immediately place the zebra fish on top of the CMC, followed by the addition of more CMC to complete to mold (see Note 3 ).
8.
Take the zebra fish molds out of the fridge and place it in an insulating container with dry ice to maintain subzero temperatures when transferring to the cryomicrotome station.
9.
Remove the sample from the mold and place it on the sample holder using a minimal amount of frozen specimen-embedding media (FSEM). The use of FSEM should be minimized and restricted to the tissue attachment to the sample holder (see Note 4 ).
10.
Cut the tissue into 20–45 μm thick slices using a cryomicrotome at −10 to −18 °C.
11.
Collect the tissue sections onto microscope glass slides by thaw mounting. This is accomplished by attaching the cold tissue sections to the glass slide (Fig. 3).
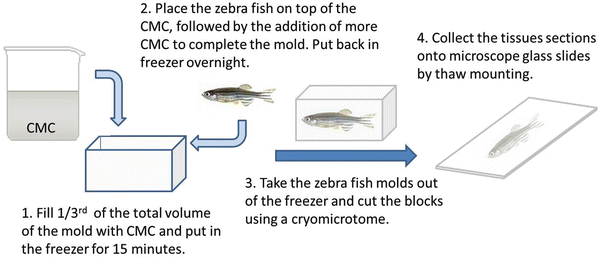

Fig. 3
Histological section preparation
12.
(Optional) If the samples will not be immediately analyzed, save the slides in a closed container (e.g., plastic histological mailers) on dry ice and store at −80 °C until use.
13.
(Optional) If the slides have been stored at −80 °C, take the closed containers with the slides from the freezer and let them warm up at room temperature (~21 °C) in a vacuum desiccator before analysis.
3.1.3 Blotting: Strawberry or Gingko Leaf
Direct Blotting
1.
Cut the TLC plate in square shape with 5 cm × 5 cm or according to the sample size. Always use 2 cm more than the original sample size.
2.
Manually cut the fresh strawberry in side view by using a common blade (e.g., kitchen knife).
3.
Blot the TLC plates by positioning the sectioned strawberry directly onto the TLC plate for 5 s (Fig. 4).
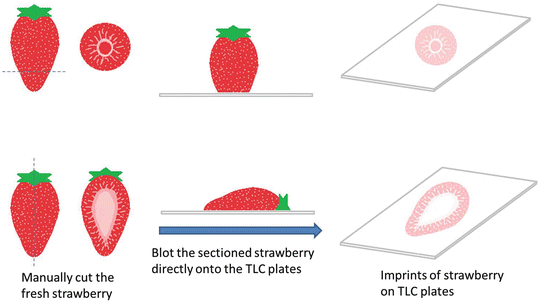

Fig. 4
Direct blotting preparation
4.
For leaf imprinting put the leaf between two TLC plates and press against a hard surface (e.g., iron at room temperature) by 15 s.
Thermo-Assisted Blotting
1.


Prepare the TLC plate and cut the strawberry as described in Subheading 3.1.3.1 (direct blotting).
Stay updated, free articles. Join our Telegram channel

Full access? Get Clinical Tree


