Fig. 1
(a) Optical image of the unreacted granite sample with the area imaged outlined in blue, (b) total ion image and selected ion images of (c) protonated purine (m/z 121) and (d) solvent contaminant phthalate ester (m/z 149) obtained by imaging the unreacted granite sample by DESI-MSI. The intensity scale ranges for (c) and (d) were set to match Fig. 1e, j, respectively, in order to demonstrate relative ion abundance difference before and after the formamide reaction. Reproduced from [6] with permission from American Chemical Society
3.6 Reaction Conditions
1.
Place the granite sample in the 100 mL glass beaker or other vessel of choice.
3.
Cover the beaker with aluminum foil.
4.
Place the covered beaker in the oven (already heated to 160 °C) and ensure that the oven will not be disturbed (door opened, etc.) during the reaction time.
5.
Leave the beaker in the oven for 96 h.
6.
At the end of the reaction period, remove the sample from the oven and allow it to cool to room temperature.
7.
Remove the granite sample from the reaction supernatant and blot with a laboratory tissue.
8.
Store the reaction supernatant for later analysis if interested.
9.
Immediately prepare the sample for imaging; otherwise store the granite in a Petri dish (or other container) in a refrigerator until ready for analysis.
3.7 Rinsing, Soaking, and Imaging
The supernatant of this reaction is viscous and the reaction products of interest were those closest to the granite surface. Therefore we carried out a series of rinsing steps in order to directly analyze the surface (see Notes 8 and 9 ).
1.
Rinse the granite sample by pouring or pipetting 1 mL of the methanol–water mixture (7:3) over the surface and repeat for a total of two rinses.
2.
4.
If there are known products of interest, plot the ion’s spatial distribution in BioMap using the FireFly-converted data.
5.
Reaction products tentatively identified in this example reaction are listed in Table 1, and their spatial distributions are mapped in Fig. 2.
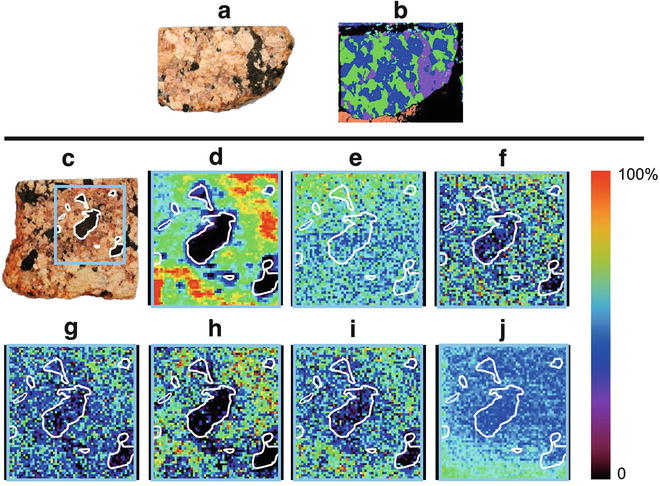
Table 1
Tentatively identified products and their distributions across minerals present in the granite sample shown in Fig. 2
Assignment | Exact m /z | Experimental m /z | % of abundancea | ||
|---|---|---|---|---|---|
Quartz | Biotite | Orthoclase | |||
[Purine + H]+ | 121.0514 | 121.0471 | 37.3 | 30.2 | 32.5 |
[4-Azacytosine + Na]+ | 135.0283 | 135.0230 | 40.2 | 29.0 | 30.8 |
[Purine + K]+ | 159.0073 | 159.0026 | 39.4 | 24.5 | 36.1 |
[N(9)-formylpurine + K]+ | 187.0022 | 187.0016 | 37.1 | 27.4 | 35.5 |
[2Cytosine + Na]+ | 245.0763 | 245.0871 | 38.7 | 26.1 | 35.2 |
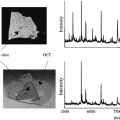
Fig. 2
(a) Optical image of a representative sample granite and (b) a corresponding μXRF image. (c) Optical image of reacted granite, (d) total ion image and selected ion images of (e) protonated purine (m/z 121), (f) sodiated 5-azacytosine (m/z 135), (g) potassiated purine (m/z 159), (h) potassiated N(9)-formylpurine (m/z 187), (i) sodiated cytosine dimer (m/z 245), and (j) phthalate ester (m/z 149) acquired with the area imaged outlined in blue and trends overlaid in white. Reproduced from [6] with permission from American Chemical Society
To ensure that the observed differences in ion abundance across the surface are not artifacts of the DESI-MSI experiment, the following control experiments should be performed in addition to the control experiment for the model reaction.
3.8 Reaction Control (See Note 10 )
1.
With a new and clean granite sample, repeat Subheading 3.6, except do not place the sample in the oven.
3.
Get Clinical Tree app for offline access

A set of chemical images acquired following this control reaction are shown in Fig. 3.
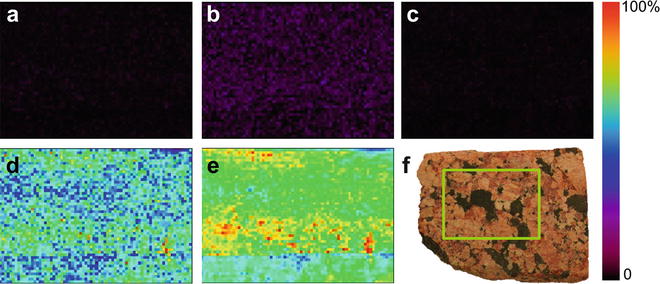
Fig. 3
 MALDI Mass Spectrometry Imaging of Lipids and Primary Metabolites on Rat Brain Sections
 TOF-SIMS Imaging of Lipids on Rat Brain Sections
 Laser Ablation Sample Transfer for Mass Spectrometry Imaging
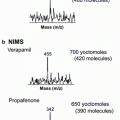 Nanostructure Imaging Mass Spectrometry: The Role of Fluorocarbons in Metabolite Analysis and Yoctomole Level Sensitivity
 DESI Imaging of Small Molecules in Biological Tissues
 Nanoparticle-Assisted Laser Desorption/Ionization for Metabolite Imaging


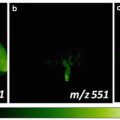
Extracted ion images of (a) protonated purine, m/z 121; (b) protonated adenine, m/z 136; (c) potassiated N(9)-formylpurine, m/z 187; (d) solvent contaminant phthalate ester, m/z 149; and (e) total ion images obtained by DESI-MSI of a granite sample ((f), imaged area outlined in green) soaked in formamide. Reproduced from [6] with permission from American Chemical Society
Related posts:
MALDI Mass Spectrometry Imaging of Lipids and Primary Metabolites on Rat Brain Sections
TOF-SIMS Imaging of Lipids on Rat Brain Sections
Laser Ablation Sample Transfer for Mass Spectrometry Imaging
Nanostructure Imaging Mass Spectrometry: The Role of Fluorocarbons in Metabolite Analysis and Yoctomole Level Sensitivity
DESI Imaging of Small Molecules in Biological Tissues
Nanoparticle-Assisted Laser Desorption/Ionization for Metabolite Imaging
Stay updated, free articles. Join our Telegram channel
Full access? Get Clinical Tree