Category
RECIST
RECIST 1.1
mRECIST
WHO
EASL
CR (complete response)
Disappearance of all target lesions (up to five measurable liver lesions)
Disappearance of all target lesions (up to two measurable liver lesions)
Disappearance of any intra tumoral arterial enhancement in all target lesions (up to two measurable liver lesions)
Complete disappearance of all target lesions
Disappearance of any intratumoral enhancement in all lesions
PR (partial response)
30 % decrease in the sum of the greatest diameter of target lesions
At least 30 % decrease in the sum of the greatest unidimensional diameters of target lesions, compared to baseline
At least a 30 % decrease in the sum of unidimensional diameters of viable (arterially enhancing) target lesion, compared to baseline
At least 50 % decrease in tumor size
At least 50 % decrease in the sum of the product of bidimensional diameters of viable (arterially enhancing) target lesions
SD (stable disease)
Meets neither PR nor PD criteria
Meets neither PR nor PD criteria
Meets neither PR nor PD criteria
Meets neither PR nor PD criteria
Meets neither PR nor PD criteria
PD (progressive disease)
20 % increase in the sum of the greatest diameter of target lesions
An increase of at least 20 % in the sum of the diameters of target lesions, compared to baseline
An increase of at least 20 % in the sum of the diameters of viable (enhancing) target lesions, compared to baseline
>25 % increase of at least 1 lesion or a new lesion
An increase of at least 25 % in the sum of the diameters of viable (enhancing) target lesions
2.1 WHO and RECIST 1.1
Once target lesions (up to five per organ, WHO; up to 2 per organ, RECIST 1.1) are measured using either single linear summation (RECIST 1.1) or the bilinear product approach WHO, the results are subsequently assigned to response-defined categories of complete response (CR), PR, stable disease (SD), and PD. By somewhat arbitrary decision making, mRECIST defined PR as a more than 30 % linear decrease of the linear sums of the target lesions (thus, by extrapolation, implying a 65 % volumetric decrease) and PD as a more than 20 % increase (implying a 73 % volumetric increase) with at least a 5 mm increase of lesions size. This contrasted with criteria, in which those boundaries are set volumetrically at 65 and 40 %, respectively.
2.1.1 Advantages of WHO and RECIST
As a simply implemented procedure, RECIST has both its advocates and critics. Publications both supportive and critical can be cited in the scientific literature (James et al. 1999; Mazumdar et al. 2004; Park et al. 2003). RECIST and WHO have their devotees as easily understood methods that allow simple ruler analysis of printed films as well as workstation use of electronic calipers to produce comprehensible results. Clinical imaging usually provides correlative or mostly secondary trial end points, so mRECIST and WHO criteria provide pragmatically adequate tools that satisfy a noncritical role relative to other data and clinical outcome that take primacy. They are accommodating of a variety of imaging acquisition circumstances and place minimal added demand on routine clinical practices. In sum, they have been perceived as simple tools adequate to imaging’s supportive role. To date, few widely available alternatives exist that are as easily executed or of provably greater benefit to justify further expense, time demands, or operational complexity (Tran et al. 2004).
2.1.2 Disadvantages of WHO and RECIST
As RECIST was framed in the context of individual slices, the research community is currently reexploring the obvious gaps in both RECIST and WHO criteria, which admittedly were constrained by the limits of earlier technology. To list the most obvious shortcomings, neither linear- nor bilinear-based methods address intratumor heterogeneity and its change over time, as it might occur after tumor-targeted therapy (e.g., Yttrium-90 microsphere embolization, radiofrequency ablation, etc.), nor do they reflect appropriate measures for tumor metabolism (Fig. 1). They do not incorporate multislice integrated understanding, register information about time-sequence change of shape or morphologic complexity, or address statistical uncertainties arising from low-intensity lesion edges. The techniques do not provide methodological distinctions between tumors of inherently high contrast compared with their surrounding tissue (e.g. lung), nor do they prescribe specific approaches to the use of contrast materials usually needed to enhance intra-abdominal soft tissue findings (Kamel and Bluemke 2002). Most importantly, little attention was paid to acknowledge in the guidelines the inconsistencies inherent in the expert observer. The reader makes his/her measurements unassisted by anything other than the most rudimentary form of image processing technology (often simply the use of electronic calipers on a workstation display). Neither RECIST nor WHO provide especially rigorous guidance on the subject of observer variability aside from recommending review panels and independent observers. Disagreement among observers has been noted to be as high as 15–40 % in these contexts and may not be ideally remedied by consensus (Belton et al. 2003). Besides providing only nominal guidance on slice thickness, RECIST does not address at any length image acquisition components that inevitably result in significant lesion contrast differences within and between studies, such as lack of uniformity of machine settings for kVp (peak kilovolts) and mAs (milliampere seconds) in CT, and pulse sequences in MRI. As a simply adoptable, widely applicable method, posing no impediment to accrual from a wide range of CT and MRI sites, RECIST has served a useful historic purpose in grouping image data into the rough four-group response classifications (CR, PR, SD, and PD). But since diameter measurements are best determined on smoothly shaped, distinct tumor boundaries, an ideal circumstance encountered infrequently, measurement variability inherent in such judgments is not adequately reflected in the recorded data. Tumors with irregular or diffuse boundaries pose the most significant challenge to data extraction and are highly observer dependent. Indeed, tumor boundary distinctiveness varies on a disease- or organ-specific basis. Observer recognition of boundaries may be further complicated by necrosis-caused internal heterogeneity that permeates the tumor or expresses itself asymmetrically on the lesion edge. Especially in the liver, tumor boundary sharpness in both CT and MRI may be enhanced by injection of contrast agents. But contrast agent pharmacokinetics are variable, and image acquisition routines are often compromised because they are usually prescribed by time from contrast administration, rather than the more definitive, but harder to obtain, contrast arrival time within specific organs.
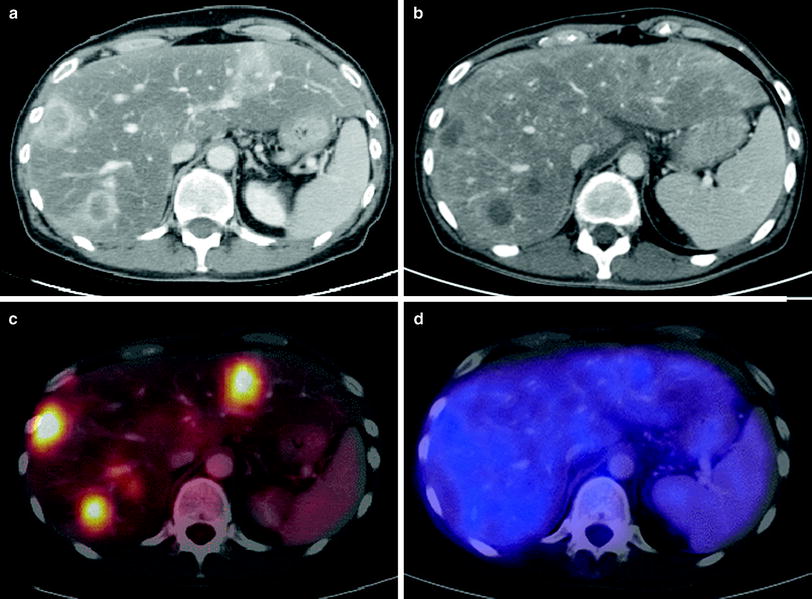
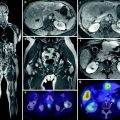
Fig. 1
47-year-old female patient with hepatic metastases from pancreatic cancer. Contrast-enhanced CT (a) shows multiple liver lesions with rim enhancement. The corresponding fused PET-CT image (c) demonstrates high FDG-uptake due to increased tumor metabolism. The CT scan 4 months after radioembolization (b) delineates hypovascular tumor lesions without significant change concerning their size. According to RECIST, this displays the response category “stable disease”. The fused PET-CT image (d) proves that there is no increased tumor metabolism in the area of the former metastases, therefore indicating that this result represents a “complete remission”
2.2 EASL criteria and mRECIST (for Hepatocellular Carcinoma)
Evaluation of response to treatment is a key aspect in cancer therapy. RECIST or WHO criteria are used in most oncology trials, but those criteria evaluate only uni or bidimensional tumor measurements and disregard the extent of necrosis, which is the target of all effective locoregional therapies, e.g., radioembolization. Therefore, the EASL guidelines recommended that assessment of tumor response should incorporate the reduction in viable tumor burden (Therasse et al. 2000; Eisenhauer et al. 2009; Bruix et al. 2001; Forner et al. 2009).
In EASL criteria, quantifying the amount of enhancing (and hence viable) tissue, CR is defined as the absence of any enhancing tissue (Fig. 2); PR is defined as ≥50 % decrease in amount of enhancing tissue. SD is defined as <50 % decrease in amount of enhancing tissue (Bruix et al. 2001). According to this also the mRECIST criteria (mRECIST) take the arterial enhancement of tumoral tissue before and after (locoregional) treatment into account. CR is defined as complete disappearance of any intratumoral arterial enhancement in all target lesions, PR as at least 30 % decrease in the sum of the diameters of the viable (enhancement in arterial phase imaging) target lesions, PD as at least 20 % increase in the sum of the diameters of viable (enhancing) target lesions, and SD are any cases that do not qualify for either PR or PD. Recent publications indicate that these enhancement models more accurately help to predict long-term survival in hepatocellular carcinoma (HCC) patients treated by transarterial means (Shim et al. 2012).
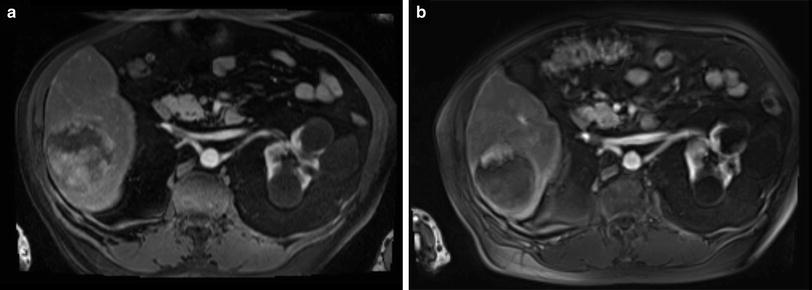
Fig. 2
78-year-old male patient with liver cirrhosis and a single HCC. Contrast-enhanced arterial phase MRI (a) shows a large (8 cm) hypervascular HCC before transarterial, loco regional treatment. Follow-up MRI (arterial phase) 6 weeks after treatment shows no significant shrinkage of the lesion but complete devascularization (b) According to the RECIST, RECIST 1.1, and WHO criteria this would be characterized as “stable disease”, however, employing mRECIST or EASL criteria this would be reported as “partial response” since little nodular rim enhancement is noted
2.3 Alternative Measurements
Technological advances in tomographic scanners, both CT and MRI, have been unrelenting. In the span of less than a decade, CT scanners have advanced from single-detector arrays that scanned body segments in more than a minute (thus nearly always subject to motion artifacts), to present-day instruments with two simultaneous X-ray sources, 128 detector arrays, submillimeter voxel resolution, and motion-resistant body-segment acquisition speed of less than 10 s. These have been matched by post-processing display improvements that provide real-time visualization from any arbitrary (multiplanar) view. Image processing based on voxel intensity neighborhoods is sufficiently commonplace that near immediate three-dimensional (3D) display of selected organs or the entire body are an expected part of conventional image reconstruction routines. In reality though, the advantages of tomography that offers submillimeter, isovolumetric imaging has yet to be fully absorbed into routine diagnostic practice, not to mention exploited for its potential to enhance the measurement processes in cancer patient’s follow-up. Most clinical trial tomographic imaging is still conducted at slice thicknesses of 5 or 7 mm in the intuitive conviction that those parameters are sufficient for the task required and for the convenience of the observer, who does not wish to be burdened by a vast number of images.
The availability of potentially more accurate and reproducible tumor volume data could motivate a re-examination of the foundations of the established categories of CR, PR, SD, and PD. RECIST, as it does not specify WB imaging at the time of each evaluation which may register conclusions that fail to account for nonimaged parts of the body. Assignment to CR, PR, etc. in following an abdominal malignancy could be misleading if there is not apparent presence of nonimaged metastases in lung or brain when those body regions were not prescribed in the protocol. Imaging techniques that are WB oriented, like PET, combined PET-CT, and WB MRI, thus have advantages from this perspective. RECIST addresses this possibility by acknowledging that events that can occur in the nonmeasurable targets, such as the growth of nonmeasurable lesions or the appearance of new lesions despite unchanged size of target lesions. In these circumstances, RECIST mandates a classification shift from SD to PD. But these body regions must first be imaged in order to trigger those rules. Image processing algorithms, mathematically and globally operating in true 3D data space, as exemplified by techniques known as autocontouring, region growing, nearest neighbor, annealing, gradient following, water shed, and statistical modeling, have been effective in a variety of scientific fields. They hold sufficient promise to deserve an opportunity to contribute to oncology. It is evident from image processing’s operational sphere that it is powered by mathematical approaches far exceeding the innate comprehension capacity of human observers. These sophisticated tools have already made key contributions to advances in medical image reconstruction and are the cornerstone of the remarkable anatomic detail we usually take for granted in our clinical environment.
Efforts to develop reproducible methods for measuring volumes of infiltrative tumors that lack clear margins, already recognized as a serious problem for linear and two-dimensional area measurement. Pathologic or histologic validation is unlikely to be clinically practicable. Given that ultimate validation is difficult, the mere task of generating a convincing test, whether precise or statistical, to compare alternative algorithms poses a challenge. In the past it has been convenient to accept expert consensus, despite the obvious flaw of relying on human opinion as a gold standard.
Promising recent developments for validation might be inferred from data derived from coregistration of MRI and CT images or PET-CT, which permit 3D anatomic CT to be combined with simultaneous tumor metabolic activity from the PET in fused, spatially registered images. This might be a first step in a path toward more rigorous validation.
3 Imaging
In heavily pretreated patients with known malignancy, possible further therapeutic strategies depend on the stage of disease, liver involvement, and whether multiple organ systems have been affected. In the past, patients had to undergo a variety of different diagnostic procedures to achieve a comprehensive staging or screening, including imaging studies such as ultrasonography, CT, MRI, PET, and X-ray examinations. The combination of these procedures is often time-consuming and inconvenient for the patient. Thus, a single imaging examination providing information of different organ systems (ideally of the entire body) would be of great interest.
Due to the mentioned limitations of conventional tomographic imaging (CT and MRI) in assessing the tumor response after tumor-targeted therapy like Yttrium-90 radioembolization, some studies have suggested that PET or PET-CT represent valuable tools in assessing tumor response (Selzner et al. 2004; Wong et al. 2002, 2004, 2005). As described before, anatomic imaging by CT or MRI is more or less insensitive in correctly determining tumor response by simply measuring the change in diameters because of the presence of central necrosis, edema, cystic changes, and hemorrhage. Given the lack of reliability of tumor markers (where applicable) in the presence of extrahepatic tumor manifestation, PET appears to be an excellent adjunct to define response after regional treatment of liver metastases (Barker et al. 2005).
3.1 Dual-Modality Positron Emission Tomography/Computed Tomography
Whole-body PET using FDG is an imaging modality enabling detection of cancerous disease by tracing increased accumulation of FDG in tumor tissue. The introduction of combined PET-CT scanners has made a new modality available for WB imaging, combining the functional data of PET with the detailed anatomical information of CT imaging in a single examination (Beyer et al. 2000).
[18F]-fluoro-2-deoxy-D-glucose-PET provides a functional metabolic map of glucose uptake in the WB. FDG is a glucose analogue that is labeled with the positron emitting radioisotope fluorine-18 that is produced by a cyclotron. The resulting radiopharmaceutical agent F-18 FDG is taken up by metabolically active tumor cells using facilitated transport similar to that used by glucose. The rate of uptake of FDG by tumor cells is proportional to their metabolic activity. Since FDG is a radiopharmaceutical analog of glucose, it also undergoes phosphorylation to form FDG-6-phosphate like glucose. However, unlike glucose, it does not undergo further metabolism, thereby becoming “trapped” in metabolically active cells (Kapoor et al. 2004). In general, PET is limited by poor anatomic detail, and therefore, anatomical correlation with some other form of imaging, such as CT, is desirable for differentiating normal from abnormal radiotracer uptake and accurate lesion localization.
First study results indicate, that a fusion of both modalities (PET and CT) improves diagnostic accuracy as well as lesion localization and report promising results for the staging of different oncological diseases compared to PET and CT alone (Lardinois et al. 2003; Pelosi et al. 2004). The total standard uptake value (SUV) of the entire axial slices of the liver as well as of the individual lesion correlated well with the laboratory and tomographic imaging results (Wong et al. 2004). However, PET-CT in some cases holds a risk of diagnostic misinterpretation, e.g., due to increased FDG-uptake in muscle or fat tissue, reduced spatial resolution or incorrect lesion localization caused by an inadequate fusion of the PET and CT data due to breathing artifacts. Furthermore, some tumor entities show no or only infrequent FDG-uptake (e.g., HCC), which suggests that FDG-PET-CT does neither represent the imaging modality of choice for detection nor response assessment in these tumor entities.
3.1.1 Proposal for a PET-CT Scan Protocol
Before performing the PET-CT scan patients have to be fasting for at least 6 h to keep blood sugar levels below 120 mg/dl. After an intravenous injection of Furosemide and Butylscopolamine, the application of approximately 370 MBq FDG is followed. Sixty minutes after the tracer application, a low dose-CT scan is performed from the skull base to the proximal femur for attenuation correction. Using a 3D-mode (144 × 144 Matrix), the emission scans are then conducted with 3 min per bed position (FOV 10 cm). For a WB examination an average of 12 positions is needed. After the emission scan, patients have a diagnostic spiral-CT scan (40 mAs, 120 kV, collimation 2 × 5 mm, pitch 1,5; using e.g., a two-detector row PET-CT system) covering thorax, abdomen, and pelvis with 120 ml of nonionic iodinated i.v.-contrast agent in the venous phase (70–80 s delay). Multiplanar reconstructions are performed on the diagnostic CT data set. Using the emission data, a reconstruction of the PET data with and without attenuation correction (Ramla-3D) and a reorientation in axial, sagittal, and coronal direction is followed. Finally, with the use of dedicated software the PET and CT data are fused.
3.2 Whole-Body Magnetic Resonance Imaging
3.2.1 Technical Requirements
Whole-body MRI has not been used in routine clinical care either because of extensively long examination times when diagnostic-quality sequences are employed, or because of inferior quality when fast sequences are utilized. To overcome these problems, different strategies have been explored. One approach has been the implementation of a sliding table platform that enables data acquisition of different anatomical regions in rapid succession (Barkhausen et al. 2001). Signal reception can be accomplished using posteriorly-located spine coils (integrated in the patient table) and an anteriorly positioned torso phased-array coil, which remains fixed to the stationary patient table in the isocenter of the magnet. Hence, data acquisition can be performed with the same stationary coil set. A rolling table platform has been successfully employed for the detection of bone metastases, parenchymal metastases including hepatic, cerebral, and lung metastases (Lauenstein et al. 2004). Other technological advances provide MRI systems with multiple input channels, which allow the simultaneous use of specialized surface coils (Schlemmer et al. 2005). A combination of coils, for example, a head coil with two or more phased-array body coils, can be employed simultaneously. Thus, high resolution images of multiple regions of the body can be acquired without the need of coil repositioning. Automatic table motion can acquire a total scan range of over 200 cm in the z-axis. Beyond the technical improvements in system hardware, concurrent developments have been made in MRI sequence protocols and imaging techniques. An important innovation is the use of fat-suppressed 3D gradient echo (GRE) sequences with nearly isotropic resolution, which has been developed for imaging of parenchymal organs (Lee et al. 2000; Rofsky et al. 1999). These 3D data sets can be acquired within a single breath-hold and provide excellent image quality. Furthermore, 3D data also offers the advantage of multiplanar reconstructions. In conjunction with rapid table motion, these T1-weighted (T1w) sequences permit dynamic imaging of various parenchymal organs after a single intravenous injection of paramagnetic contrast agents. Further improvement of WB-MRI is achieved by using parallel acquisition techniques (PAT). These techniques allow data acquisition with either increased spatial resolution or shorter acquisition time, or a combination of both (Griswold et al. 2002; Kramer et al. 2005). Combining a high number of surface coil elements and receiver channels now enables PAT imaging in all three spatial directions. In principal, the image reconstruction can be facilitated by two different algorithms: either by calculation of the missing k-space lines before Fourier transformation (SMASH or GRAPPA) or by later fusion of the generated incomplete images (SENSE) (Griswold et al. 2002; Pruessmann et al. 1999). Thus, the combined effect of hardware and sequence advances has allowed WB-MRI to be performed more rapidly while maintaining diagnostic image quality.
3.2.2 MRI Sequences for Whole-Body Imaging
Examination protocols should be tailored to specific clinical circumstances. However, all WB protocols should include gadolinium-enhanced T1w 3D GRE sequences of all different organ systems, and especially the liver for evaluation of the efficacy of regional tumor therapy. WB-MRI using only unenhanced imaging would substantially shorten examination times, but diagnostic accuracy would be substantially reduced. After contrast administration, data collection should be started in the abdomen with an arterial, portal venous, and late venous contrast phase of the liver. With this type of protocol, high sensitivity and specificity for focal liver lesions can be achieved. Moreover, antitumoral effects after liver-directed, minimal invasive therapies can be assessed. As compared to PET/CT, WB-MRI has a higher sensitivity in the detection of liver metastases and primary liver tumors. WB-MRI is also definitely superior in the detection of skeletal and brain metastases. In the assessment of lymph node involvement, on the other hand, PET/CT is most accurate.
3.2.3 Proposal for a Whole-Body MR Scan Protocol
First, coronal short tau inversion recovery (STIR) —sequences at 5 levels: (head, neck, pelvis, thighs, and lower leg) as well as thorax/abdomen in breath-hold technique with prospective 2D navigation correction of the inspiration phase [prospective acquisition correction (PACE)] are acquired. Using PAT, image acquisition can be completed within an acceptable time with a 1.8 × 1.3 mm in-plane resolution. Additionally, the lung is examined in axial orientation with STIR- and HASTE-sequences. After a navigator-triggered “free-breathing” T2w-fat saturated-SE scan of the liver the five body levels are examined with T1w-SE-sequences, followed by T1w- and STIR imaging of the spine in sagittal orientation. After application of gadolinium-based contrast medium (and saline flushing), axial dynamic (arterial, portal venous, and late venous phase) liver scans are performed, as well as axial T1w- and T2w-imaging of the brain. The last examination step consists of a fat-saturated T1w-GRE-sequence of the whole abdomen in axial orientation. Table 2 provides an overview of the proposed scan protocol. A PAT-factor of 3 is used for the coronal T1w-/STIR WB imaging apart from the lower leg. A PAT-factor of 2 is used for axial imaging of brain, lung, and abdomen, as well as for the sagittal scans of the spine and for the coronal scans of the lower leg.
Table 2
Overview of a proposed scan protocol applied to a whole-body magnetic resonance scanner with 32-receiver channels. Total scan time approximately 55 min
 |
4 Discussion
4.1 Detection of Liver Metastases
Imaging plays a major role in detecting and follow-up of metastatic disease in the liver, which strongly influences the treatment strategy. Contrast-enhanced CT has been reported as the most sensitive test for the detection of hepatic metastases. However, it has a considerable rate of false-positive findings, lowering the positive predictive value (Nelson et al. 1989; Soyer et al. 1992). False-positive results from FDG-PET in the liver are rare and occur primarily in hepatic abscesses. Delbeke et al. reported a lower sensitivity (91 vs 97 %) but higher specificity (95 vs 50 %) for FDG-PET resulting in a superior overall diagnostic accuracy compared to contrast-enhanced CT (Delbeke et al. 1997). In the study of Topal et al., PET was shown to be capable of detecting liver metastases with 99 % sensitivity (Topal et al. 2001). Several studies have compared the accuracy of FDG-PET and CT in the detection of hepatic metastases (Arulampalam et al. 2004; Bohm et al. 2004; Ogunbiyi et al. 1997). Overall, FDG-PET was more accurate than CT. Ogunbiyi et al. reported high sensitivity (95 %) and specificity (100 %) of FDG-PET for detecting liver metastases. In their study, the sensitivity and specificity of CT were 74 and 85 %, respectively (Ogunbiyi et al. 1997). In a meta-analysis, Kinkel et al. compared ultrasonography, CT, MRI, and FDG-PET in the detection of hepatic metastases from colorectal, gastric, and esophageal cancer (Kinkel et al. 2002). In this study, the sensitivity of the modalities with specificity higher than 85 % was 55 % for ultrasonography, 72 % for CT, 76 % for MRI, and 90 % for FDG-PET.
Related posts:
 and Requirements of Hospitals Performing Radioembolization
for Combining Radioembolisation with Systemic Chemotherapy for Metastatic Colorectal Cancer
in Liver Metastatic Colorectal Cancer
and Requirements of Hospitals Performing Radioembolization
for Combining Radioembolisation with Systemic Chemotherapy for Metastatic Colorectal Cancer
in Liver Metastatic Colorectal Cancer
 Liver Disease
 of the Response by Multimodality Imaging
 Medicine Procedures for Treatment Evaluation and Administration
Stay updated, free articles. Join our Telegram channel

Full access? Get Clinical Tree


