ABSTRACT
Objective
Early detection and monitoring of hepatic steatosis can help establish appropriate preventative measures against progression to more advanced disease. We aimed to develop a deep learning (DL) program for classification of hepatic steatosis from standard-of-care grayscale ultrasound (US) images.
Methods
In this single-center retrospective study, we utilized grayscale US images from January 1, 2010, to October 23, 2022, labeled with magnetic resonance imaging (MRI) proton density fat fraction (MRI-PDFF) to develop a DL multi-instance program for differentiating normal (S0) from steatotic liver (S1/2/3) and normal/mild steatosis (S0/1) from moderate/severe steatosis (S2/3). Diagnostic performances were assessed with area under the receiver operating characteristic curves (AUC), sensitivity, specificity and balanced accuracy with 95% confidence interval (CI).
Results
A total of 403 patients with 403 US exams were included: 171 (42%) were normal (S0: MRI-PDFF <5%), 154 (38%) had mild steatosis (S1: MRI-PDFF 5–17.4%), 29 (7%) had moderate steatosis (S2: MRI-PDFF >17.4%–22.1%) and 49 (12%) had severe steatosis (S3: MRI-PDFF >22.1%). The dataset was split to include 322 patients in train/validation and 81 patients in a holdout test set (kept blind). The S0 versus S1/2/3 model achieved 81.3% (95% CI 72.1–90.5) AUC, 81.1% (70.6–91.6) sensitivity, 71.4% (54.7–88.2) specificity and 76.3% (66.4–86.2) balanced accuracy. The S0/1 versus S2/3 model achieved 95.9% (89–100) AUC, 87.5% (71.3–100) sensitivity, 96.9% (92.7–100) specificity and 92.2% (83.8–100) balanced accuracy. A multi-class model achieved a sensitivity of 71.4% (54.7–88.2) for S0, 67.6% (52.5–82.7) for S1 and 87.5% (71.3–100) for S2/3; specificity for the same model was 81.1% (70.6–91.6) for S0, 77.3% (64.9–89.7) for S1 and 96.9% (92.7–100) for S2/3.
Conclusion
Our DL program offered high sensitivity and accuracy in detecting and categorizing hepatic steatosis from standard-of-care ultrasound.
- 1.
Our deep learning model can detect hepatic steatosis from normal with 81.1% sensitivity and 76.3% balanced accuracy.
- 2.
The model can detect normal/mild steatosis from moderate/severe steatosis with 92.2% balanced accuracy.
- 3.
The multi-class model achieved the highest sensitivity (87.5%) and specificity (96.9%) for detecting moderate/severe steatosis.
Introduction
Hepatic steatosis is a common disease worldwide with various etiologies including alcohol use, metabolic syndrome, viral infection and medication use [ ]. Patients with hepatic steatosis can develop inflammation and fibrosis, which are risk factors for cirrhosis and hepatocellular carcinoma [ ]. Early detection and monitoring of hepatic steatosis could help establish appropriate preventative measures against progression. Magnetic resonance imaging proton density fat fraction (MRI-PDFF) has become the best noninvasive method to quantify fat in the liver [ ]. However, MRI also has disadvantages such as long acquisition time, high cost and limited availability, especially in low-resource settings. Ultrasound (US) can serve as a first-line screening modality for liver disease because it is fast, portable and low-cost.
Currently, the standard practice to evaluate hepatic steatosis on US is a qualitative assessment by radiologists on grayscale images [ ]. This is prone to inter-/intrareader variability [ , ], and calibration and discriminative accuracy can vary greatly [ , ]. Recent emerging quantitative US technologies include hepatorenal index, backscatter coefficient, sound-speed estimation, and attenuation imaging. Some are already available but vendor-specific, limited to specific circumstances, or in need of further external validation, especially in diverse patient populations with different health and demographic/ethnic backgrounds [ , ].
Machine learning-based methods can enable novel approaches for detection, classification and quantification of hepatic steatosis and have been demonstrated on several US-based data types including radiofrequency and standard B-mode images [ ]. While access to RF and raw US data is limited, B-mode grayscale data is readily available on a Pictures Archiving and Communication System (PACS) and is part of the standard routine US exams. Enabling machine learning methods to automatically detect and classify hepatic steatosis during a routine US exam with a model deployed on a PACS could significantly enhance radiologists’ productivity by automatically highlighting cases that require special attention (especially for training radiologists or those do not specialize in reading US), reduce interpretation variability and increase accuracy [ ]. While some modeling attempts to do so have been introduced, the limitations of these models include variable reference standards, training set label accuracy, training set size and difficulty implementing them into clinical practice [ ]. Here, we introduce a deep learning (DL) multi-instance model for automated detection and grading of hepatic steatosis from B-mode US images that is trained on data labeled using MRI-PDFF to standardize measurement methods and to remove human reader variability. This model could be integrated seamlessly into a PACS, providing automated, precise and accurate evaluation of hepatic steatosis.
Materials and methods
Data to train, validate and test our model was obtained through a single-center, retrospective protocol approved by the Institutional Review Board and compliant with the Health Insurance Portability and Accountability Act. Informed consent was waived due to the study’s retrospective nature. This study followed the Standards for Reporting of Diagnostic Accuracy Studies 2015 guidelines [ ].
MRI-PDFF reference standard
MRI-PDFF is routinely acquired on all MRI abdomen and liver protocols. Images were acquired on a 3T magnet from GE (GE HealthCare, Chicago, IL, USA), Phillips (Philips HealthCare, Best, The Netherlands) or Siemens (Siemens Healthineers, Erlangen, Germany). A fat fraction from MRI-PDFF was extracted from MRI reports as the reference standard. For steatosis grades S0–S3 (normal-severe), we used the following MRI-PDFF cut-off values: S0 (normal) fat fraction <5%, S1 (mild) fat fraction ≥5%–17.4%, S2 (moderate) fat fraction >17.4%–22.1% and S3 (severe) fat fraction >22.1% [ , ].
Clinical-standard US dataset
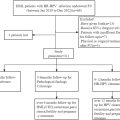
The electronic medical record was searched from January 1, 2010, to January 1, 2022, for all adult patients who underwent abdominal or liver MRI with MRI-PDFF and abdominal US within 12 weeks and with available body mass index (BMI) within 12 weeks of the MRI and US exams. An additional search was performed from January 1, 2022, to October 23, 2022, for patients with the above criteria to include more patients with MRI-PDFF >17.4% (moderate and severe steatosis). Patients were excluded due to significant BMI change between the MRI and US exams (>5% absolute value change) [ , ], insufficient normal liver parenchyma (right lobe especially), status post liver transplant, or pregnancy ( Fig. 1 ). All patients were included only once (the most recent US exam). Due to the low prevalence of moderate and severe steatosis, all patients with moderate and severe steatosis (MRI-PDFF >17.4%) were grouped into a single label. Patients with normal liver and mild steatosis were randomized.

B-mode grayscale liver images were acquired as a general abdominal or dedicated liver protocol using either GE Logiq E9 or E10 (GE Healthcare, Wausheka, WI, USA) or Canon Aplio i800 (Canon Medical Systems USA, Inc, Tustin, CA, USA). Patient age, sex, BMI, ethnicity, presence of cirrhosis (clinical diagnosis), and risk factors for diffuse liver disease were collected.
Image preparation
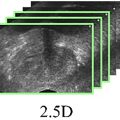
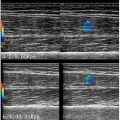
Data extracted from PACS included single-image JPGs/TIFF and DICOM (in transverse and longitudinal views), and multi-image cinematic clips in the form of AVIs or DICOMs. Multi-image files were separated into individual frames to facilitate input into developed models. Images were cropped to remove extraneous text, retaining the majority of the liver parenchyma. Images were then resized to 224 pixels by 224 pixels. Figure 2 shows representative images.

Data splits for training, validation and testing
Figure 3 a shows the partitioning and flow of image data. The holdout (i.e., test) set was prepared by stratifying 20% of the total patient dataset (15,874 images, 81 patients) by steatosis category, and consisted of 28 S0 patients, 37 S1 patients and 16 S2–3 patients This ensured that the holdout contained approximately the same steatosis category distribution as the remaining 80% of the data (81,147 images, 322 patients, which were used for training and cross-validation), which consisted of 143 S0 patients, 117 S1 patients and 62 S2/3 patients. Patients in the holdout set (i.e., test set) were not included in training or validation sets; all data was stratified by patient.

Multi-instance binary model architecture
Our model followed a multi-instance-like methodology; such methods are used when labels are only available for a group of “instances” that together form what is known as a “bag” [ , ]. In multi-instance learning, the model aims to classify the bag by considering each instance belonging to that bag [ ]. Here, patients were treated as bags, and individual frames/images were treated as instances within a bag. Two multi-instance binary models were developed, one distinguishing between S0 and S1/S2/S3 patients and another distinguishing between S0/S1 and S2/S3 patients. Both models were combined to yield a final multi-class prediction based on a rule system.
Figure 3 b illustrates how each binary model was composed of a frame-level model yielding predictions on individual images, followed by pooling by patient and feature computation layer. Similar to Mazaki et al. and Huertas-Tato et al., these grouped statistics served as inputs into a Histogram-based Gradient Boosting Classification Tree, yielding a binary patient-level prediction for each group [ , ]. This particular patient-level predictor was selected due to superior cross-validation performance when compared to alternatives such as simple averaging of frame-level probabilities, SVMs, Decision Trees and Random Forests. The frame-level model was based on a deep convolutional neural network (CNN) with weights pretrained on ImageNet [ ]. Various architectures were evaluated in this phase, including ConvNeXt, MobileNetV3, Resnet, VGG and Visual Transformers, with MobileNetV3 being selected due to superior frame-level performance. The model was fitted with balanced class weights. Pooling between frame-level and patient-level was necessary to account for variations in the number of frames (instances) per patient. The patient-level features used as input to the patient-level model were computed from the frame-level output probabilities and comprised of statistical summaries of those probabilities (described below). A 4-fold cross-validation was performed via a grid search to tune the parameters of the patient-level model to maximize the sensitivity at a threshold of 0.5 [19]. Afterward, the model was trained on the entire patient dataset after holdout extraction and evaluated on the holdout dataset.
The features computed for each patient-level grouping included the following 19 statistical summaries obtained from the prediction probabilities (i.e., output of frame-level model) across all frames for a patient: minimum, maximum, range, mean, variance, sample standard deviation, geometric mean, geometric standard deviation, harmonic mean, standard error of the mean, coefficient of variation, median, interquartile range, mode, sample skewness, kurtosis, Shannon entropy, differential entropy and median absolute deviation.
Statistical analysis
For each patient-level binary model, we computed receiver operating characteristic (ROC) curves to assess the discrimination of hepatic steatosis categories. The best model at a threshold of 0.5, was used to compute the binary balanced accuracy, sensitivity (recall) and specificity. Multi-class confusion matrices (depicting accuracy percentages for each stage), balanced accuracy, sensitivity and specificity with 95% confidence interval (CI) were computed by combining the predictions from both binary models. All statistical analysis was done in Python using the scikit-learn module. For all experiments, the optimal operating output threshold was assumed to be 0.5.
Results
Training cohort baseline characteristics
A total of 403 patients with 403 US exams were included in the training set. Demographic and clinical background of patients are listed in Table 1 . A total of 59 (15%) patients were diagnosed with liver cirrhosis. Out of 403 patients, 171 (42%) patients had a normal liver (S0: MRI-PDFF <5%), 154 (38%) patients had mild steatosis (S1: MRI-PDFF 5–17.4%), 29 (7%) patients had moderate steatosis (S2: MRI-PDFF >17.4%–22.1%) and 49 (12%) patients had severe steatosis (S3: MRI-PDFF >22.1%). A total of 8438 static grayscale images and 1067 cinematic clips (each of variable size) were included for training. Examples of different categories of hepatic steatosis are shown in Figure 2 .
| Characteristics | Value |
|---|---|
| Age (y), median (IQR) | 53 (40–66) |
| Sex | |
| Female | 252 (63) |
| Male | 151 (37) |
| BMI (kg/m 2 ), median (IQR) | 29 (24.4–33.4) |
| Range | 16.8–51.8 |
| Ethnicity | |
| White | 151 (37) |
| Asian | 96 (24) |
| Black | 7 (2) |
| Hispanic/Latino (white) | 16 (4) |
| Hispanic/Latino (Other) | 93 (23) |
| American Indian or Alaska Native | 2 (<1) |
| Native Hawaiian or Other Pacific Islander | 4 (1) |
| Unknown/Others | 34 (8) |
| Presence of cirrhosis | 59 (15) |
| Risk factor of cirrhosis | |
| Hepatitis B | 30 (7) |
| Hepatitis C | 9 (2) |
| Alcohol | 43 (11) |
| MAFLD | 14 (3) |
| Cardiomyopathy | 1 (<1) |
| Autoimmune | 4 (1) |
| Biliary | 5 (1) |
| Congenital/genetic | 4 (1) |
| None/unknown | 293 (73) |
| US machine | |
| GE | 341 (85) |
| Canon | 62 (15) |
| Days between US and MRI, median (IQR) | 4 (1–27) |
| Range | 0–83 |
| MRI-PDFF (%), median (IQR), range | 6.4 (2.3–15), 0.5–48 |
| Normal (<5%) | 171 (42) |
| Mild (≥5%–17.4%) | 154 (38) |
| Moderate (>17.4%–22.1%) | 29 (7) |
| Severe (>22.1%) | 49 (12) |
Related posts:
 A Narrative Review of Image Processing Techniques Related to Prostate Ultrasound
 Efficacy and Safety of Focused Ultrasound Treatment for High-risk Human Papillomavirus Infection-related Cervical Intraepithelial Neoplasia Grade 2 in Nulligravidae Women: A Retrospective Study
 Assessing Intensive Care Unit Acquired Weakness: An Observational Study Using Quantitative Ultrasound Shear Wave Elastography of the Rectus Femoris and Vastus Intermedius
 Droplet-Based Liquid Extraction for Spatially-Resolved Microproteomics Analysis of Tissue Sections
 18 Ultrasound-Guided Interventional Procedures: Biopsy and Drainage
 Liver Transplant Hepatic Venous Stenosis/Thrombosis
Stay updated, free articles. Join our Telegram channel

Full access? Get Clinical Tree


