Fig. 4.1
a Simple hepatic cyst (arrows) with its typical posterior echo (*) and the echofree (black) content; b clear visibility of hypoechoic metastases (arrows) in a so-called ‘‘bright’’ (fatty) liver; middle hepatic vein (MHV); portal branch to the right anterior section (P5-8); right hepatic vein (RHV)
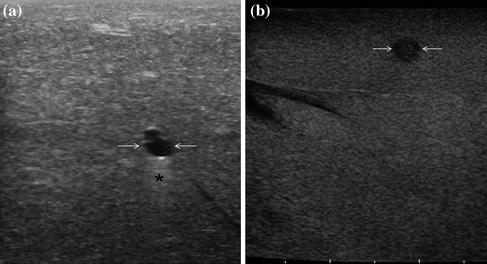
Fig. 4.2
A small, simple hepatic cyst (arrows) with its typical posterior echo (*) and the echo-free (black) content (a), compared to a tiny metastasis (arrows) (b)
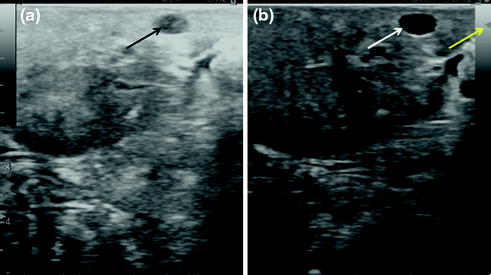
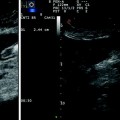
Fig. 4.3
a Importance of the regulation of the image setting especially if the focus is not adequately set (too deep for this particular case) and the gain too (too bright) where a cyst (black arrow) can mimic a solid lesion, while b once the ultrasound system is properly regulated (yellow arrow showing the focus level) the same lesions (white arrow) shows the typical features of a cysts as previously described
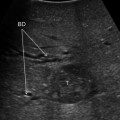
Even the round ligament appearing in a transverse scan as a hyperechoic target lesion may resemble a solid tumor (Fig. 4.4): its origin from the umbilical portion, its linear shape once the scan is sagittal would disclose its real nature. A frequent source of misinterpretation is represented by the so-called skip-areas, which are portions of the liver with different intracellular distribution of lipids resulting in areas with different echogenicity [1]. These areas are typically located around the gallbladder (Fig. 4.5) or around the main portal pedicles (Fig. 4.6): their shape, the fact that vessels are passing through without distortions, and, not last, the mentioned typical locations should ensure their proper interpretation. There is an artifact being a true optical illusion which is called the mirror effect : in cases where a lesion is just anterior to other structures being a barrier for the diffusion of the ultrasonic waves, a reflection of the lesion itself can appear posteriorly, mimicking the reflection of an image in front of a mirror both without (Fig. 4.7a, b) and with contrast enhancement (Fig. 4.8).
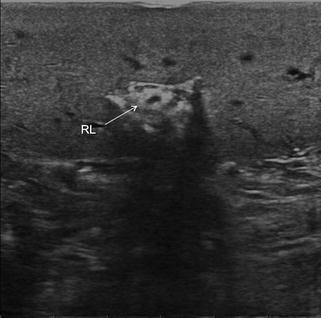
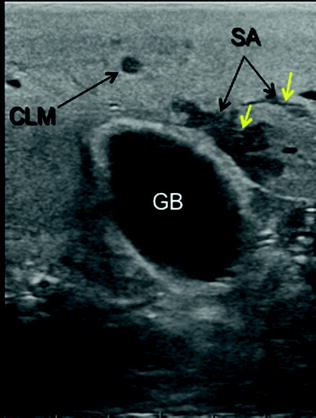
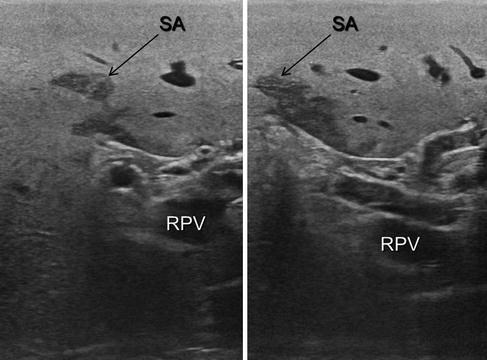
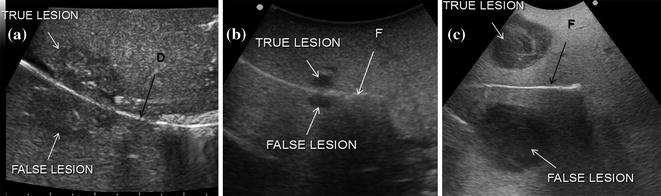
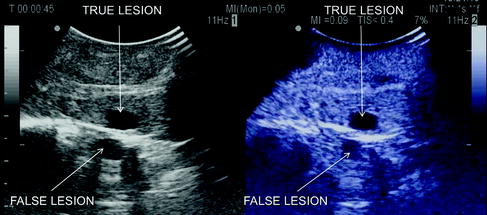
Fig. 4.4
Importance of understanding the anatomical structures and the need during ultrasound exploration of using several axes in investigating a lesion in order to avoid misinterpretation of its nature; otherwise, even the round ligament (RL) could mimic a target lesion
Fig. 4.5
The different appearance of skip-areas (SA) also referred to as focal steatosis, and a colorectal liver metastasis (CLM): while the SA is located in a typical position—adjacent to the gallbladder (GB)—and moreover assumes bizarre shapes with thin vessels (yellow arrows) passing through without being interrupted or deviated, the CLM is sharp and rounded
Fig. 4.6
Another typical location of skip-areas (SA): also located adjacent to the main glissonian sheaths; right portal vein (RPV)
Fig. 4.7
A classic artifact called mirror effect consisting of a real image and a virtual one caused by a reflecting interface such as diaphragm-lung (a), liver-finger for tiny (b) and large lesions (c); diaphragm (D); finger (F)
Fig. 4.8
A mirror effect evident also by CEIOUS
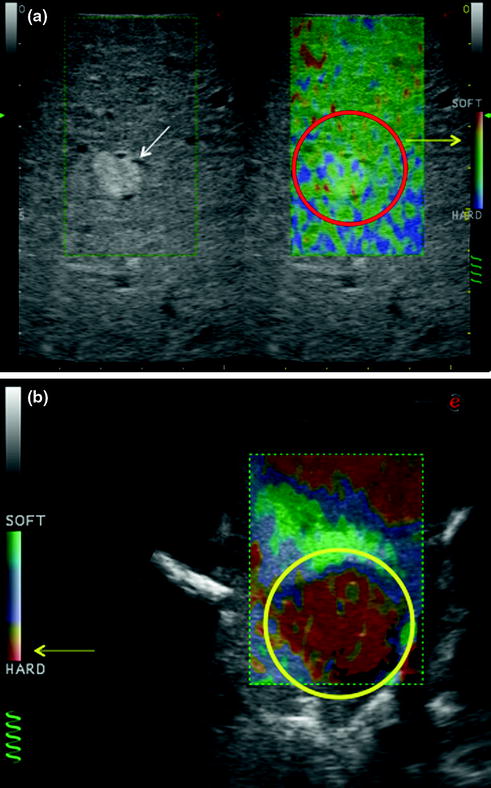
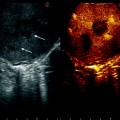
IOUS allows the detection of new lesions in around 30 % of cirrhotic patients [2]. However, most of the nodules detected by IOUS in these patients are not really tumors: in this way, IOUS introduces the risk of overestimating the tumor stage (Fig. 4.9). Indeed, except for those nodules with mosaic ultrasonographic patterns (Fig. 4.10a), which are malignant in 84 % of cases, only 24–30 % of hypoechoic nodules (Fig. 4.10b), and 0–18 % of those hyperechoic (Fig. 4.10c) are neoplasm [2, 3]. To overcome this problem even biopsy may not be adequate. The only nodule which can be easily differentiated intraoperatively from an HCC or a liver metastasis is the small hemangioma which is often discovered primarily by IOUS: it has a typical ultrasonographic pattern and moreover when compressed changes its size and appearance (Fig. 4.11a, b). This is based essentially on the different stiffness of the hemangioma compared to other lesions. Stiffness measurements are advantageous in this respect. In fact, intraoperative elastography can afford lesion differentiation based on tissue elasticity expressed on the IOUS screen by differences in colors (Fig. 4.12a, b). Therefore, some authors have introduced a classification for differentiating HCC from metastastic nodules based on their tissue elasticity at intraoperative elastography [4]. In this sense, other authors have proposed the use of elastography to check in real time the completeness of intraoperative tumor ablation [5]. Chapter 5 describes how CEIOUS is starting to play an important role in this respect, and most likely will become more relevant in the near future.
Get Clinical Tree app for offline access
Fig. 4.9
Cirrhotic liver with an inhomogeneous pattern due to the presence of an uncountable number of hypoechoic (dark) nodules
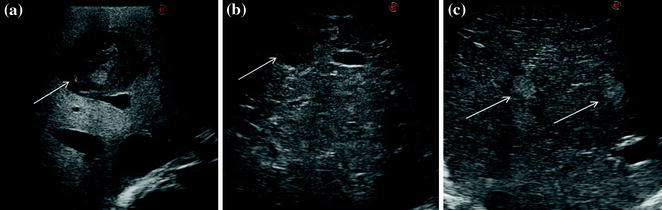
Fig. 4.10
a Nodule (arrow) with a mosaic pattern in IOUS; b nodule (arrow) with a hypoechoic pattern in IOUS; c two nodules (arrows) with a hyperechoic pattern in IOUS
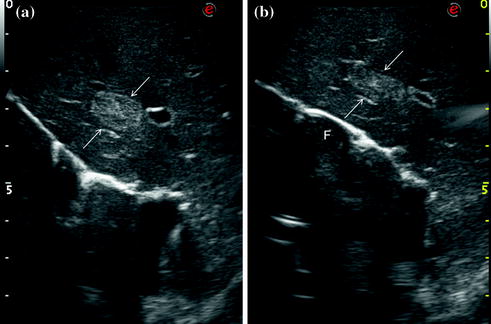
Fig. 4.11
Hemangioma diagnosis: a an hemangioma (arrows) with hyperechoic (bright) pattern, typical for this kind of lesion but not specific enough; b the lesion once compressed under IOUS guidance changes its shape and thickness (arrows)—this finding together with its echogenicity lead to the diagnosis of hemangioma; surgeon’s fingertip (F)
Fig. 4.12
The potential value of elastography in estimating tissue stiffness in reference to a color scale displayed on the side of each image; a hemangioma (arrow) expected to be soft, compressible as in Fig. 4.11; on the right, its softness is confirmed by elastography (red circle) according to the color scale (yellow arrow); b upon elastography of a metastastic tumor (yellow circle
 Liver Transplantation from Living Donors
 Technical Tricks to Start Exploring the Liver with Ultrasound
 Diagnosis and Staging: Contrast-Enhanced Intraoperative Ultrasound (CEIOUS) Using Intravascular Contrast Agents
 Technological Requirements for Ultrasound-Guided Liver Surgery
 Exploring the Liver by Ultrasound Along its Anatomy
 Liver Transplantation from Deceased Donors


Related posts:
Liver Transplantation from Living Donors
Technical Tricks to Start Exploring the Liver with Ultrasound
Diagnosis and Staging: Contrast-Enhanced Intraoperative Ultrasound (CEIOUS) Using Intravascular Contrast Agents
Technological Requirements for Ultrasound-Guided Liver Surgery
Exploring the Liver by Ultrasound Along its Anatomy
Liver Transplantation from Deceased Donors
Stay updated, free articles. Join our Telegram channel
Full access? Get Clinical Tree
