Diagnostic Imaging Methods
William E. Brant
Diagnostic radiology is a dynamic specialty that continues to undergo rapid change with ongoing advancements in technology. Not only has the number of imaging methods increased, but each one continues to undergo improvement and refinement of its use in medical diagnosis. This chapter reviews the basics of the major diagnostic imaging methods and provides the basic principles of image interpretation for each method. Contrast agents commonly used in diagnostic radiology are also discussed. The basics of nuclear radiology are discussed in later chapters.
Conventional Radiography
Conventional radiographic examination of the human body dates back to the genesis of diagnostic radiology in 1895 when Wilhelm Roentgen produced the first x-ray film image of his wife’s hand. Conventional radiography remains fundamental to the practice of diagnostic imaging.
Image Generation. X-rays are a form of radiant energy similar in many ways to visible light. X-rays differ from visible light in that they have a very short wavelength and are able to penetrate many substances that are opaque to light. The x-ray beam is produced by bombarding a tungsten target with an electron beam within an x-ray tube (1).
Film Radiography. Conventional film radiography utilizes a screen-film system within a film cassette as the x-ray detector. As x-rays pass through the human body they are attenuated by interaction with body tissues (absorption and scatter) and produce an image pattern on film that is recognizable as human anatomy. X-rays transmitted through the patient bombard a fluorescent particle–coated screen within the film cassette, thus causing a photochemical interaction that emits light rays, which expose photographic film within the cassette (Fig. 1.1). The film is removed from the cassette and developed by an automated chemical film processor. The final product is an x-ray image of the patient’s anatomy on a film (Fig. 1.2).
Computed Radiography (CR) is a filmless system that eliminates chemical processing and provides digital radiographic images. CR substitutes a phosphor imaging plate for the film-screen cassette (2,3). Available CR cassette sizes match those available for traditional film-screen cassettes. The same gantry, x-ray tube, exposure control systems, and cassette holders as used in conventional radiography are used for CR. The phosphor-coated imaging plate interacts with x-rays transmitted through the patient to capture a latent image. The phosphor plate is placed within a reading device that scans the plate with a helium-neon laser, emitting light, which is captured by a photomultiplier tube and processed into a digital image. The CR receptor is erased with white light and is used repeatedly. The digital image is transferred to a computerized picture archiving and communication system (PACS). The PACS stores and transmits digital images via computer networks to give physicians and health care providers in many locations simultaneous instant access to the diagnostic images.
Digital Radiography (DR) provides a filmless and cassetteless system for capturing x-ray images in digital format (2). DR substitutes a fixed electronic detector or charge-coupled device (CCD) for the film-screen cassette or phosphor imaging plate. Direct read-out detectors produce an immediate digital radiographic image. Most DR detectors are installed in a fixed gantry, thus limiting the ability of the system to obtain images portably at the patient’s bedside. CR is generally used for that purpose in a digital imaging department. Direct digital image capture is particularly useful for angiography providing rapid digital image subtraction and for fluoroscopy capturing video images with low, continuous radiation.
Fluoroscopy enables real-time radiographic visualization of moving anatomic structures. A continuous x-ray beam passes through the patient and falls onto a fluorescing screen (Fig. 1.3). The faint light pattern emitted by the fluorescing screen is amplified electronically by an image intensifier, and the image is displayed on a television monitor and recorded digitally as a single or series of images for real-time viewing, that is, a movie or “cinefluoroscopy.” Fluoroscopy is extremely useful to evaluate motion such as gastrointestinal (GI) peristalsis, movement of the diaphragm with respiration, and cardiac action. Fluoroscopy is also used to perform and monitor continuously radiographic procedures such as barium studies and catheter placements. Most fluoroscopic systems are now entirely digital. Video and static fluoroscopic images are routinely stored in digital format on a PACS.
Conventional Angiography involves the opacification of blood vessels by intravascular injection of iodinated contrast agents. Conventional arteriography uses small flexible catheters
that are placed in the arterial system usually via puncture of the femoral artery in the groin. With the use of fluoroscopy for guidance, catheters of various sizes and shapes can be manipulated selectively into virtually every major artery. Contrast injection is performed by hand or by mechanical injector and is accompanied by timed rapid-sequence filming or digital computer acquisition (DR) of the fluoroscopic image. The result is a timed series of images depicting contrast flow through the artery injected and the tissues that the artery
supplies. Conventional venography is performed by contrast injection of veins via distal puncture or selective catheterization.
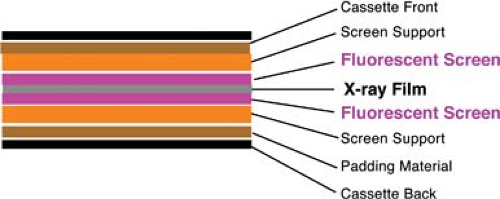 Figure 1.1. X-ray Film Cassette. Diagram demonstrates a sheet of x-ray film between two fluorescent screens within a light-proof cassette. |
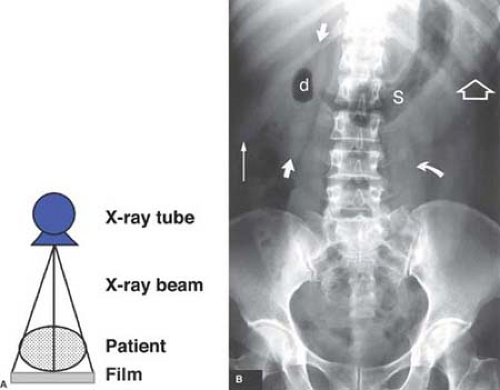 Figure 1.2. Conventional Radiography. A. Diagram of an x-ray tube producing x-rays that pass through the patient and expose the radiographic film. For digital radiography, a phosphor imaging plate or fixed electronic detector takes the place of the film cassette. B. Supine AP radiograph of the abdomen reveals the patient’s anatomy because anatomic structures differ in their capacity to attenuate x-rays that pass through the patient. The stomach (S) and duodenum (d) are visualized because air in the lumen is of different radiographic density than the soft tissues that surround the GI tract. The right kidney (between short straight arrows), edge of the liver (long straight arrow), edge of the spleen (open arrow), and the left psoas muscle (curved arrow) are visualized because fat outlines the soft-tissue density of these structures. The bones of the spine, pelvis, and hips are clearly seen through the soft tissues because of their high radiographic density. |
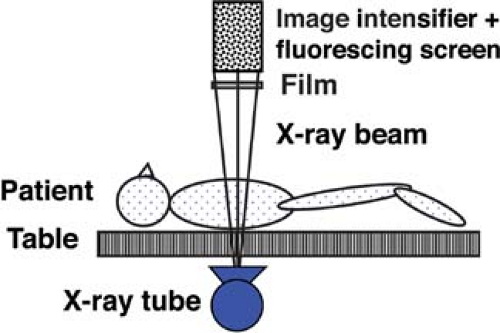 Figure 1.3. Fluoroscopy. Diagram of a fluoroscopic unit illustrates the x-ray tube located beneath the patient examination table and the fluorescing screen with the image intensifier positioned above the patient. Amplification of the faint fluorescing image by the image intensifier allows the radiation exposure to the patient to be kept at low levels during fluoroscopy. The real-time fluoroscopic images are viewed on a television monitor and may be recorded on videotape. Radiographs are obtained by digital image capture or by placing a film cassette between the patient and the image intensifier and exposing the image receptor with a brief pulse of radiation. |
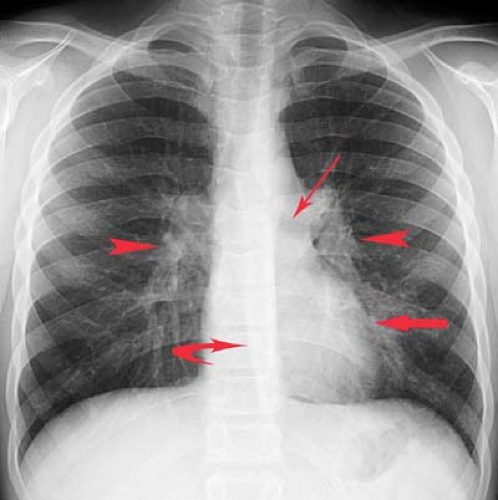 Figure 1.4. Erect PA Chest Radiograph. The pulmonary arteries (arrowheads) are seen in the lung because the vessels are outlined by air in alveoli. The left cardiac border (fat arrow) is crisply defined by adjacent air-filled lung. The left main bronchus (skinny arrow) is seen because its air-filled lumen is surrounded by soft tissue of the mediastinum. The azygoesophageal recess (curved arrow) is well defined by air-filled lung of the right lower lobe. |
Naming Radiographic Views. Most radiographic views are named on the basis of the way that the x-ray beam passes through the patient. A posteroanterior (PA) chest radiograph is one in which the x-ray beam passes through the back of the patient and exits through the front of the patient to expose an x-ray detector positioned against the patient’s chest. An anteroposterior (AP) chest radiograph is exposed by an x-ray beam passing through the patient from front to back. A craniocaudad (CC) mammogram is produced by passing a beam through the breast in a vertical, cranial to caudad, direction with the patient standing or sitting. Views are additionally named by identifying the position of the patient. Erect, supine, or prone views may be specified. A right lateral decubitus view of the chest is exposed with a horizontal x-ray beam passing through the chest of a patient lying on his or her right side. Radiographs taken during fluoroscopy are named on the basis of the patient’s position relative to the fluoroscopic table because the x-ray tube is positioned beneath the table. A right posterior oblique (RPO) view is taken with the patient lying with the right side of his or her back against the table and the left side elevated away from the table. The x-ray beam generated by the x-ray tube located beneath the table passes through the patient to the x-ray cassette or detector located above the patient.
Principles of Interpretation. Conventional radiographs demonstrate five basic radiographic densities: air, fat, soft tissue, bone, and metal (or x-ray contrast agents). Air attenuates very little of the x-ray beam, allowing nearly the full force of the beam to blacken the image. Bone, metal, and radiographic contrast agents attenuate a large proportion of the x-ray beam, allowing very little radiation through to blacken the image. Thus, bone, metallic objects, and structures opacified by x-ray contrast agents appear white on radiographs. Fat and soft tissues attenuate intermediate amounts of the x-ray beam, resulting in proportional degrees of image blackening (shades of gray). Thick structures attenuate more radiation than thin structures of the same composition. Anatomic structures are seen on radiographs when they are outlined in whole or in part by tissues of different x-ray attenuation. Air in the lung outlines pulmonary vascular structures, producing a detailed pattern of the lung parenchyma (Fig. 1.4). Fat within the abdomen outlines the margins of the liver, spleen, and kidneys, allowing their visualization (Fig. 1.2B). The high density of bones enables visualization of bone details through overlying soft tissues. Metallic objects such as surgical clips are usually clearly seen because they highly attenuate the x-ray beam. Radiographic contrast agents are suspensions of iodine and barium compounds that highly attenuate the x-ray beam and are used to outline anatomic structures. Disease states may obscure normally visualized anatomic structures by silhouetting their outline. Pneumonia in the right middle lobe of the lung replaces air in the alveoli with fluid and silhouettes the right heart border (Fig. 1.5) (4).
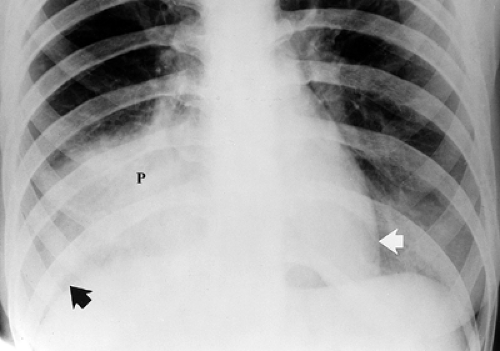 Figure 1.5. Right Middle Lobe and Left Lower Lobe Pneumonia. PA erect chest radiograph demonstrates pneumonia (P) in the right middle lobe replacing the lucency of air in the lung with soft-tissue density and silhouetting the right heart border. The dome of the right hemidiaphragm (black arrow) is defined by air in the normal right lower lobe and remains visible through the right middle lobe infiltrate. The left heart border (white arrow), defined by air in the lingula, remains well defined despite infiltrate in the left lower lobe. |
Cross-Sectional Imaging Techniques
CT, MR, and US are techniques that produce cross-sectional images of the body. All three interrogate a three-dimensional volume or slice of patient tissue to produce a two-dimensional image. The resulting image is made up of a matrix of picture elements (pixels), each of which represents a volume element (voxel) of patient tissue. The tissue composition of the voxel is averaged (volume averaged) for display as a pixel. CT and MR assign a numerical value to each picture element in the matrix. The matrix of picture elements that make up each image is usually between 128 × 256 (32,768 pixels) and 560 × 560 (313,600 pixels), determined by the specified acquisition parameters (Fig. 1.6).
To produce an anatomic image, shades of gray are assigned to ranges of pixel values. For example, 16 shades of gray may be divided over a window width of 320 pixel values (Fig. 1.7). Groups of 20 pixel values are each assigned one of the 16
gray shades. The middle gray shade is assigned to the pixel values centered on a selected window level. Pixels with values greater than the upper limit of the window width are displayed white, and pixels with values less than the lower limit of the window width are displayed black. To analyze optimally all of the anatomic information of any particular slice, the image is viewed at different window-width and window-level settings optimized for bone, air-filled lung, soft tissue, and so forth (Fig. 1.8).
gray shades. The middle gray shade is assigned to the pixel values centered on a selected window level. Pixels with values greater than the upper limit of the window width are displayed white, and pixels with values less than the lower limit of the window width are displayed black. To analyze optimally all of the anatomic information of any particular slice, the image is viewed at different window-width and window-level settings optimized for bone, air-filled lung, soft tissue, and so forth (Fig. 1.8).
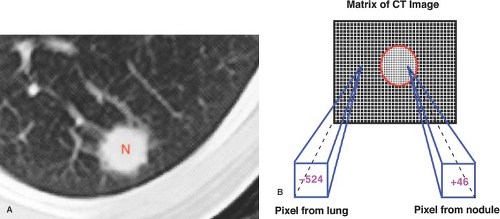 Figure 1.6. Image Matrix. A. Magnified CT image of a pulmonary nodule (N). The pixels that make up the image are evident as tiny squares within the image. The window width is set at 2000 H with a window level of -600 H to accentuate visualization of the white soft-tissue nodule on a background of gray, air-filled lung. B. Diagram of the matrix that constitutes the CT image. A pixel from air-filled lung with a calculated CT number of -524 H is gray, whereas a pixel from the soft-tissue nodule with a calculated CT number of +46 H is white. |
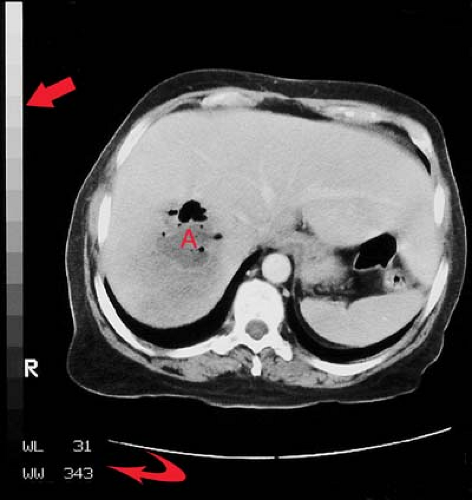 Figure 1.7. Gray Scale. A CT image of the abdomen includes a gray scale (straight arrow) along its left edge. Each individual pixel in the CT image is assigned a shade of gray depending on its calculated CT number (H unit) and the window width and window level (WW, WL, curved arrow) selected by the CT operator. Pure white and pure black are at the top and bottom of the gray scale. R indicates the patient’s right side. Cross-sectional images in the transverse plane are routinely viewed from “below,” as if standing at the patient’s feet. This orientation allows easy correlation with plain film radiographs, which are routinely viewed as if facing the patient with the patient’s right side to the viewer’s left. This patient has an abscess (A) in the liver. |
The digital images obtained by CT, MR, and US examination are ideal for storage and access on PACS. Current PACS allow a broad range of image manipulation while viewing and interpreting images. Among the features that can be used are interactive alterations in window width and window level, magnification, fusing of images from different modalities, reformatting serial images in different anatomic planes, creating three-dimensional reconstructions, and marking key images that summarize major findings.
Computed Tomography
CT uses a computer to reconstruct mathematically a cross-sectional image of the body from measurements of x-ray transmission through thin slices of patient tissue. CT displays each imaged slice separately, without the superimposition of blurred structures that is seen with conventional tomography. A narrow, well-collimated beam of x-rays is generated on one side of the patient (Fig. 1.9). The x-ray beam is attenuated by absorption and scatter as it passes through the patient. Sensitive detectors on the opposite side of the patient measure x-ray transmission through the slice. These measurements are systematically repeated many times from different directions while the x-ray tube is pulsed as it rotates 360° around the patient. CT numbers are assigned to each pixel in the image by a computer algorithm that uses as data these measurements of transmitted x-rays. CT pixel numbers are proportional to the
difference in average x-ray attenuation of the tissue within the voxel compared with that of water. A Hounsfield unit (H) scale, named for Sir Godfrey Hounsfield, the inventor of CT, is used. Water is assigned a value of 0 H, with the scale extending from -1024 H for air to +3000–4000 H for very dense bone. Hounsfield units are not absolute values but, rather, are relative values that may vary from one CT system to another. In general, bone is +400 to +1000 H, soft tissue is +40 to +80 H, fat is -60 to -100 H, lung is -400 to -600 H, and air is -1000 H.
difference in average x-ray attenuation of the tissue within the voxel compared with that of water. A Hounsfield unit (H) scale, named for Sir Godfrey Hounsfield, the inventor of CT, is used. Water is assigned a value of 0 H, with the scale extending from -1024 H for air to +3000–4000 H for very dense bone. Hounsfield units are not absolute values but, rather, are relative values that may vary from one CT system to another. In general, bone is +400 to +1000 H, soft tissue is +40 to +80 H, fat is -60 to -100 H, lung is -400 to -600 H, and air is -1000 H.
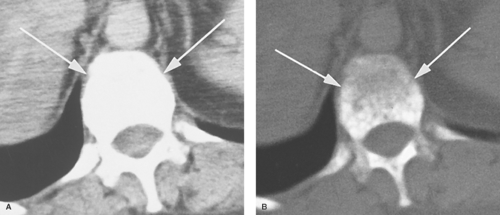 Figure 1.8. CT Windows. A. A CT image of the upper abdomen photographed with “soft tissue windows” (window width = 482 H and window level = -14 H) portrays a thoracic vertebra (arrows) entirely white with no bone detail. B. The same CT image rephotographed with “bone windows” (window width = 2000 H and window level = 400 H) demonstrates destructive changes in the vertebral body (arrows) owing to metastatic lung carcinoma. |
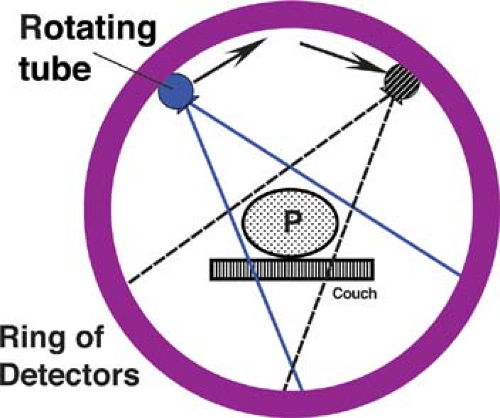 Figure 1.9. Computed Tomography. Diagram of a CT scanner. The patient (P) is placed on an examination couch within the core of the CT unit. An x-ray tube rotates 360° around the patient, producing pulses of radiation that pass through the patient. Transmitted x-rays are detected by a circumferential bank of radiation detectors. X-ray transmission data are sent to a computer, which uses an assigned algorithm to calculate the matrix of CT numbers used to produce the anatomic cross-sectional image. With helical CT scan technique, the patient couch moves the patient continuously through the rotating x-ray beam. With multidetector CT, multiple image slices are obtained simultaneously as the patient is moved through the scanner. |
Voxel dimensions are determined by the computer algorithm chosen for reconstruction and the thickness of the scanned slice. Most CT units allow slice thickness specifications between 0.5 and 10 mm. Data for an individual slice, 360° tube rotation, are routinely acquired in 1 second or less. Advantages of CT compared with MR include rapid scan acquisition, superior bone detail, and demonstration of calcifications. CT scanning is generally limited to the axial plane; however, images may be reformatted in sagittal, coronal, or oblique planes or as three-dimensional images. Multidetector CT allows the acquisition of cube-shaped isotropic voxels of equal length on all three sides. Isotropic voxels allow direct image reconstruction in any plane without loss of resolution (5).
Conventional CT (single-slice CT) obtains image data one slice at a time (6). The patient holds his or her breath, a slice is taken, the patient breathes, the table moves, and the sequence is repeated. This technique requires at least two to three times the total scanning time of helical CT for any given patient scan volume, making optimization of scanning during maximum contrast more difficult. Minor changes in lung volume with each breath-hold may make substantial changes in the chest and abdomen anatomy scanned, resulting in “skip” areas. More recent conventional scanners can simulate helical scanning by “cluster” technique. Several sequential scans are obtained during a single breath-hold.
Helical CT, also called spiral CT, is performed by moving the patient table at a constant speed through the CT gantry while scanning continuously with an x-ray tube rotating around the patient. A continuous volume of image data is acquired during a single breath-hold. This technique dramatically improves the speed of image acquisition, enables scanning during optimal contrast opacification, and eliminates artifacts and errors caused by misregistration and variations in patient breathing. The entire liver may be scanned in a single breath-hold; the
entire abdomen and pelvis, in one or two breath-holds, all with optimal timing for organ opacification following intravenous (IV) contrast administration. Volume acquisition enables retrospective reconstruction of multiple overlapping slices, improving visualization of small lesions and allowing high-detail three-dimensional CT angiography (Fig. 1.10) (7). Scans can be obtained during multiple phases of organ enhancement; arterial, venous, parenchymal, delayed.
entire abdomen and pelvis, in one or two breath-holds, all with optimal timing for organ opacification following intravenous (IV) contrast administration. Volume acquisition enables retrospective reconstruction of multiple overlapping slices, improving visualization of small lesions and allowing high-detail three-dimensional CT angiography (Fig. 1.10) (7). Scans can be obtained during multiple phases of organ enhancement; arterial, venous, parenchymal, delayed.
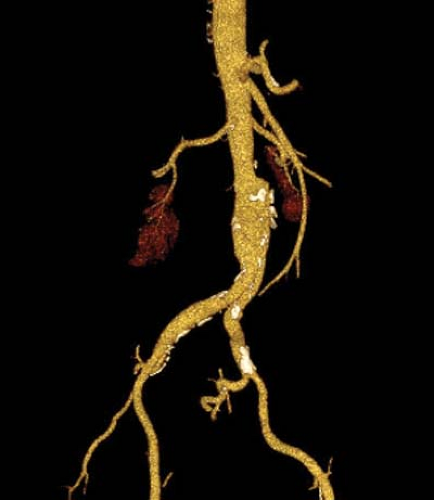 Figure 1.10. CT Angiogram. A three-dimensional, shaded surface display, angiogram image of the aorta and its branches was created from a series of axial plane MDCT images obtained during rapid bolus IV contrast agent administration. Contrast enhancement greatly increases the CT numbers of the arteries and kidneys and allows removal of structures with lower CT density from the image by “thresholding.” Only pixels with CT numbers higher than a specified threshold value are displayed. Computer algorithms create a “virtual” three-dimensional image from data provided by many overlapping axial slices. The three-dimensional image can be rotated and viewed from any desired angle. “Shading,” simulating light cast from a remote light source, enhances the three-dimensional visual effect. This patient has advanced atherosclerosis and a small aneurysm of the infrarenal abdominal aorta. |
Multidetector Helical CT (MDCT) is a major technical advance in CT imaging, utilizing the principles of the helical scanner but incorporating multiple rows of detector rings (8). This technique allows acquisition of multiple slices per tube rotation increasing the area of the patient that can be covered in a given time by the x-ray beam. Available systems have moved quickly from 2-slice to 64-slice, which covers 40 mm of patient length for each 1-second or less rotation of the tube. Prototype 256-detector scanners are being developed. The current workhorse MDCT scanned in most departments is the 16-slice scanner, with 64-slice scanners (applicable to cardiac applications like coronary angiography) becoming increasingly prevalent. The key advantage of MDCT is speed. It is five to eight times faster than single-slice helical CT. For body scanning, 1-mm slices can be obtained creating isotropic voxels (1 × 1 × 1 mm) allowing image reconstruction in any anatomic plane without loss of resolution (5). Broad area coverage allows for high-detail CT angiography and “virtual” CT colonoscopy and bronchoscopy. Nothing is free, however, and a significant disadvantage of MDCT is radiation dose, which can be three to five times higher with MDCT than with single-slice CT. Thin slices and multiple acquisition add great diagnostic capability but at the cost of increased radiation dose to the patient.
CT Fluoroscopy is another advancement in CT technology that allows for real-time CT imaging (9). This technique dramatically improves the ability to perform percutaneous interventions quickly and at a generally lower radiation dose than with conventional CT. The operator can step on a floor pedal while moving the CT table or observing patient motion. Rapid image reconstruction provides real-time images of anatomy, lesions, and needle or catheter placement. CT fluoroscopy is now routinely used to guide biopsy, drainage, and interventional procedures anywhere in the body. It is particularly useful in guidance of needle placements where there is physiologic motion such as in the chest and abdomen.
Dual-Energy CT (dual-source CT) utilizes two x-ray sources and two x-ray detectors to simultaneously interrogate tissues to determine how tissue behave at different radiation energies (10). This technique adds information about tissue composition. Differences in fat, soft tissue, and contrast agents at different energy levels expands lesion conspicuity and characterization. Image data can be captured in half the time required for conventional MDCT. This vastly improves the ability to image the heart without the use of potentially dangerous beta-blockers to slow the heart rate. The chemical composition of urinary calculi can be determined allowing selection of medical versus surgical treatment (11). Radiation dose may be reduced if image acquisitions, such as precontrast scanning, are eliminated.
Contrast Administration in CT. IV iodine-based contrast agents are administered in CT to enhance density differences between lesions and surrounding parenchyma, to demonstrate vascular anatomy and vessel patency, and to characterize lesions by their patterns of contrast enhancement. Optimal use of IV contrast depends upon the anatomy, physiology, and pathology of the organ of interest. In the brain, the normal blood–brain barrier of tight neural capillary endothelial junctions prevents access of contrast into the neural extravascular space. Defects in the blood–brain barrier associated with tumors, stroke, infection, and other lesions enable contrast accumulation within abnormal tissue, improving its visibility. In nonneural tissues, the capillary endothelium has loose junctions, enabling free access of contrast into the extravascular space. Contrast administration and timing of CT scanning must be carefully planned to optimize differences in enhancement patterns between lesions and normal tissues. For example, most liver tumors are predominantly supplied by the hepatic artery, whereas the liver parenchyma is predominantly supplied by the portal vein (≈70%), with a lesser contribution from the hepatic artery (≈30%). Contrast given by bolus injection in a peripheral arm vein will arrive earliest in the hepatic artery and enhance (i.e., increase the CT density of) many tumors to a greater extent than the liver parenchyma. Maximal enhancement of the liver parenchyma is delayed 1 to 2 minutes until the contrast has circulated through the intestinal tract and spleen and is returned to the liver via the portal vein. Differentiation of tumor and parenchyma by contrast enhancement can thus be maximized by giving an IV bolus of contrast and by performing rapid CT scanning of the liver early during maximum arterial enhancement and delayed during maximum portal venous enhancement. MDCT is ideal for this early and rapid scanning of the liver. Oral or rectal contrast is generally required to opacify the bowel for CT scans of the abdomen and pelvis. Bowel without intraluminal contrast may be difficult to differentiate from tumors, lymph nodes, and hematomas.
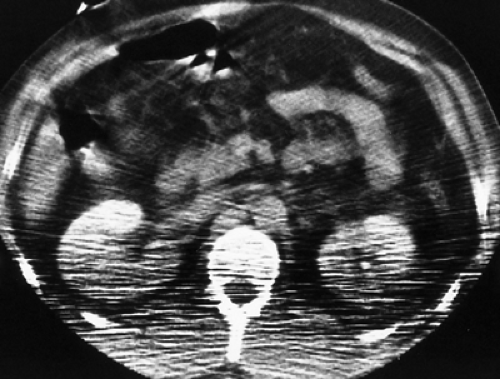 Figure 1.11. Beam Hardening Artifact. A CT image of the abdomen is severely degraded by beam hardening artifact that produces dark streaks across the lower half of the image. The artifact was caused by marked attenuation of the x-ray beam by the patient’s arms, which were kept at his sides owing to injury. |
CT Artifacts. Artifacts refer to components of the image that do not faithfully reproduce actual anatomic structures because of distortion, addition, or deletion of information. Artifacts degrade the image and may cause errors in diagnosis (12).
Volume averaging is present in every CT image and must always be considered in image interpretation. The displayed two-dimensional image is created from data obtained and averaged from a three-dimensional volume of patient tissue. Slices above and below the image being interpreted must be examined for sources of volume averaging that may be misinterpreted as pathology.
Beam hardening artifact results from greater attenuation of low-energy x-ray photons than high-energy x-ray photons as they pass through tissue. The mean energy of the x-ray beam is increased (the beam is “hardened”), resulting in less attenuation at the end of the beam than at its beginning. Beam-hardening errors are seen as areas or streaks of low density (Fig. 1.11) extending from structures of high x-ray attenuation such as the petrous bones, shoulders, and hips, or concentrations of contrast agents.
Motion artifact results when structures move to different positions during image acquisition. Motion occurs as a result of voluntary or involuntary patient movement, breathing, heartbeat, vessel pulsation, or peristalsis. Motion is demonstrated in the image as prominent streaks from high- to low-density interfaces or as blurred or duplicated images (Fig. 1.12).
Streak artifacts emanate from high-density sharp-edged objects such as vascular clips and dental fillings (Fig. 1.13). Reconstruction algorithms cannot handle the extreme differences in x-ray attenuation between very dense objects and adjacent tissue.
Ring artifacts occur when the CT scanner is out of calibration and detectors give erroneous readings at each angle of rotation. Ring artifacts are seen as high- or low-density circular rings in the image.
Quantum mottle artifacts produce noise in the image seen as salt-and-pepper pattern of random dark and light specks throughout the image. The image noise results from insufficient x-ray transmission data caused by inappropriate radiation settings for the size of the patient.
Principles of CT Interpretation. As with all imaging analysis, CT interpretation is based on an organized and comprehensive approach. CT images are viewed in sequential anatomic order, examining each slice with reference to slices above and below. This image analysis is made dramatically easier by viewing CT images on a PACS workstation. The interpreting physician can scroll up and down the stacked image display. The radiologist must seek to develop a three-dimensional concept of the anatomy and pathology displayed. This analysis is fostered by the availability of image reconstructions in coronal and sagittal as well as axial planes. The study must be interpreted with reference to the scan parameters, slice thickness and spacing, administration of contrast, timing of scanning relative to contrast enhancement, and presence of artifacts. Axial images are oriented so that the observer is looking at the patient from below. The patient’s right side is oriented on the left side of the image. Optimal bone detail is viewed at “bone windows,” generally a window width of 2000 H and a window level of 400 to 600 H. Lungs are viewed at “lung windows” with a window width of 1000 to 2000 H and window levels of -500 to -600 H. Soft tissues are examined at window width 400 to 500 H and window level 20 to 40 H. Narrow windows (width = 100 to 150 H and level = 70 to 80 H) increase image
contrast and aid in the detection of subtle liver and spleen lesions. PACS workstation viewing of digital images allows the interpreter to actively manipulate the image, magnify, change image brightness and contrast, measure attenuation, and create oblique and three-dimensional image reconstructions to optimize interpretation.
contrast and aid in the detection of subtle liver and spleen lesions. PACS workstation viewing of digital images allows the interpreter to actively manipulate the image, magnify, change image brightness and contrast, measure attenuation, and create oblique and three-dimensional image reconstructions to optimize interpretation.
 Figure 1.12. Motion Artifact. Breathing motion during image acquisition duplicates the margin (arrow) of the spleen simulating a subcapsular hematoma in this patient imaged because of abdominal trauma. |
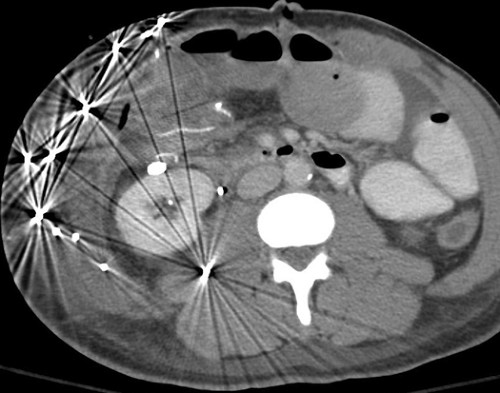 Figure 1.13. Streak Artifact. Shotgun pellets produce severe streak artifact on this CT image. |
Magnetic Resonance Imaging
MR is a technique that produces tomographic images by means of magnetic fields and radio waves (13). Although CT evaluates only a single tissue parameter, x-ray attenuation, MR analyzes multiple tissue characteristics including hydrogen (proton) density, T1 and T2 relaxation times of tissue, and blood flow within tissue. The soft tissue contrast provided by MR is substantially better than for any other imaging modality. Differences in the density of protons available to contribute to the MR signal discriminate one tissue from another. Most tissues can be differentiated by significant differences in their characteristic T1 and T2 relaxation times. T1 and T2 are features of the three-dimensional molecular environment that surrounds each proton in the tissue imaged. T1 is a measure of a proton’s ability to exchange energy with its surrounding chemical matrix. It is a measure of how quickly a tissue can become magnetized. T2 conveys how quickly a given tissue loses its magnetization. Blood flow has a complex effect on the MR signal that may decrease or increase signal intensity within blood vessels.
The complex physics of MR is beyond the scope of this book (14). In simplest terms, MR is based on the ability of a small number of protons within the body to absorb and emit radio wave energy when the body is placed within a strong magnetic field. Different tissues absorb and release radio wave energy at different, detectable, and characteristic rates. MR scans are obtained by placing the patient in a static magnetic field 0.02 to 3 T in strength, depending on the particular MR unit used. MR scanners at 4 T, 7 T, 8 T, and 9.4 T are being developed (15). Low–field strength systems (<0.1 T), midfield systems (0.1 to 1.0 T), and high-field systems (1.5 and 3.0 T) each have their own advantages and disadvantages (16). The choice of unit for imaging is based on preference and local availability. A small number of tissue protons in the patient align with the main magnetic field and are subsequently displaced from their alignment by application of radiofrequency (RF) gradients. When the RF gradient is terminated, the displaced protons realign with the main magnetic field, releasing a small pulse of energy that is detected, localized, and then processed by a computer algorithm similar to that used in CT to produce a cross-section tomographic anatomic image. Slice location is determined by application of a slice selection gradient of gradually increasing intensity along the z-axis. The small energy pulses released by tissue protons are further localized by “frequency encoding” in one direction (x-axis) and “phase encoding” in the other direction (y-axis). Images can be obtained in any anatomic plane by adjusting the orientation of the x-axis, y-axis, and z-axis magnetic field gradients. Because the MR signal is very weak, prolonged imaging time is often required for optimal images. Standard spin-echo sequences produce a batch of images in 10 to 20 minutes. Rather than obtaining data for each image one slice at a time, many spin-echo MR sequences obtain data for all slices in the imaged tissue volume throughout the entire imaging time. Thus, motion caused by breathing and cardiac and vascular pulsation may degrade the image substantially. MR has advanced to rapid imaging breath-hold techniques using gradient recalled echo (GRE), echo train, and echo-planar sequences. Continued rapid-paced technological improvements are making MR acquisition times comparable with those for CT.
Present MR technology relies on a variety of MR sequence techniques, with many variations used by different MR manufacturers (Fig. 1.14). Acronyns rule. Acronyns rule.
Spin-Echo (SE) pulse sequences produce standard T1WI, T2WI, ad proton density–weighted images (14). T1WI emphasize differences in the T1 relaxation times between tissues, while minimizing differences in T2 times. On the resultant image tissues with short T1 values are relatively bright (high signal intensity), while those with long T1 times are relatively dark (low signal intensity). T1WI usually provide the best anatomic detail and are good for identifying fat, subacute hemorrhage, and proteinaceous fluids. T2WI emphasize differences in the T2 relaxation times of tissues while minimizing differences in T1 times. Tissues with long T2 times are relatively bright, while those with short T2 times are relatively dark. T2WI usually provide the most sensitive detection of edema and pathologic lesions. Proton density–weighted images accentuate proton density differences in tissues and are most useful in brain imaging.
Two major components of MR instrument settings selected by the operator for SE sequences are TR and TE. The time between administered RF pulses, or the time provided for protons to align with the main magnetic field, is TR (time of repetition). The time provided for absorbed radio wave energy to be released and detected is TE (time of echo). Spin-echo T1WI are obtained by selecting short TR (≤500 ms) and short TE (≤20 ms) settings. Spin-echo T2WI use a long TR (≥2000 ms) and long TE (≥70 ms). Proton density–weighted images use a long TR (2000 to 3000 ms) and a short TE (25 to 30 ms) to minimize T1 and T2 effect and accentuate hydrogen-density differences in tissues.
Multiple Spin-Echo sequences, also known as echo train, rapid acquisition relaxation enhanced (RARE), fast spin-echo (FSE), or turbo spin-echo (TSE) sequences significantly reduce image acquisition time. Signal intensity is less than with SE sequences and image blurring occurs. Fat is bright on T2WI impairing detection of pathology, such as edema in fat adjacent to an inflammatory process. Including fat-suppression techniques counters this effect. Fast low-angle acquisition with relaxation enhancement (FLARE) and half-Fourier acquisition single-shot turbo spin echo (HASTE) are variations of this technique.
Inversion Recovery (IR) pulse sequences are used mainly to emphasize differences in T1 relaxation times of tissues. A delay time, TI (time of inversion), is added to the TE and TR instrument settings selected by the operator. Standard IR sequences, using a long TI, produce T1WI. Tissues with short T1 times yield a brighter signal. Short TI inversion recovery (STIR) sequences are the most commonly used. This sequence achieves additive T1-weighted, T2-weighted, and proton density–weighted contrast to increase lesion conspicuity. With STIR sequences, all tissues with short T1 relaxation times, including fat, are suppressed, whereas tissue with high water content, including many pathologic lesions, are accentuated, yielding a bright signal on a dark background of nulled short-T1 tissue. STIR images more closely resemble strongly T2WI.
Gradient Recalled Echo (GRE) pulse sequences are used to perform fast MR and MR angiography (14). Rapid image sequences are particularly useful in body MR to minimize motion artifact of breathing, heartbeat, vessel pulsation, and bowel peristalsis. T1-weighted GRE sequences have completely replaced SE T1-weighted sequences in body MR imaging. Partial “flip angles” of less than 90° are used to decrease the time to signal recovery. Signal intensity arising from T2 relaxation characteristics of tissue is strongly affected by imperfections in the magnetic field on GRE images. Magnetization decay time with GRE imaging is termed T2* (“T2 star”) and is much shorter than the “true” T2 decay times seen with SE imaging. T2*-weighted imaging are used to
depict hemorrhage, calcification, and iron deposition in tissues (17). GRE images are characteristically low in image contrast, have more prominent artifacts, and demonstrate flowing blood with bright signal. T1-, T2-, T2*-, and proton density–image weighting is determined by the combination of flip angle, TR, and TE settings. Fast GRE techniques include fast low-angle shot (FLASH), gradient-recalled acquisition in steady state (GRASS), and true fast imaging with steady state precession (FISP), snapshot FLASH, rapid acquisition with gradient echo (RAGE), and magnetization prepared RAGE (MPRAGE).
depict hemorrhage, calcification, and iron deposition in tissues (17). GRE images are characteristically low in image contrast, have more prominent artifacts, and demonstrate flowing blood with bright signal. T1-, T2-, T2*-, and proton density–image weighting is determined by the combination of flip angle, TR, and TE settings. Fast GRE techniques include fast low-angle shot (FLASH), gradient-recalled acquisition in steady state (GRASS), and true fast imaging with steady state precession (FISP), snapshot FLASH, rapid acquisition with gradient echo (RAGE), and magnetization prepared RAGE (MPRAGE).
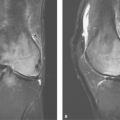
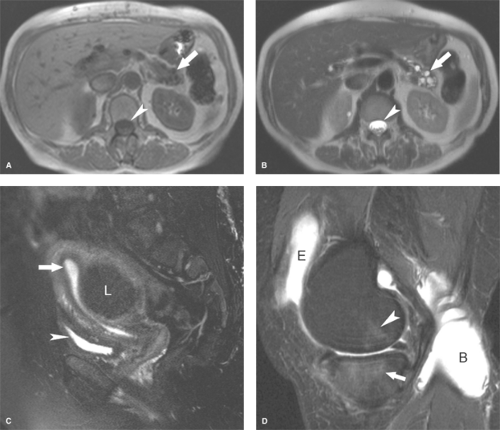 Figure 1.14. MR Sequences. Gradient recall in-phase T1WI (A) and HASTE T2WI (B) taken at the same slice location demonstrates dark signal in free water on T1WI and bright signal of free water on T2WI. Note the improved conspicuity of the cystic lesion (arrows) of the pancreas and the T2WI compared to the T1WI. The cerebrospinal fluid (arrowheads) in the spinal canal also shows marked increase in signal on T2WI. C. Sagittal turbo-spin echo (TSE) T2WI with fat saturation shows a low signal leiomyoma (L) and bright signal from fluid in the endometrial canal (arrow) and from urine in the bladder (arrowhead). Note the lack of signal from fat as compared to (B) the T2WI without fat saturation. D. Sagittal plane STIR image of the knee accentuates bright signal from free water in the knee effusion (E), Baker’s cyst (B), and bone bruise edema in the femoral condyle (arrowhead) and tibial plateau (arrow). |
Echo-Planar imaging is a very fast MR technique that can produce single-slice images in 20 to 100 milliseconds (18). All spatial encoding information is obtained after a single RF excitation, compared with the multiple RF excitations separated by TR intervals required for conventional MR. Motion artifact is virtually eliminated, and moving structures can be “freeze-frame” imaged. Special hardware is required for echo-planar imaging, but standard SE, GRE, and IR pulse sequences can be obtained. Echo-planar imaging overcomes many of the time and motion limitations of conventional MR and enables expansion of MR to new areas such as blood perfusion and cortical activation of the brain.
Diffusion-Weighted Imaging (DWI) sequences are designed to detect alteration in the random (Brownian) motion of water molecules within tissues. DWI measures diffusion, the mean path length travelled by water molecules within a specific time interval. DWI techniques were initially applied to neuroradiology particularly in detection of acute cerebral ischemia but have become increasing useful in body imaging for tumor detection, tumor characterization, and evaluation of tumor response to treatment.
Diffusion-Tensor Imaging (DTI) and fiber tractography demonstrate the orientation and integrity of white matter fibers particularly useful in diagnosis of diseases of the corpus callosum and in cortical dysplasia. DTI also has application in imaging muscle fibers in the heart and musculoskeletal system.
MR Spectroscopy provides demonstration of relative tissue metabolite concentrations on the basis of chemical shift phenomena. Choline, creatine, citrate, lactate, and other metabolites change in different pathologic conditions. For example, in the breast, peaks of choline suggest malignancy. MR spectroscopy has expanding utility in the diagnosis of conditions in the brain, breast, abdominal organs, and musculoskeletal system.
Fat Suppression Techniques are used in MR to detect the presence of fat or to suppress signal from fat to enhance detection of pathology (tumor invasion into fat or edema in fat) (19).
Fat saturation technique takes advantage of the difference in resonance frequencies of water and fat. Signal from fat is suppressed while the image is produced from the remaining signal of water. Fat saturation technique modifies only the signal of fat without modifying signal characteristics of other tissues. It can be used effectively with contrast-enhanced images. This technique is highly sensitive to magnetic field inhomogeneity and misregistration artifacts and does not work well with low-field magnets. The technique is optimal for suppressing signal from macroscopic fat within adipose tissue (Fig. 1.14C).
Short TI inversion recovery (STIR) provides global homogeneous fat suppression but suppresses all tissues with very short T1, including tissue enhanced by administration of IV gadolinium, mucoid tissue, hemorrhage, and proteinaceous fluid (Fig. 1.14D). It can be used with low-field magnets and is insensitive to inhomogeneities in the magnetic field.
Chemical shift imaging (opposed-phase MR) is fast, reliable, and optimal for detection of small amounts of fat such as intracellular fat in adrenal adenomas and fatty-infiltrated hepatocytes in the liver (Fig. 1.15) (20). Resonance frequency of water is different (faster than) that of fat. In-phase (IP) images add signal from fat and water. Opposed-phase (out-of-phase (OP)) images subtract water signal from fat signal. The presence of fat within cells is demonstrated by a distinct drop in signal intensity on the OP image compared to the IP image. Chemical shift imaging is characterized by two distinctive edge artifacts. The technique results in spatial misregistration of fat signal resulting in alternating bands of bright and dark signal at water–fat interfaces in the frequency-encoded direction. The second artifact is a thin black line at interface between fat and water-laden tissue (e.g., the interface between the kidney and perinephric fat) has been termed the “india ink artifact.” This artifact is useful in identification of the OP image and may additionally be used to identify fatty tumors such as angiomyolipomas. The india ink artifact occurs along the entire border between fat and water (fat/organ, fat/muscle) and not just in the frequency-encoded direction. The artifact results from the presence of fat and water molecules in the same voxel resulting in loss of signal by phase cancellation in all directions. Adipose tissue contain abundant fat and little water so the signal is minimally reduced on OP images. However, tissue with low fat content but high water content (adrenal adenomas, fat-infiltrated hepatocytes) show a prominent loss of signal on OP images compared to IP images. The obvious limitation is that opposed phase MR does not suppress signal from adipose tissue.
Related posts:
Stay updated, free articles. Join our Telegram channel

Full access? Get Clinical Tree


