Attenuation change
Low attenuation
Fatty liver, steatohepatitis
High attenuation
Amiodarone, hemosiderosis, hemochromatosis, GSD, chronic arsenic poisoning, gold therapy, Wilson’s disease, shock liver
Heterogeneous attenuation
Uneven fatty liver, radiation hepatitis, sinusoidal obstruction syndrome
Morphologic change
Enlarged
Acute hepatitis, alcoholic hepatitis, hematologic disease (lymphoma, leukemia), metabolic disease (Wilson’s disease, GSD)
Shrunk
Chronic hepatitis, liver cirrhosis, end stage of metabolic disease (Wilson’s disease, GSD)
Contour deformity
Liver cirrhosis, pseudocirrhosis by tumor, PVT change
Multifocal hepatic lesions
Hypervascular
Multinodular HCC, diffuse hypervascular metastasis, focal nodular hyperplasia/nodular regenerating hyperplasia, peliosis, AP shunt
Hypovascular
Multiple regenerative nodules/dysplastic nodules, diffuse hypovascular metastasis, multiple myeloma, lymphoma, leukemia, sarcoidosis, candidiasis, eosinophilic abscess, extramedullary hematopoiesis (rare)
Hypovascular, cystic
Biliary hamartoma, ADPKD, cystic metastasis
Other
Multiple fat deposition
2.1 Radiologic Modalities
US is the first diagnostic modality of choice for diffuse liver disease. This is routinely performed in patients with predisposing factor of hepatocellular carcinomas (HCCs) for surveillance. It is also performed in patients with liver function test abnormality to exclude the possible biliary obstruction. US is easy to perform and safe to patients with contrast media hypersensitivity or nephropathy. Furthermore, it can avoid radiation hazard. However, US is dependent on operators as well as not an effective diagnostic tool for obese patients due to poor sonic window. On US, operators usually compare the echogenicity of the liver with that of right kidney to detect the presence of fatty liver. Increased echogenicity on US, however, is seen in not only fatty liver but also other types of diffuse liver diseases.
CT is commonly used for evaluation of both focal and diffuse liver diseases. Non-contrast CT scan is useful for diagnosing fatty liver and hemochromatosis by comparing liver attenuation with splenic attenuation. On contrast-enhanced CT scans, the size and contour of the liver are easily assessed. With respect to diffuse liver diseases manifested as multifocal liver lesions, CT is a powerful tool for detection, characterization, and monitoring of those focal liver lesions. CT also has an advantage of surrounding organ evaluation. Owing to recent advances of CT techniques, high-resolution images can be achieved within a short time with lower radiation dose than before.
MR imaging has also been used for evaluating various hepatic diseases since breath-hold imaging acquisition sequences and hepatocyte-specific contrast agents were developed. MR plays an important role for focal liver lesion evaluation, but recently it draws a lot of attention as an effective tool for evaluation of diffuse liver disease by virtue of its chemical shift imaging (CSI), MR spectroscopy, diffusion weighted imaging (DWI) and MR elastography (MRE). In addition, T2-weighted image (WI) and T2*-WI are useful for evaluation of hemochromatosis. The advent of hepatocyte-specific contrast agent (Gd-EOB-DTPA) helps in the evaluation of liver disease by providing hepatobiliary phase imaging. Recently, there have been attempts to predict liver function using Gd-EOB-DPTA enhanced MRI as well.
Elastography is a tissue stiffness imaging, based on US or MR by measuring speed of sound across the tissue after vibrating a tissue. Instead of palpation for superficial organs, US based elastography (USE) such as transient elastography (TE), shear-wave elastography (SWE), acoustic radiation force impulse (ARFI) imaging, and MR elastography (MRE) are used for liver stiffness measurement. In MRE, mechanical waves are transmitted into the liver, and tissue stiffness is calculated by analyzing the propagation of shear waves using a motion-sensitive MR pulse sequence. In SWE, shear wave generated by push pulses from US probe is captured and tissue stiffness is calculated by measuring shear wave velocity. Liver stiffness values increase in advanced fibrosis. Since fibrosis itself is not clearly depicted on conventional imaging, elastography draws a lot of attention for fibrosis evaluation in the liver.
2.2 Radiologic Findings
2.2.1 Attenuation/Signal Intensity Changes of the Liver Parenchyma
2.2.1.1 Fatty Liver
Fatty liver disease comprises a spectrum of conditions including simple hepatic steatosis and steatohepatitis of various causes such as toxic, ischemic, and metabolic liver injuries. Among them, nonalcoholic fatty liver disease (NAFLD) is one of the most commonly encountered diffuse liver diseases in clinical field since rapid increase of obesity. The prevalence of NAFLD varies from 2.8 to 46 %, depending on sex, race, age, and underlying disease. Liver cirrhosis and accompanying HCCs may develop in late stage, although those are relatively less common in NAFLD than viral or alcohol-induced hepatitis. On US, normal liver parenchyma shows similar echogenicity with renal parenchymal echogenicity. Fatty liver shows higher echogenicity than the normal liver parenchyma. As fatty infiltration progresses, the interface between portal vein and liver parenchyma is obscured, and the diaphragm interface disappears. Although the liver parenchymal echogenicity tends to increase with fat accumulation, this is subjective and can be found in fibrosis and other diffuse liver diseases. CT is also helpful for diagnosing fatty liver; fatty liver shows decreased attenuation than spleen whereas normal liver parenchymal shows slightly higher attenuation (50–75 HU) than that of spleen. In severe fatty liver, intrahepatic vessels are brighter than liver parenchyma on non-contrast CT. Fat quantification using CT scan and liver attenuation index (difference of HU between liver and spleen on precontrast phase) showed higher accuracy to detect moderate to severe hepatic steatosis. On MR, CSI is effective for detecting small amount of fatty infiltration in the liver by providing in-phase and opposed-phase images. Normal liver shows higher signal intensity on both in- and opposed- phase images than that of spleen. There is no significant difference in hepatic parenchymal signal intensity on in- and opposed-phase images in normal liver, whereas fatty liver shows significant signal drop on opposed-phase image than on in-phase image. Besides of qualitative evaluation by comparing in- and opposed-phases, currently computational fat fraction map using a multi-echo gradient echo sequence with spectral modeling is available in many scanners. On fat fraction map, the fat amount can be measured quantitatively. MR spectroscopy is also useful for fat quantification in the liver, and it is known to provide the most accurate fat quantification result. The disadvantage of MR spectroscopy is that it samples only small portion of the liver whereas CSI can show the whole liver fat quantification.
2.2.1.2 NASH (Nonalcoholic Steatohepatitis)
Up to 25 % of the NAFLD patients have been reported to develop nonalcoholic steatohepatitis (NASH). Differentiating NASH from simple hepatic steatosis is clinically important because NASH is reported to progress to cirrhosis in 18–39 % in 3.5–8.2 years. The diagnosis of NASH has been made by liver biopsy which is invasive and unsuitable for treatment monitoring. Instead of liver biopsy, other noninvasive diagnostic methods are performed. For hepatic fat quantification, previously mentioned CSI and MR spectroscopy are used. Elastography including TE, SWE, and MRE can be used to investigate combined hepatic fibrosis.
2.2.1.3 Alcoholic Liver Disease
Alcoholic liver disease is a spectrum which consists of three disease entities: fatty liver, alcoholic hepatitis, and cirrhosis. Alcoholic hepatitis and cirrhosis are progressive disease, whereas alcohol-induced fatty liver is reversible by abstinence. The liver may be enlarged early in the disease process, but it becomes atrophic as cirrhosis progresses. Since hepatitis or cirrhosis is superimposed on the alcohol-induced fatty liver, the liver shows increased echogenicity on US and decreased attenuation on non-contrast CT. On MR, the liver is also presented as fatty liver: signal drops on opposed-phase image. In late stage of alcoholic liver disease, the liver shows contour deformity as well because of liver cirrhosis. In alcoholic liver cirrhosis, confluent fibrosis is known to be common than viral liver disease.
2.2.1.4 Chemotherapy-Associated Steatohepatitis (CASH) and Steatosis
Since liver is the main metabolic pathway of various agents, clinical or subclinical hepatotoxicity is common during chemotherapy. Chemotherapy–associated steatohepatitis (CASH) and steatosis are common problems encountered during chemotherapy by various anticancer drugs: methotrexate, corticosteroids, L-asparaginase, tamoxifen, irinotecan, 5-fluorouracil (5-FU), etc. Among them, 5-FU and irinotecan provide high chance of steatohepatitis. US, CT, and MR findings are consistent with those of simple hepatic steatosis. In patients with liver metastasis, the liver parenchyma around the metastatic lesion can be saved from fat infiltration, probably due to reduced portal inflow in that area. Patients’ history of chemotherapy and underlying malignant diseases will be important information for differential diagnosis.
2.2.1.5 Amiodarone
Amiodarone is an antiarrhythmic agent and its hepatotoxicity has been documented: it varies from asymptomatic mild elevation of serum transaminase levels to fatty liver or pseudo-alcoholic cirrhosis. The cumulative dose of amiodarone is more important for predicting toxicity rather than daily dose. Amiodarone shows very distinctive features on CT because of its iodine contents. On non-contrast CT, the liver shows significantly high attenuation than normal liver parenchyma or adjacent organ such as spleen, which simulates hemochromatosis.
2.2.1.6 Hemosiderosis and Hemochromatosis
Hemosiderosis is an increased iron deposition without parenchymal organ damage. Hemosiderosis is usually seen with body iron stores between 10 and 20 g, whereas normal iron in body is usually 2–6 g. With normal iron stores, iron is primarily in the reticuloendothelial cells of the bone marrow, liver, and spleen which have traceable amount. When iron deposition increases in the body, it is deposited in the liver, spleen, lymph nodes, pancreas, kidneys, heart, endocrine glands, and gastrointestinal tract.
Hemochromatosis is an iron-overload disorder in which there is structural and functional impairment of the involved organs. Iron overload can be classified as two categories: primary and secondary. Primary hemochromatosis is an autosomal recessive genetic disorder characterized by abnormally increased iron absorption by the mucosa of the duodenum and jejunum. Consequently, plasma iron level increases and it is deposited in visceral organs including liver. Secondary hemochromatosis is nongenetic and it develops in the following conditions: exogenous increase by ingestion or multiple transfusions and chronic medical disease (liver disease, oncologic disease, myelodysplastic syndrome). The liver is the first organ to be damaged in hemochromatosis because liver contains up to 1/3 of the total body store of iron. Hepatomegaly is present in 95 % of symptomatic cases. Splenomegaly is present in nearly 50 % of cases. Primary and secondary hemochromatosis involve visceral organs in different ways. Primary hemochromatosis involves parenchymal cells in the liver, pancreas, heart, pituitary gland, thyroid, and synovium. Spleen is preserved. On the other hand, in secondary hemochromatosis, iron is accumulated in the liver and spleen which contain reticuloendothelial cells, and pancreas is saved. However, in far advanced stage of secondary hemochromatosis, excessive iron can be deposited in the pancreas. Organ damage and malignancy frequently occur in primary hemochromatosis whereas secondary hemochromatosis is less toxic.
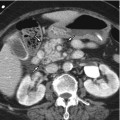
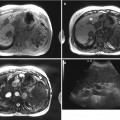
CT is the noninvasive diagnostic method of excess hepatic iron deposition. On CT scans, the liver demonstrates homogenously increased attenuation (75–135 HU), whereas the normal attenuation of the liver is 45–65 HU on non-contrast CT with 120 kVp. However, HU on CT scan can be changed by combined underlying disease, especially fatty infiltration, since fat reduces attenuation on precontrast phase. Since steatosis with hemochromatosis is not infrequent, it causes problem for diagnosis of hemochromatosis. Recently it is reported that dual-energy CT can differentiate hepatic iron from hepatic fat, but it is still on investigation. MR is the most sensitive imaging modality in the diagnosis of iron deposit. On MR, signal intensity dramatically reduces in the liver on T2-WI or T2*-WI, due to the large paramagnetic susceptibility of iron. In primary hemochromatosis, liver and pancreas show significant signal drop on T2-WI or T2*-WI, whereas in secondary hemochromatosis liver and spleen show signal drop on T2-WI or T2*-WI. On CSI, hemosiderosis or hemochromatosis shows opposite signal intensity with hepatic steatosis: hemosiderosis or hemochromatosis shows darker signal intensity on in-phase and higher signal intensity on opposed-phase images, whereas steatosis shows higher signal intensity on in-phase and signal drop on opposed-phase images.
2.2.1.7 Glycogen Storage Disease
Glycogen storage disease (GSD) is a heterogeneous group of disorders characterized by abnormal glycogen metabolism caused by different enzyme deficiency. The most common inherited disorder is type I GSD, in which glucose-6-phosphatase in the liver and kidneys is insufficient and it causes excessive glycogen deposition in the hepatocytes and proximal renal tubules. Pathologically intracytoplasmic accumulations of glycogen and small amount of lipid are found. Hepatomegaly and nephromegaly are seen on imaging. On US, various degree of fatty liver is seen. On CT scan, density of the liver is increased due to glycogen storage. However, at the same time, fat accumulation lowers the hepatic parenchymal attenuation. Therefore, the final hepatic parenchymal attenuation depends on the degree of fat and glycogen accumulation ratio. In GSD, CT and MR may have a role for the evaluation of adenoma and HCC surveillance rather than GSD diagnosis: hepatic adenoma and HCC can occur in patients with GSD, and especially the presence of multiple hepatic adenomas (adenomatosis) suggests the possibility of GSD.
2.2.1.8 Hepatic Sinusoidal Injury
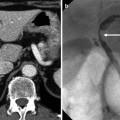
Hepatic sinusoidal injury or sinusoidal obstruction syndrome (SOS) is a term in which small venules in the liver are obstructed and histologically presented as sinusoidal dilatation and congestion. It was first described as an insult by alkaloids, but after wide use of anticancer drugs, it usually accompanies with high-dose chemotherapy. Sinusoidal injury has a strong correlation with oxaliplatin use. Besides oxaliplatin, azathioprine, actinomycin D, dacarbazine, mithramycin, and 6-thioguanine are associated with hepatic sinusoidal injury. Clinical feature varies: no symptom or liver function test abnormality, weight gain, hepatomegaly, and ascites in advanced stage. Especially patients with hepatitis, steatohepatitis and systemic infection are at risk of SOS. On Doppler examination, portal flow is diminished or reversed, and engorged portal vein and portal vein thrombosis are seen. Resistive index of hepatic artery increases. Hepatic vein involvement is not essential to SOS because the main injury occurs at the level of hepatic sinusoids. On CT, it can be manifested as heterogeneous liver parenchymal enhancement. On hepatobiliary phase image of hepatocyte-specific contrast-enhanced MR, liver shows hypointense reticular or lace-like parenchymal enhancement which accompanies with coalescent hypointense lesions. Peliosis hepatis, nodular regenerative hyperplasia, and sinusoidal dilatation can be coincident.
2.2.1.9 Radiation Hepatitis
Hepatic radiation is most often unintentional and occurs when the liver is unavoidably included in the treatment port for primary malignancies. Radiation hepatitis is a veno-occlusive process as SOS, and mean hepatic dose which exceeds 37 Gy is prone to radiation hepatitis since tolerance radiation dose of the liver is 30–35 Gy. Radiation hepatitis occurs within 2–6 months after radiation therapy. On US, the regions of radiation injury are hypoechoic relative to the remainder of the liver. This is probably a result of localized hepatic congestion or edema. CT scans performed within several months of the radiation therapy show a sharply defined band of low attenuation along the treatment port, so-called straight border sign. The straight border sign is due to edema by sinusoidal obstruction and presinusoidal edema or fatty infiltration of the involved area. On the other hand, in patients with fatty infiltration of the liver, the irradiated area may show increased attenuation than the remaining liver. This may be attributed to loss of fat in the irradiated hepatocytes or regional edema. The initially sharp borders of the irradiated zone become more irregular and indistinct as peripheral areas of parenchyma regenerate. Eventually, the irradiated area may become atrophic. Radiation hepatitis on MR manifests as geographic areas of low signal intensity on T1-WI and high signal intensity on T2-WI secondary to increased water content as determined by proton spectroscopic imaging. Besides those MR findings, diffusion restriction images (DWI) is helpful to distinguish post-radiation change from tumor recurrence.
2.2.2 Size and Contour Changes of the Liver
2.2.2.1 Hepatitis
Hepatitis is a general term for describing acute or chronic inflammation of the liver caused by various hepatic injuries including viral, fungal, bacterial, and exogenous toxic agents. It is reversible but sometimes progresses to chronic course.
In acute hepatitis, the imaging findings are nonspecific. The main purpose of the imaging is to exclude other underlying diseases such as biliary obstruction, focal liver lesions, or chronic liver disease. On US, normal findings are more frequent than abnormal findings. In severe acute hepatitis, the liver and spleen are frequently enlarged. The parenchymal echogenicity may decrease than renal echogenicity, and portal venule wall can be prominent due to parenchymal edema. Gallbladder frequently shows wall edema. CT findings are also nonspecific: hepatomegaly, gallbladder wall edema, and periportal edema which are probably due to lymphedema are common finding. Lymph node enlargement in portal hilum and ascites may be seen. On contrast-enhanced CT scan, the liver parenchyma may show heterogeneous enhancement.
In early stage of chronic hepatitis, morphologic change is not obvious and even US shows normal range of liver echogenicity, before fibrosis progresses. In advanced chronic hepatitis, however, liver shows increased and coarse parenchymal echogenicity and loss of mural definition of the portal veins on US due to inflammatory cell deposition and fibrotic tissue accumulation surrounding the lobules. In patients with chronic active hepatitis, lymph node enlargement is found in the porta hepatis, gastrohepatic ligament, and retroperitoneum. MR is reported to show homogeneously or heterogeneously increased signal intensity on T2-WI which suggests inflammation in the liver parenchyma. However, the main purpose of CT and MR is to monitor the disease progression to liver cirrhosis and to detect HCC. In advanced chronic liver disease, US plays a key role for evaluation of liver echogenicity which may help earliest detection of liver cirrhosis change, although the liver echogenicity on US is subjective and operator dependent. Therefore, elastography including TE, SWE, and MRE is performed, and TE and MRE have been widely validated. SWE and MRE have an advantage of providing elastogram than TE, which shows 1D value, in aspect of elasticity imaging.
2.2.2.2 Liver Cirrhosis
Liver cirrhosis is the terminal stage of the chronic liver disease, which is characterized by advanced fibrosis and multiple regenerative or dysplastic nodules. Morphologic changes of the liver in cirrhosis are as follows: liver surface nodularity, enlarged left lateral segment and S1, atrophy of the right lobe and S4, prominence of the fissures, gallbladder fossa, and porta hepatis. Those atrophy/hypertrophy changes of the liver size are explained by hepatic perfusion change: blood flow to right portal vein is from superior mesenteric vein which contains metabolites and toxins, and blood flow to left portal vein is from spleen which contains insulin and glucagon. Regardless of causes, because of the overall volume decrease, the fissures, gallbladder fossa, and hilar space are widening. On US, decreased liver volume, surface nodularity, prominent fissures and gallbladder fossa, and coarse echogenicity are observed. Furthermore, multiple hyper- or hypoechoic small nodules, ascites, and splenomegaly are suggestive of liver cirrhosis. Surface nodularity is caused by regenerating nodules, and it is more clearly depicted in left lateral segment on CT and MR. CT is not sensitive to detect regenerative or dysplastic nodules than other two examinations.
Hepatic circulation changes in chronic liver disease. Intrahepatic vascular resistance increases and portal perfusion decreases. Additionally, hepatic sinusoids are obliterated due to deposition of collagen in the extravascular Disse’s spaces. Consequently portal hypertension appears and portal vein dilatation is shown. Main portal vein diameter exceeds 13 mm; it is very specific for portal hypertension. But in advanced stage, the main portal vein shrinks due to decreased and hepatofugal portal flow. Left gastric, esophageal, paraesophageal, gastrorenal, splenorenal, paraumbilical, mesenteric, and hemorrhoidal veins are common portosystemic collaterals. Esophageal and gastric varices are carefully observed because they can cause massive hematemesis. Portal hypertension usually leads to splenomegaly, ascites, bowel wall edema (portal hypertensive colonopathy), and increased density in mesentery, lymph node enlargement.
Portal hypertension also occurs after chronic portal vein thrombosis. Because of decreased portal flow, peripheral liver parenchyma is atrophied whereas central portion of the liver is relatively saved and compensatorily hypertrophied. At the same time, cavernous transformation is induced. The morphological change by chronic portal vein thrombosis without liver cirrhosis may be confused with liver cirrhosis, but it can be differentiated from liver cirrhosis in several aspects: no presence of surface nodularity, no left lateral segment hypertrophy, and no S4 atrophy.
Confluent fibrosis is broad fibrosis of thick, mass-like appearance up to several centimeters. In 30 % of cirrhosis, confluent fibrosis is depicted on CT and MR and sometimes it mimics a neoplasm. Confluent fibrosis shows low attenuation on precontrast CT scan and iso- to hypoattenuation on contrast-enhanced CT scan and capsular retraction may be seen. Common spots are right anterior segment and left lateral segment. On MR, it shows low signal intensity on T1-WI and subtle high signal intensity on T2-WI. Unlike tumors, confluent fibrosis is usually geographic or wedge-shaped and radiates from the portal hilum to liver surface. On dynamic images, it shows persistent or delayed enhancement pattern which is a differential point from HCC. One thing to remind is that confluent fibrosis shows hypointensity on delayed phase. But its enhancement pattern is clearly different from HCC which shows arterial enhancement and portal washout and can distinguish it from HCC.
2.2.2.3 Wilson’s Disease
Wilson’s disease is a rare, autosomal recessive inherited disorder of copper metabolism. It is a result of impaired biliary or urinary excretion of copper, excessive absorption of copper from the gastrointestinal tract, and deficient production of ceruloplasmin. The copper accumulates in the multiple organs including liver, basal ganglia, and cornea. Imaging findings are nonspecific in Wilson’s disease since the spectrum of hepatic injury by copper accumulation varies: fatty infiltration, acute hepatitis, chronic active hepatitis, cirrhosis, or massive liver necrosis. Hepatomegaly is the most common feature. In addition, fatty infiltration, chronic hepatitis and liver cirrhosis can be seen on US and CT, but these are indistinguishable from other causes. Copper deposition can increase liver attenuation on CT and may change liver signal intensity on MR by shortening T2-relaxation time, but it is not well demonstrated in vivo. Imaging is not useful for diagnosing Wilson’s disease or estimating copper amount but more useful for liver injury monitoring and surveillance for liver cirrhosis.
2.2.2.4 Amyloidosis
Amyloids are proteolysis-resistant fibrils derived from monoclonal immunoglobulin light chains. In amyloidosis, amyloid accumulates in organs and replaces the normal tissue. Liver is the third commonly involved organ in abdomen that follows spleen and kidneys. Amyloids accumulate in Disse’s space. CT findings of amyloidosis are nonspecific. Hepatomegaly is the most common finding which can be seen in 75 % of cases. On CT, the regions in which amyloids accumulate may show variable-sized low attenuation. Delayed contrast enhancement may be seen in the involved areas because of vascular and sinusoidal infiltration. Concomitant abnormalities seen in the spleen are helpful in differentiating amyloid deposition from neoplasm and fatty infiltration. On MR, T2 signal intensities of the spleen and adrenal glands are significantly decreased, and the T2 signal intensity of the pancreas significantly increased, whereas minimal T2 signal change is seen in the liver.
2.2.3 Multifocal Hepatic Lesions
Diffuse liver disease can also be manifested as multifocal hepatic lesions including infectious, hemato-oncologic diseases as well as benign lesions.
2.2.3.1 Liver Cirrhosis-Related Nodules
Since liver cirrhosis is characterized by fibrosis as well as hepatocellular nodules, multiple cirrhosis-related nodules are observed on US, CT, and MR: MR is the most sensitive tool for their detection and characterization. Those nodules are classified as regenerative nodules (benign), dysplastic (premalignant) and neoplastic nodules (malignant). In advanced stage of liver cirrhosis, those nodules sometimes manifest as multiple focal lesions and may obscure detection of HCC. Regenerative nodules are formed in response to exogenous stimuli, and they are not pathognomonic to liver cirrhosis. Regenerative nodules are less than 5 cm in most cases. A giant regenerative nodule (5 cm<) is very rare. They show iso- or hypointense on T2-WI and do not show arterial enhancement on dynamic sequences. Dysplastic nodules are usually found in liver cirrhosis and regarded as premalignant lesions. On MR, they show hypo- or isointensity on T1-WI and T2-WI. Depending on histological grade, dysplastic nodule may show defect on hepatobiliary phase of Gd-EOB-DTPA MR. However, unlike HCC, they do not show arterial enhancement on dynamic sequences. In addition, siderotic nodules are frequently used which are usually benign. Siderotic nodules usually refer to liver cirrhosis-related nodules including iron deposition inside. It can be regenerative (siderotic regenerative nodules) and dysplastic (siderotic dysplastic nodules). On MR, siderotic nodules show signal drop on T2-WI or T2*-WI. Those nodules are explained in detail in Sect. 1.4.
In congenital hepatic fibrosis or cirrhosis by vascular occlusion such as membranous obstruction of the inferior vena cava, focal nodular hyperplasia-like nodules can occur. These manifest as hypervascular enhancing nodules in the liver on CT and MR. They show strong enhancement on arterial phase and are able to mimic HCC. The differential point is hepatocyte-specific contrast agent uptake along the lesion periphery on hepatobiliary phase, which is “ring-enhancement,” or iso- or hyperintense nodule on hepatobiliary phase (Sect. 3.2).
2.2.3.2 Sarcoidosis
Sarcoidosis is a systemic granulomatous disorder that affects young and middle-aged patients. Lung is the most commonly involved organ and liver is also involved in 24–79 % of patients. Liver dysfunction is not common, although it rarely leads to chronic inflammation, chronic hepatitis, and cirrhosis. The most common CT findings are hepatomegaly followed by multiple low attenuating nodules varying in size up to 2 cm which are coalescing granulomas. On MR, these nodules are hypointense on T1-WI and hyperintense on T2-WI, comparing with the liver parenchyma. Sarcoidosis has to be differentiated from diffuse malignant disease including multiple metastasis, lymphoma, and infectious disease such as candidiasis.
Related posts:


Stay updated, free articles. Join our Telegram channel

Full access? Get Clinical Tree


