Advanced imaging provides insight into biophysical, physiologic, metabolic, or functional properties of tissues. Because water mobility is sensitive to cellular homeostasis, cellular density, and microstructural organization, it is considered a valuable tool in the advanced imaging arsenal. This article summarizes diffusion imaging concepts and highlights clinical applications of diffusion MR imaging for oncologic imaging. Diffusion tensor imaging and its derivative maps of diffusion anisotropy allow assessment of tumor compression or destruction of adjacent normal tissue anisotropy and may aid to assess tumor infiltration and aid presurgical planning.
It is estimated there will be over 22,000 newly diagnosed cancers of the brain and central nervous system in the United States in 2009 and that nearly 13,000 individuals will die of cancer of the brain and central nervous system. Despite the emergence of many new treatment strategies and multimodality therapies, successful management of brain tumors in adults and children remains largely unsatisfactory. In particular, glioblastoma multiforme (GBM) presents a major challenge given its moderate response rates to essentially all available standard-of-care therapies leading to a median survival time of only 12.2 to 18.2 months in these patients. This is in contrast to patients with anaplastic astrocytomas, who survive over 40 months on average, and low-grade gliomas, which have a better prognosis, although most of these individuals eventually succumb to their disease. To date, patient age, tumor histology, patient functional status, and the combination of these parameters are considered the most reliable prognostic indicators of overall survival. This is an unfortunate fact considering remarkable advances in neuroimaging that have occurred over the last couple decades. Despite major strides in spatial resolution and contrast of anatomic features, along with information-rich functional, metabolic, and physiologic representations of tissues, these undeniable achievements in neuroimaging have not had a commensurate impact on brain tumor patient survival outcome. The reader is referred to other articles in this issue for reviews of other advanced imaging approaches applied to brain tumor. One must remember that the therapy and not the imaging ultimately treats the tumor, and lack of any major improvement in brain tumor treatment outcome is more of an indictment of these therapies than of imaging. Moreover, although advanced imaging techniques have been available for many years, these methodologies are still evolving rapidly and have not been standardized or applied uniformly in large clinical trials. In most instances imaging is used as a simple indicator of change in tumor size well after therapy administration by way of subjective or objective assessment of lesion dimensions. Unfortunately, early change in size is not a reliable indication of tumor response, particularly for patients receiving combination therapy of temozolomide with radiation. The phenomena of “pseudoprogression” is indistinguishable from true tumor progression by conventional imaging. Pseudoprogression is characterized by an increase in size or number of contrast-enhancing lesions soon after treatment with temozolomide plus radiation, which eventually resolves or stabilizes without additional treatment. Pseudoprogression is observed in an estimated 15% to 30% of patients receiving this treatment and most of these patients remain clinically stable despite the progression-like appearances. It is often unclear whether current therapy should be maintained or second-line therapy initiated.
Although a fully satisfactory method to determine tumor response by imaging has not been developed, solid tumor response based on a simple single linear summation of lesion dimension termed “response evaluation criteria in solid tumors” is still in use today. Use of advanced imaging as an integral intervention to customize delivery of treatment on an individual patient basis remains largely untested. This article summarizes the concepts and use of diffusion MR imaging as a prognostic indicator and a potential biomarker of brain tumor treatment response. The scope briefly refers to basic diffusion principles and preclinical diffusion work, and focuses on clinical investigations in use of diffusion for oncologic applications. To date most of these clinical studies are single institution trials and involve modest patient numbers. Despite these limitations, diffusion imaging has shown promise as a tool for oncologic imaging of treatment response.
Diffusion concepts
The essential element of diffusion-based imaging is thermally driven random motion of water molecules, which are the sole source of desired signal. Although water is the sole signal source, it is all the nonwater constituents that provide the contrast and interest in diffusion imaging of tissue. Indeed, in pure water the only relevant modifier to water mobility is temperature; pure water maintained at body temperature has no contrast. Classic diffusion theory provides a statistical estimate for the average random displacement of water molecules over a given time interval. Assuming body temperature (37°C), water molecules migrate approximately 30 μm over a 50-millisecond interval but only if they are totally free of impediments. The 50-millisecond interval was chosen because it is representative of typical diffusion-weighted imaging (DWI) echo time TE. The fact that the diameter of a mammalian cell is approximately a few micrometers to tens of micrometers and that other subcellular structures (ie, membranes, organelles, and macromolecules) have smaller dimensions, the likelihood that a given water molecule encounters nonwater cellular constituents is extremely high. The water molecule likely has many interactions with large obstructions over the diffusion measurement interval. As a result the reduction of water mobility in tissue is a strong reflection of presence and density of nonwater cellular constituents, such as cell membranes, organelles, and macromolecules. Given that water moves within and across intracellular and extracellular domains, water also encounters impediments presented by tortuosity in the extracellular interstitium.
The reader is referred elsewhere for excellent reviews on technical aspects of how diffusion imaging is performed, although for the interest here it is sufficient to summarize a few key concepts. Sensitivity of the MR imaging sequence to water mobility is determined by the strength, duration, and direction of gradient pulses interleaved within the imaging sequence. The single most important parameter selected by the operator for diffusion imaging is the “b-value,” which is calculated based on gradient waveform amplitude and duration properties. As the b-value is increased, the signal strength decays because of spin dephasing secondary to random molecular displacements. The resultant DWI exhibits tissues where less mobile water seems hyperintense compared with hypointense tissues where water is more mobile. Keen sensitivity to acute ischemic insult leading to cytotoxic edema manifest as a hyperintensity on DWI is a classic example of this principle. Although diffusion-based contrast increases with b-value, there are practical signal-to-noise and hardware limitations such that a reasonable b-value range for each particular application is reasonably well established. For example, most clinical DWI of the human brain is performed in the b-value range 0 to 1000 s/mm 2 . Aside from qualitative interpretation of heavily DWI (eg, at b = 1000 s/mm 2 ), the combination of at least two DWIs allows quantitative calculation of an apparent diffusion coefficient (ADC) given by,
where S 1 and S 2 represent signal intensity of images acquired at low b-value, b 1 , and high b-value, b 2 , respectively.
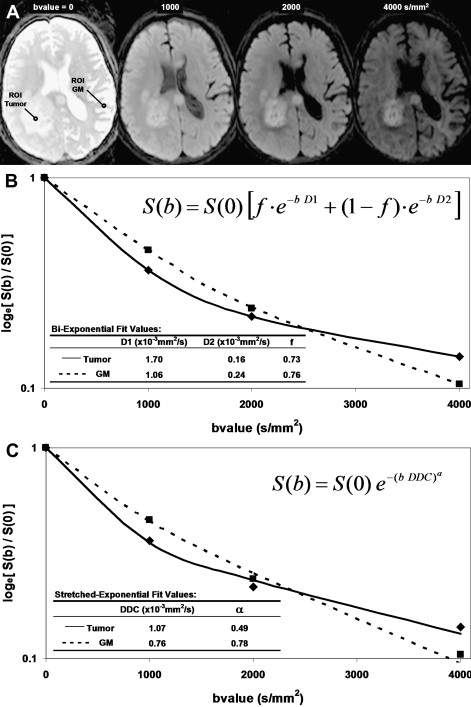
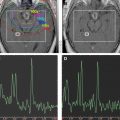
The simplicity of Eq(1) implies monoexponential signal decay with increasing b-value; however, water diffusion in tissue is well known to exhibit nonmonoexponential behavior observed at very high b-values (b >3000 s/mm 2 ). The existence of nonmonoexponential behavior is not surprising considering the complex nature of the extracellular and subcellular domains, although which biophysical model and means to interpret multiexponential in vivo data remains the subject of debate. In addition, signal-to-noise ratio limitations and long scan times to acquire a wide b-value range necessary to demonstrate multiexponential features have hampered clinical use of this phenomenon. Fig. 1 illustrates signal loss and gain in diffusion-weighted contrast of normal tissues and glioma with increasing b-value. Nonmonoexponential behavior is demonstrated by the graphs of signal versus b-value for regions of interest (ROI) defined on normal brain and glioma. Two functional forms proposed to fit these signal decay features are a bi-exponential model and the stretched exponential model. Model fit parameter values and their functional form are illustrated on the graphs for these examples of tumor and normal gray matter. Note the dominant compartment signified by f >0.5 has a higher diffusion coefficient than the minority compartment (ie, D1 > D2). This finding is consistent with other studies and indicates a simple conceptual assignment of lower diffusion in the dominant intracellular compartment and higher diffusion in the smaller extracellular compartment is not valid; more complex models are required. The α index from the stretched exponential relates to intravoxel diffusion heterogeneity. A lower α in solid tumor suggests a greater spread in intravoxel diffusion values relative to gray matter.
Another fundamental consideration relates the fact that water mobility in tissue can be directional (ie, anisotropic). White matter, in particular, is very anisotropic where the apparent water mobility varies several-fold based on relative orientation of the measurement direction and myelinated white matter fiber axis. Diffusion sensitization gradients must be applied along multiple noncolinear directions (at least six) such that the underlying directional architecture of the tissue can be numerically estimated. Again, the reader is referred elsewhere for technical details on diffusion tensor imaging (DTI), although a common intermediate step in the DTI analysis is calculation of eigen values for each voxel. Eigen values (λ 1 , λ 2 , λ 3 ) represent diffusivity along the natural tissue-based axes that may exist in the voxel. The standard convention is to have λ 1 represent the highest diffusivity value ostensibly along the fiber axis, whereas λ 2 , and λ 3 are lower values perpendicular to the fiber direction. In isotropic media λ 1 ≈ λ 2 ≈ λ 3 . These eigen values are used in subsequent calculations to derive a variety of indices representing the degree of diffusion anisotropy, which infers the degree of cytoarchitectural anisotropy and omnidirectonal order in tissue. For example, fractional anisotropy (FA) is commonly used as an anisotropy index and is defined as,
F A = 3 2 ( D a v e − λ 1 ) 2 + ( D a v e − λ 2 ) 2 + ( D a v e − λ 3 ) 2 λ 1 2 + λ 2 2 + λ 3 2
Related posts:
 Magnetic Resonance Perfusion and Permeability Imaging in Brain Tumors
 Quantitative Sodium MR Imaging and Sodium Bioscales for the Management of Brain Tumors
Intraoperative Mapping for Tumor Resection
Quantitative Sodium MR Imaging and Sodium Bioscales for the Management of Brain Tumors
Intraoperative Mapping for Tumor Resection
 Therapeutic Advances in Malignant Glioma: Current Status and Future Prospects
 Imaging of the Central Skull Base
 Brain Irradiation: Effects on Normal Brain Parenchyma and Radiation Injury
Stay updated, free articles. Join our Telegram channel

Full access? Get Clinical Tree


