Treatment of high-grade primary brain tumors is based on experience from multicenter trials. However, the prognosis has changed little in 3 decades. This suggests that there is a fundamental oversight in treatment. This article provides an imaging perspective of how regional responses of primary brain tumors may be examined to guide a flexible treatment plan. Sodium imaging provides a measurement of cell density that can be used to measure regional cell kill. Such a bioscales of regionally and temporally sensitive biologic-based parameters may be helpful to guide tumor treatment. These suggestions are speculative and still being examined, but are presented to challenge the medical community to be receptive to changes in the standard of care when that standard continues to fail.
The standard of care for the comprehensive treatment of high-grade primary brain tumors includes surgery, radiation treatment, and chemotherapy. MR imaging is involved in the initial diagnosis for detection and characterization of the lesion, focusing on size, location, and its effect on surrounding brain, and then on the heterogeneity of the signal characteristics, the presence of hemorrhage, magnetic resonance (MR) perfusion characteristics, and integrity of the blood-brain barrier. These imaging properties have been correlated with tumor grade that has prognostic significance. Functional MR imaging can be used for presurgical planning and for image guidance of the surgical procedures (biopsy, resection) to minimize disruption of eloquent cortex. The surgical debulking is not considered curative for high-grade tumors but a preliminary step toward improving response to the subsequent treatments. After a short recovery period to allow some degree of healing of the surgical site, radiation treatment planning begins. The radiation planning uses the radiography attenuation coefficients from CT scans to design the distribution of the radiation used in the treatment plan. Advantage is taken of the better display of tumors on MR imaging by fusing the MR and CT scan images. The course of radiation involves fractionated targeted radiation projected along multiple beams at many angles to achieve high dose over the tumor volume and margins while minimizing the dose to surrounding normal brain. The radiation is fractionated, usually administered for 5 days per week over about 6 weeks to a total dose of about 55 Gy. Imaging is not routinely performed during radiation treatment. Symptoms of brain swelling are controlled by use of oral steroids. Chemotherapy at low dose may be delivered during radiation treatment. Full-dose, single-agent chemotherapy follows the completion of radiation and is administered over multiple cycles to maintain tumor control. Follow-up MR imaging studies begin after radiation treatment is completed and are then performed every few months or more frequently depending on the clinical status of the patient. Although this protocol has been developed based on experience from large numbers of patients in multicenter trials, the prognosis has not changed in 3 decades (20% survival at 2 years). This extremely poor success rate for a significant neoplasm, despite this, comprehensive protocol after decades of experience, suggests that there is a fundamental oversight in the current treatment of this disease. This article provides an imaging perspective of how regional responses of primary brain tumors may be examined during treatment to guide a flexible treatment plan to the response of each patient’s tumor, rather than using a fixed rigid protocol based on population studies. Sodium imaging provides a direct measurement of cell density that can be used to measure regional cell kill during treatment. These bioscales of regionally and temporally sensitive biologic-based parameters may be helpful to measure tumor responsiveness that the oncologists can use to guide treatment for each patient. The suggestions are speculative and still being examined experimentally but are presented to challenge the medical community to be receptive to changes in the standard of care when that standard continues to fail.
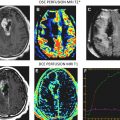
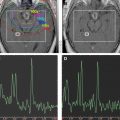
The conventional imaging workup for a brain tumor is a proton MR imaging examination with and without gadolinium contrast enhancement. The standard T1- and T2-weighted images define the location and dimensions of the mass. Diffusion-weighted imaging defines the extent of vasogenic edema while excluding cytotoxic edema. Perfusion imaging defines the regions of tumor with high vascularity on the relative cerebral blood volume map consistent with high-grade tumor ( Fig. 1 ). The role of perfusion imaging in tumor grading is discussed in another article elsewhere in this issue.
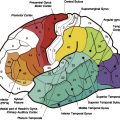
These anatomic characteristics are important in defining the proximity of eloquent cortex that should be mapped with functional MR (fMR) imaging before biopsy and surgical resection. The fMR imaging study is best done with fiducial markers in place over the head so that accurate anatomic registration of the patient’s head with the images can be achieved on the neurosurgical workstation to guide the location and size of the craniotomy ( Fig. 2 ). The functional maps are best registered over the contrast-enhanced images to aid in distinguishing tumor margins from eloquent cortex. Functional mapping for presurgical planning is also discussed in more detail in another article elsewhere in this issue.
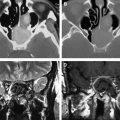
Once surgical resection is accomplished, a few weeks are allowed for healing and anatomic stabilization before beginning radiation planning. The radiation treatment uses a CT scan for establishing radiation attenuation coefficients but requires a new MR imaging study to be merged with the CT scan to delineate the margins of the surgical bed and residual tumor and regions of normal brain. Radiation exposure to normal brain should be minimized while dose to the tumor bed should be maximized ( Fig. 3 ). The functional maps could also be used in this setting, but this is rarely done.
Once radiation treatment commences, a CT scan is used to ensure that the alignment of the radiation distribution is accurately maintained. MR imaging is rarely done during radiation treatment unless there is a dramatic clinical change that requires specific evaluation. After radiation treatment is completed, there is a baseline MR imaging study to which all subsequent imaging is referred. The full-dose chemotherapy begins after radiation is completed and is used across multiple cycles. All follow-up MR examinations should include perfusion imaging (as discussed elsewhere in this issue), but this is still not done universally. The issue of pseudoprogression ( Fig. 4 , consequence of combined radiation and chemotherapy) with worsening gadolinium contrast enhancement but reduced cerebral blood volume in the few weeks to months after radiation with subsequent resolution is also discussed elsewhere in this issue.
Related posts:
 Magnetic Resonance Perfusion and Permeability Imaging in Brain Tumors
 Intraoperative Mapping for Tumor Resection
 Presurgical Mapping of Verbal Language in Brain Tumors with Functional MR Imaging and MR Tractography
 Diffusion Imaging for Therapy Response Assessment of Brain Tumor
 Imaging of the Central Skull Base
 Brain Irradiation: Effects on Normal Brain Parenchyma and Radiation Injury
Stay updated, free articles. Join our Telegram channel

Full access? Get Clinical Tree


