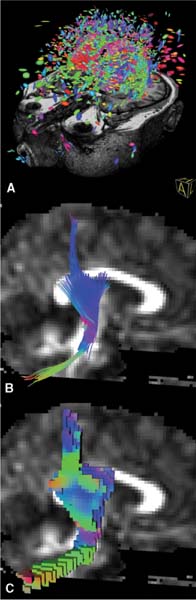
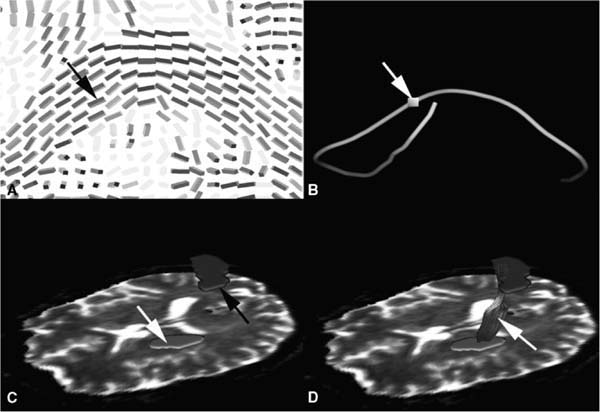
15 An important add-on to intraoperative imaging is the use of navigation, allowing preserving neurologic function despite increased resections. The integration of functional data from functional magnetic resonance imaging (fMRI) and magnetoencephalography (MEG) identifying cortical eloquent brain areas into standard three-dimensional (3D) anatomic datasets is known as functional navigation.1–3 Functional eloquent structures, such as the motor strip- or language-related areas can be identified during surgery by visualizing their position using the microscope heads-up display technology. Functional navigation allows resection of tumors close to eloquent brain areas with low postoperative deficits; intraoperative imaging ensures that the maximum extent of a resection can be achieved. The concept of functional navigation was expanded by the integration of further data leading to so-called multimodal navigation. fMRI and MEG only identify cortical eloquent brain areas. To prevent postoperative neurologic deficits it is also mandatory to preserve the major white matter tracts that are connected to these eloquent brain areas, such as the pyramidal tract for the motor system. Major white matter tracts can be reconstructed and visualized applying techniques based on diffusion weighted imaging (DWI). DWI depicts differences in tissue anisotropy by measuring the self-diffusion properties, i.e., the Brownian motion of water molecules. Diffusion is anisotropic – orientation-dependent – in areas with a strong aligned microstructure, including cell membranes and the myelin sheath surrounding myelinated white matter, causing impediment of the water motion, so that a differentiation between white and gray matter becomes possible.4 DWI gives only a rough estimation of the localization of major white matter tracts by depicting the differences in anisotropy.5,6 Because only areas of an aligned microstructure are identified, no directional information, which would facilitate the identification of clinically relevant white matter bundles, is available. That is why the definition of major white matter tracts based on DWI relies to a great extent on individual anatomic knowledge and therefore is much user dependent. In case of large space-occupying lesions a reliable identification of these structures may not be possible at all. Diffusion tensor imaging (DTI) is based on measuring multiple diffusion weighted images in different gradient directions to resolve the orientation of the white matter tracts. Isotropic diffusion can be graphically represented as a sphere, whereas anisotropic diffusion can be graphically expressed as an ellipsoid, with the water molecules moving along the long axis of a fiber bundle and less movement perpendicularly. To estimate the nine tensor matrix elements required for a gaussian description of water mobility, the diffusion gradient must be applied to at least six non-collinear directions. The eigenvalues represent the three principal diffusion coefficients measured along the three coordinate directions of the ellipsoid. The eigenvectors represent the directions of the tensor. Thus DTI can resolve the dominant fiber orientation in each voxel element. The direction of greatest diffusion measured by DTI parallels the dominant orientation of the tissue structure in each voxel, representing the mean longitudinal direction of axons in major white matter tracts. DTI provides information about the normal course, the displacement, or interruption of white matter tracts around a tumor, as well as a widening of fiber bundles due to edema or tumor infiltration can be detected.7–15 The diffusion tensor information can be represented as color-encoded fractional anisotropy (FA) maps, which are generated by mapping the principal eigenvector components into red, green, and blue color channels, weighted by fractional anisotropy. Assuming the patient is lying in a supine position and the head is not tilted, then the color mapping defines white matter tracts oriented in an anterior/posterior direction in green, a left/right direction in red, and a superior/inferior direction in blue.16 The simplification of a tensor to a scalar metric reduces the amount of information contained in the tensor. A possibility to show the entire information of the second-order tensors is to use glyphs.17 Several shapes have been proposed for representing tensors using glyphs. A popular approach is to use ellipsoids: the axes of the ellipsoid correlate with the directions of the eigenvectors and are scaled according to the corresponding eigenvalues (Fig. 15.1A). An advantage of tensor ellipsoids is that they can be rendered in real-time using graphics hardware. An even more satisfying shape for tensors are superquadric tensor glyphs, which provide a better and less-ambiguous spatial impression.18 However, superquadrics are computationally much more expensive and are hard to achieve in real-time. The advantage of glyph-based techniques is that the entire tensor information is visualized. Therefore, this visualization is especially appropriate for a detailed examination of the data. However, the results of this visualization approach are difficult to interpret in terms of underlying major white matter structures because no global connectivity information is provided. Consequently, a combination with other visualization techniques such as fiber tracking is recommended to obtain a meaningful representation. In addition, clipping or slice views of glyphs are necessary to avoid an overloading and cluttering of information in 3D. Fiber tracking is probably the most appealing and understandable technique for representing major white matter tracts and has been investigated by several groups. Various fiber tracking algorithms that compare local tensor field orientations measured by DTI from voxel to voxel have been implemented, allowing a noninvasive tracing of large fiber tract bundles in the human brain.19–22 Fiber tracking has been used for preoperative visualization of major white matter tracts in patients with space-occupying lesions.8,9,23 Commonly, the approaches are based on streamline techniques known from flow visualization (Fig. 15.1B). Thereby, the respective vector field is derived by taking the major eigenvector of each tensor. Fiber tracking algorithms often utilize thresholds, angle criterions, regularization techniques, and local filters to improve tracking results. In standard fiber tracking approaches the streamlines reconstructed by tracking algorithms are assumed to represent the most likely pathways through the tensor field. It is important to bear in mind that the term “fibers” is used for streamlines that actually do not represent the real anatomic fibers, but provide an abstract model of neural structures. Starting from seed voxels, the tracking is performed in a forward and backward direction with subvoxel precision. For the selection of seed voxels and for aborting the streamline propagation, FA is used as a threshold (Fig. 15.2). FA represents the degree of anisotropic diffusion and therefore is a proper measure for the probability of white matter. Following this assumption, voxels with high FA are used as seed voxels. If FA falls below a certain threshold, the tracking stops. Apart from the FA threshold for aborting fiber tracking, streamline propagation is aborted if it has reached a maximum length or if the angle between the last two steps is above a certain threshold. A further criterion for accepting a fiber is its length. Streamlines are rejected if they are below a minimum length. Besides these thresholds, the user may choose between a tracking encompassing the whole brain and tracking extracting fibers that run through user-defined regions of interest. The latter approach enables the reconstruction of separate tract systems, which is of special interest to actually delineate clinical relevant major white matter tracts. Meanwhile, standard fiber-tracking techniques provide a straightforward possibility to visualize major white matter tracts and their spatial relation to intracerebral lesions.24–27 However, a lot of software tools allow only tracking combined with the display of the diffusion data; coregistration with standard anatomic data are a must for an intuitive analysis in space-occupying lesions. Fig. 15.1 (A) Glyph representation of the diffusion tensor imaging (DTI) data of the whole brain with coregistered three-dimensional T1-weighted magnetic resonance images; (B) streamline visualization of tracking result of the right pyramidal tract displayed along the B0 diffusion data in sagittal view; (C) volume growing for visualizing the right pyramidal tract Fig. 15.2 Basic principle of fiber tracking. (A) Glyph-based fractional anisotropy map visualization; the black arrow depicts the seeding voxel for the tracking algorithm. (B) Single-fiber tracking starting from a single seeding voxel (white arrow); the reconstructed fiber tract is visualized as a streamtube. (C) Two regions of interest (ROI) approach for reconstruction of the left pyramidal tract; one ROI is placed in the internal capsule (white arrow), the other one in the motor cortex (blackarrow). (D) Fibers passing through both ROIs are visualized (white arrow) representing the left pyramidal tract. Unfortunately, most approaches do not satisfy the needs of neurosurgical planning. For clinical intraoperative use the actual border of a major white matter tract is of interest. A line representation like the visualization in standard fiber tracking lacks the ability to provide a border, so the user has to interpret the visualization as a model for the tract. The generation of hulls may overcome this drawback.28 A surface is generated that wraps a particular subset of previously computed streamlines, representing a certain fiber tract bundle. The wrapping itself might be based on the determination of a centerline of the bundle and the subsequent construction of bounding curves around the set of corresponding lines. Finally, a mesh can be generated by connecting the curves, representing the surface of the fiber tract bundle model. The major advantage of this method is the intuitive visualization. The results may look like flexible tubes, which are closely related to the expected appearance of a major white matter bundle, or a complete 3D object is generated, which represents the major white matter tract of interest. The borders are depicted directly and the combination with volume rendering of anatomic magnetic resonance (MR) data provides a good spatial orientation. It must be noted that the surface is entirely dependent on the previously performed fiber tracking. Errors in the streamline calculation have an immediate influence on the resulting hull. Alternatively, volume growing techniques are also possible to generate 3D objects representing major white tracts (Fig. 15.1C). In general, volume growing algorithms start from a predefined seed region and spread out within the volume until some terminating criterion is reached. Similar to region of interest-based fiber tracking, volume growing needs an initial region or volume of interest for starting the growing procedure. The algorithm then starts from each voxel within that region or volume and proceeds to neighboring voxels. In the same way as for fiber tracking, the growing process stops, as soon as a FA value below a specified threshold is reached. In addition, directional volume growing takes the shape of the local tensor, which controls the direction in which the process expands, and is taken into account.29 A major prerequisite of DTI-based navigation is the registration of the DTI data with standard 3D image data to define a common coordinate system. As a first attempt to integrate information about major white matter tracts into a functional neuronavigation setup, diffusion data with limited directional information were used for a rough estimation of the course of the pyramidal tract and applied for intraoperative guidance during brain tumor resection.5,6 These methods often required time-consuming preoperative manual data processing, such as the segmentation of the assumed major white matter tract in each single slice and subsequent image registration. The reliability of the reconstructed white matter tract depended mainly on the experience of the individual person processing the data. The next step to actually integrate DTI data into navigational datasets was the registration of FA maps with the standard anatomic 3D images.24,25,30 In contrast to the use of diffusion weighted images for the delineation of major white matter tracts, the manual segmentation in color-coded FA maps was more reliable and less user-dependent. However, still it was a time-consuming process that allowed only a rough estimation on the course of the pyramidal tract. Segmentation close to a lesion or a resection cavity was often not reliably possible. Integration of tractography data into a stereotactic coordinate system was the next major step. Most of these applications and approaches however, were standalone applications developed for individual clinical sites.24–27 A broad application for routine clinical use was not possible with the various prototype applications, and the missing standardization did not allow comparing the different approaches. The implementation of a fiber-tracking algorithm into a standard navigation system, allowing routine usage and broad availability solved these restrictions.31 Registration with standard anatomic image data greatly facilitated the generation and selection of the fibers of interest, and eased the delineation of the relationship of the tracked fibers to certain anatomic structures because the seed regions for the tracking algorithms could be defined in high-resolution 3D anatomic images. The implemented approach allows a straightforward definition of volumes of interest for selection of the fiber tracts of interest. Only two parameters, the FA threshold and the minimum length of the fibers that will be computed have to be selected by the user. The total generation of the fiber tracts, including image transfer, registration of the diffusion data with the standard anatomic image data, tensor calculation, fiber tracking, and the final generation of a 3D object needs less than 10 minutes, depending to some extent on the individual strategy how the different seed volumes of interest during initiation of the tracking algorithm are selected. Figure 15.3 depicts several screenshots of the planning software demonstrating how the right pyramidal tract is reconstructed and visualized. Clinical results of using pyramidal tract navigation in a routine setting for glioma resection showed that the occurrence of unwanted neurologic sequelae could be reduced. In a series of 70 patients where the pyramidal tract was visualized in the surgical field, in eight patients (11%) a new or aggravated postoperative paresis could be observed, which was transient in five of them. Thus, only in three patients (4.2%) there was a new permanent neurologic deficit.32 These data clearly support the concept of functional neuronavigation (i.e., adding functional information to 3D anatomic datasets to reduce postoperative morbidity when operating on lesions close to eloquent brain areas) (Fig. 15.3). Maximal safety may require combining electrophysiologic brain mapping with functional navigation that integrates fMRI/MEG-data and DTI-based fiber tracking acquired before or during surgery. Like cortical eloquent brain areas can be identified by intraoperative electrophysiologic mapping; subcortical electrical stimulation helps to identify major white matter tracts intraoperatively.33,34 Recent studies emphasize that functional neuronavigation and subcortical stimulation are complementary methods that may facilitate the preservation of pyramidal tracts. Wu et al showed that DTI-based functional neuronavigation resulted in a significant decrease in postoperative neurological deficits, as well as in an improved 6-month Karnofsky Performance Scale score, when comparing a group of 118 glioma patients that were operated with DTI-based functional neuronavigation with a control group that was operated without DTI data.35
Diffusion Tensor Imaging-Guided Resection
DTI Visualization Strategies
Fractional Anisotropy Maps
Glyph Representations
Fiber Tracking
Hulls
Integration of DTI into Navigation
Clinical Application
![]()
Stay updated, free articles. Join our Telegram channel


Full access? Get Clinical Tree


