Fig. 5.1
Analysis using the tract-based method. Tractographies were drawn using diffusion-weighted images (EPI imaging: TR/TE, 2300/122 ms; b = 1000 s/mm2; 6-axis encoding). Tractographies of the inferior occipitofrontal fasciculus (green), uncinate fasciculus (blue), and Meyer’s loop (yellow) are shown ((a) view from the bottom, (b) view from the right). Comparison of mean fractional anisotropy (FA) between patients with Alzheimer’s disease and controls is shown (c). The patients with Alzheimer’s disease had significantly lower mean FA than the controls on both sides of the uncinate fasciculus and on the left side of the inferior occipitofrontal fasciculus
5.3.2 Voxel-Based Analysis and Tract-Based Spatial Statistics (TBSS) Analysis
Voxel-based morphometry is an analysis method using voxel-wise comparison of the local brain structure between two groups of subjects using spatially normalized high-resolution images from all subjects in the study in the same stereotactic space. The voxel-based method is also applied to diffusion tensor data. Voxel-based analysis of diffusion tensor data is one method for objective analysis of tensor images in which the data for every voxel can be compared with the standard data after conversion to the normalized brain while keeping the local diffusion tensor information. Although this method prevents the variations among observers due to the automatic analysis, the computational load is large, and a long time is needed for computation. In addition, optimal analysis using standard registration algorithms has not been a satisfactory solution to the problem of how to align FA images from multiple subjects in a way that allows valid conclusions.
TBSS is an analysis method that aims to solve these problems using nonlinear registration, followed by projection onto an alignment-invariant white matter tract representation that is called the “mean FA skeleton” [9]. TBSS does not require a hypothesis, and white matter tracts of the whole brain can be analyzed. This technique does not require spatial smoothing, utilizes smaller steps for the comparison between voxels, has little computational complexity, and requires a relatively short computational time (Fig. 5.2). However, care should be taken with interpretation of the result because multiple fiber bundles can be reflected on a single FA skeleton. Histogram analysis is another method for evaluating diffusion tensor data including diffusivity and anisotropy [10]. Histogram analysis can be performed for the whole brain or a partial area and can provide objective information about the distribution profile of the diffusion tensor data. However, a problem with this approach is that the detailed spatial information is lost.

Fig. 5.2
Analysis using tract-based spatial statistics (TBSS). Comparison of Alzheimer’s disease cases (mild, moderate, severe) and controls using TBSS analysis. Areas with significantly decreased FA levels (p < 0.001) compared with controls are shown in orange. Decreases in FA are seen in the left temporal lobe and bilateral frontal lobe in mild cases (a). In moderate cases, the corpus callosum and cingulate gyrus also show decreases in FA (b). In severe cases, an anisotropic decrease is seen over a wide area (c)
The network-based approach or connectome study is a recently developed analysis method for understanding the function of neural networks in the brain [11]. Connectome studies include structural and functional connectivity, and diffusion tensor studies can provide information about the structural connectivity of all the measurable pathways in the brain. Connectivity is evaluated using graph theory, i.e., the study of “graphs,” which are mathematical structures used to model pairwise relationships between objects. Several metric methods can be used to evaluate connectivity or topological properties of the network including the clustering coefficient, characteristic path length, k-core, or small-worldness. Connectivity studies with diffusion tensor images can provide information on the large-scale connection patterns within the brain and also on the division of the human cortex into distinct areas based on a combination of structural and functional data in the same individual.
5.3.3 Non-Gaussian Distribution Diffusion
The diffusion tensor method is based on the premise that diffusion shows a Gaussian distribution. However, the Gaussian distribution is adapted to only free diffusion in a fluid and is uniform and sufficiently large. Complicated wall structures exist in the human body, and the Gaussian distribution model does not reflect the existence of a large number of compartments and nerve tracts, particularly in the central nervous system. Therefore, instead of a simple Gaussian distribution model, measurement of the probability distribution of a detailed water molecule is necessary. One method is q-space imaging (QSI) [12]. QSI is performed by measurement of a large amount of diffusion encoding and can provide the probability density function of water molecules. The shape of the probability density function curvature is characterized by the mean displacement of water molecules and is calculated from the full width at half height and probability for zero displacement, which is given by the height of the profile at zero displacement (Fig. 5.3). Although QSI is theoretically superior to conventional Gaussian distribution analysis, one limitation of QSI is the long acquisition time due to the large sampling number. The concept of kurtosis is another method to evaluate non-Gaussianity. Kurtosis is a quantity that reflects a gap between the diffusion distribution of a water molecule in vivo and the Gaussian distribution and can be calculated from datasets of relatively few diffusion encoding elements compared to QSI. Thus, a rather short acquisition time is required for kurtosis.

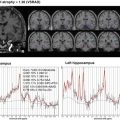
Fig. 5.3
Non-Gaussian diffusion analysis. Images obtained with QSI imaging are shown. In addition to diffusivity (a) and FA (b) images, which are the coefficients of the diffusion tensor data, zero-displacement probability density (c), mean displacement (d), and mean kurtosis (e) images are provided. Tract-based analysis of QSI for the limbic system including the uncinate and posterior cingulum in cases with Alzheimer’s disease compared with controls is shown [34]. Mean 0MaxProb values (f) for the uncinate were 3.06% in the left and 3.18% in the right side in Alzheimer’s disease cases. Mean 0MaxProb values for the posterior cingulum were 3.29% in the left and 3.31% in the right side. These 0MaxProb values were significantly (p < 0.001) smaller compared to controls. Mean displacement values for the uncinate were 12.2 μm in the left and 11.8 μm in the right side in Alzheimer’s disease cases. Mean displacement values (g) for the posterior cingulum were 11.6 μm in the left and 11.6 μm in the right side for the Alzheimer’s disease cases. These mean displacement values were significantly different (p < 0.001) compared to the controls except for the left posterior cingulum. Mean of meal apparent kurtosis coefficient (mAKC) values (h) for the uncinate were 0.55 in the left and 0.58 in the right side in Alzheimer’s disease cases. Mean mAKC values for the posterior cingulum were 0.61 in the left and 0.61 in the right side. These mAKC values were significantly (p < 0.001) lower compared to the controls. NS not significant
5.4 Reported Studies on White Matter Changes in Alzheimer’s Disease Using Various Methods for Analyzing Diffusion Tensor Data
Compared to the large number of imaging studies on gray matter changes in Alzheimer’s disease, white matter changes have been explored less frequently with imaging studies. However, several reports evaluating white matter with the diffusion tensor method for dementia cases including Alzheimer’s disease have been published. The following studies demonstrate the pathological changes detected with the diffusion tensor method in dementia disorders. Studies using manually located ROIs are still useful for evaluation of white matter changes in dementia cases. A study examined the neuropsychiatric symptoms that occur with MCI and Alzheimer’s dementia using manually located ROIs in the fornix, inferior cingulum, posterior cingulum, anterior cingulum, splenium, and cerebral peduncles. FA of the anterior cingulum and fornix regions was most strongly associated with neuropsychiatric symptoms, and low FA of the anterior cingulum was associated with increased odds of irritability in participants with mild Alzheimer’s disease and MCI [13]. Tract-based analysis is also used as an important tool in analysis of diffusion tensor data in dementia. A multicenter study using automated tractography of the cingulate bundle in Alzheimer’s disease was performed in nine centers comprising the “European DTI Study in Dementia Group” using different magnetic field (1.5 T and 3 T) scanners and different sets of motion proving gradients. Although significant center effects were observed, after adjustment for center and age, the Alzheimer’s disease group showed significantly higher diffusivity and lower anisotropy compared with the control group. Thus, diffusion tensor imaging indices of the cingulate bundle as obtained with automated tractography may be useful as a biologically sustained surrogate marker for diagnostic and monitoring purposes in multicenter Alzheimer’s disease trials [14]. TBSS has been used in many diffusion tensor studies on dementia. One report demonstrated that TBSS shows that decreases in diffusion anisotropy in the inferior longitudinal fasciculus are more prominent than in the superior longitudinal fasciculus in Alzheimer’s disease cases [15]. Another study showed that decreased diffusion anisotropy was seen only in the anterior temporal lobe in Alzheimer’s disease compared with the age-matched normal control group [16]. Another report showed a limitation of TBSS. This study compared evaluation using TBSS with atlas-based tractography in Alzheimer’s disease cases. Consistent results were obtained for the two methods. However, their atlas-based tractography approach but not TBSS detected a selective anisotropy change in the parietal corpus callosum and left temporal and occipital regions in patients with amnestic MCI compared to controls. This finding indicates that analysis including a higher number of voxels and the tractography-based method may detect the characteristic pattern of anisotropy in the corpus callosum of patients with preclinical Alzheimer’s disease when brain atrophy is still modest [17]. Thus, the study showed that skeletonizing diffusion tensor data with TBSS preprocessing may obscure subtle differences in anisotropy.
The network-based approach for diffusion tensor data was also applied in dementia cases. One study examined the relationship between measures of whole-brain white matter connectivity and cognitive performance in patients with early Alzheimer’s disease using a network-based approach. The study used diffusion tensor imaging-based tractography to reconstruct the brain network of each individual, followed by graph theoretical analyses. Overall network efficiency was assessed with measures of local and global connectivity and demonstrated that the structural brain network of patients had a reduced local efficiency compared to controls [18].
Recently developed connectivity studies have already been applied for evaluation of Alzheimer’s disease using diffusion tensor images. One study analyzed anatomical connectivity based on diffusion-weighted images from patients with Alzheimer’s disease, MCI, and healthy elderly persons in whom whole-brain tractography was performed. The data were analyzed based on orientation distribution functions, and connectivity matrices were compiled showing the proportions of detected fibers interconnecting 68 cortical regions. They found widespread network disruptions, because connections are lost in Alzheimer’s disease. In Alzheimer’s disease cases, the network nodal degree, normalized characteristic path length, and efficiency were decreased, whereas the normalized small-worldness and normalized clustering coefficient were increased [19].
Some studies have been performed using non-Gaussian diffusion MRI. Because QSI requires a longer acquisition time, a diffusion kurtosis study seemed practical. One such study investigated changes in the brain tissue microstructure of cases with MCI using diffusion kurtosis imaging [20]. They characterized and compared the microstructure in selected brain regions in terms of diffusion kurtosis imaging-derived metrics using analysis of covariance and found that mean and radial kurtoses in the anterior corona radiata were the best individual discriminators of patients with MCI from controls. Their results suggest that non-Gaussian diffusion MRI may be beneficial for assessing microstructural tissue damage at an early stage of MCI and may be useful in developing biomarkers for clinical staging of Alzheimer’s disease.
Related posts:
 Diagnostic Criteria for Alzheimer’s Disease
 Handling of MRI Data in a Multicenter Study
 Standardization and Quality Control of Brain PET Data in a Multicenter Study
 Neuroimaging Study of Alzheimer’s Disease in Volunteer-Based Cohort
 Proton Magnetic Resonance Spectroscopy for Dementia
 Brain Perfusion SPECT in Alzheimer’s Disease
Stay updated, free articles. Join our Telegram channel

Full access? Get Clinical Tree


