(1)
Intelligent Systems Research Centre, University of Ulster, Londonderry, UK
Abstract
In this chapter, we present methods to analyze three types of diffusion-weighted imaging (DWI), i.e., diffusion tensor imaging (DTI), Q-ball imaging (QBI), and diffusion spectrum imaging (DSI). DWI is one of the methods to measure water diffusion in tissues. It provides unique biologically and clinically relevant information that is not available from other imaging modalities. Because of its noninvasive nature, DWI has been applied widely in many studies, including but not limited to fiber tracts in cerebral cortex. We will begin with the physical background of diffusion MRI (dMRI), and then we will present method to compute the apparent diffusion coefficient (ADC) map and the eigenvalues for DTI study. After that, we introduce the measures for the water diffusion anisotropy and give one example fiber tractography method using DTI.
However, DTI method cannot resolve the crossing fiber issue; to overcome this limitation, Q-ball imaging (QBI) and diffusion spectrum imaging (DSI) with high angular resolution diffusion imaging (HARDI) acquisition have been proposed. QBI has the advantage of model-free and can reconstruct water diffusion orientation distribution function (ODF) from single-shell HARDI acquisition with relative small b value. To analyze QBI dataset, we introduce the concept of water molecule diffusion probability distribution function (PDF) and its relationship with ODF. Next, we show how to compute ODF from QBI using spherical harmonic approximation. Finally, we present generalized cross-validation (GCV) algorithm to regularize ODF for QBI analysis.
Although it takes longer time to acquire hundreds of DWI images for diffusion spectrum imaging (DSI) study, due to its high accuracy, DSI becomes more and more popular for studying fiber tracking and water diffusion in tissue. Like QBI, it is a model-free method and ODF can be estimated using 3D Fourier transformation method. Unlike QBI, DSI employs more than one b value/factor for data acquisition, while single-shell QBI adopts only one b factor. We briefly compare DSI with QBI, and then we apply fixed regularization parameter method and GCV regularization method for DSI ODF reconstruction.
Keywords
High angle resolution diffusion imaging (HARDI)Q-ball imaging (QBI)Diffusion spectrum imaging (DSI)Generalized cross validation (GCV)Fiber trackingDiffusion tensor imaging (DTI)Orientation distribution function (ODF)5.1 Basic Principle of Diffusion MRI and DTI Data Analysis
The physical theory background of diffusion tensor imaging (DTI) is Brownian motion [1]. Because water molecules in brain tissue are moved randomly in three dimensions, this molecular mobility may not be the same in all directions. This anisotropy may result from a peculiar physical arrangement of the medium or the presence of obstacles (such as fiber in white matter in the brain) that limit molecular movement in some directions. Therefore, water molecule diffusion in the direction of the fibers in the white matter of brain is faster than in the perpendicular direction. Based on this principle, we can exploit the fiber orientation map of the white matter in brain [1, 2]. Although many diffusion imaging modalities such as diffusion kurtosis image [3, 4] have been proposed, we will concentrate on the methods for analysis diffusion tensor imaging (DTI) [1], Q-ball imaging (QBI) [5], and diffusion spectrum imaging (DSI) [6, 7].
5.1.1 Physical Background of MRI Diffusion Equation
The physical background of MRI diffusion is based on two assumptions. The first assumption inherent to diffusion imaging is that the probability of the water molecule displacement in a given angular direction is related to the presence of a fiber bundle in this same direction. And the second is that the pulses of the sequences for collection diffusion weighted imaging (DWI) are infinitely narrow, i.e., the duration of the sensitizing gradients δ is much smaller than the time between pulses Δ, and the probability distribution function (PDF) of the displacement of a water molecule to a position R ∈ R 3 is given by the Fourier transform of the attenuation signal E(q) [8]:

where the value of q is given by

with γ representing the gyromagnetic ratio for water protons; where g is the applied diffusion gradient vector and δ is the diffusion gradient duration; and b ∼ q 2 ⋅ Δ, where Δ is the diffusion time interval and q is the gradient strength.

(5.1)

(5.2)
If we further assume the diffusion PDF is Gaussian, Eq. (5.1) reduces to the well-known Stejskal–Tanner equation [9]:

where τ = Δ − δ/3 is the effective diffusion time, D is the symmetric, positive definite covariance matrix diffusion tensor. The only unknowns are the six free components (due to symmetry) of the diffusion tensor (DT), so it is enough to know the value of E(q) for six independent gradient directions. Using b = 4π 2 τq 2, we have

where g = q/|q|, ADC is apparent diffusion coefficient (ADC), and b is the b value/factor which characterized the gradient pulses used in the MRI sequence.

(5.3)

(5.4)
5.1.2 Apparent Diffusion Coefficient (ADC) Map and DTI Calculation
If the tissue in brain is isotropic, then it is sufficient to characterize the diffusion characteristics with a single ADC [1, 10]. Assuming the water molecule diffusion PDF is Gaussian, from Eq. (5.4), we have

where S(b,g) and S 0 are the echo magnitudes of the diffusion-weighted and nondiffusion-weighted signals, respectively. However, in the presence of tissue anisotropy, where measured diffusivity is known to depend upon the orientation of the tissue, no single ADC can characterize the orientation-dependent water mobility in these tissues. To deal with this problem, we can apply a set of DWI images and their corresponding scalar factors to estimate an ADC along a particular direction using linear regression method. From Eq. (5.5), the DTI method to measure the water diffusion can be written as

where G i = (x i ,y i ,z i )T is the gradient directions and S i (b,g) is the corresponding diffusion-weighted signal along this direction. i = 1 : n is the number of the DWI images and D is the diffusion tensor which can be described as
![$$ D=\left[\begin{array}{ccc}\hfill {D}_{xx}\hfill & \hfill {D}_{xy}\hfill & \hfill {D}_{xz}\hfill \\ {}\hfill {D}_{yx}\hfill & \hfill {D}_{yy}\hfill & \hfill {D}_{yz}\hfill \\ {}\hfill {D}_{zx}\hfill & \hfill {D}_{zy}\hfill & \hfill {D}_{zz}\hfill \end{array}\right] $$](/wp-content/uploads/2016/04/A317179_1_En_5_Chapter_Equ7.gif)

(5.5)

(5.6)
![$$ D=\left[\begin{array}{ccc}\hfill {D}_{xx}\hfill & \hfill {D}_{xy}\hfill & \hfill {D}_{xz}\hfill \\ {}\hfill {D}_{yx}\hfill & \hfill {D}_{yy}\hfill & \hfill {D}_{yz}\hfill \\ {}\hfill {D}_{zx}\hfill & \hfill {D}_{zy}\hfill & \hfill {D}_{zz}\hfill \end{array}\right] $$](/wp-content/uploads/2016/04/A317179_1_En_5_Chapter_Equ7.gif)
(5.7)
Because the tensor is symmetric, i.e., D = D T or D jk = D jk , where j, k = x, y, z, it has six independent variables. From Eq. (5.6), for a n direction DTI, we can get the following linear equation:
![$$ \left[\arraycolsep4pt\begin{array}{cccccc}\hfill {x}_1^2\hfill & \hfill {y}_1^2\hfill & \hfill {z}_1^2\hfill & \hfill 2{x}_1{y}_1\hfill & \hfill 2{y}_1{z}_1\hfill & \hfill 2{z}_1{x}_1\hfill \\ {}\hfill {x}_2^2\hfill & \hfill {y}_2^2\hfill & \hfill {z}_2^2\hfill & \hfill 2{x}_2{y}_2\hfill & \hfill 2{y}_2{z}_2\hfill & \hfill 2{z}_2{x}_2\hfill \\ {}\hfill \vdots \hfill & \hfill \vdots \hfill & \hfill \vdots \hfill & \hfill \vdots \hfill & \hfill \vdots \hfill & \hfill \vdots \hfill \\ {}\hfill {x}_i^2\hfill & \hfill {y}_i^2\hfill & \hfill {z}_i^2\hfill & \hfill 2{x}_i{y}_i\hfill & \hfill 2{y}_i{z}_i\hfill & \hfill 2{z}_i{x}_i\hfill \\ {}\hfill \vdots \hfill & \hfill \vdots \hfill & \hfill \vdots \hfill & \hfill \vdots \hfill & \hfill \vdots \hfill & \hfill \vdots \hfill \\ {}\hfill {x}_n^2\hfill & \hfill {y}_n^2\hfill & \hfill {z}_n^2\hfill & \hfill 2{x}_n{y}_n\hfill & \hfill 2{y}_n{z}_n\hfill & \hfill 2{z}_n{x}_n\hfill \end{array}\right]\kern0.5em \left[\begin{array}{c}\hfill {D}_{xx}\hfill \\ {}\hfill {D}_{yy}\hfill \\ {}\hfill {D}_{zz}\hfill \\ {}\hfill {D}_{xy}\hfill \\ {}\hfill {D}_{yz}\hfill \\ {}\hfill {D}_{zx}\hfill \end{array}\right]+\left[\begin{array}{c}\hfill {e}_1\hfill \\ {}\hfill {e}_2\hfill \\ {}\hfill \vdots \hfill \\ {}\hfill {e}_i\hfill \\ {}\hfill \vdots \hfill \\ {}\hfill {e}_n\hfill \end{array}\right]=-\frac{1}{b}\left[\begin{array}{c}\hfill \ln \frac{S_1\left(b,g\right)}{S_0}\hfill \\ {}\hfill \ln \frac{S_2\left(b,g\right)}{S_0}\hfill \\ {}\hfill \vdots \hfill \\ {}\hfill \ln \frac{S_i\left(b,g\right)}{S_0}\hfill \\ {}\hfill \vdots \hfill \\ {}\hfill \ln \frac{S_n\left(b,g\right)}{S_0}\hfill \end{array}\right] $$](/wp-content/uploads/2016/04/A317179_1_En_5_Chapter_Equ8.gif)
to estimate diffusion tensor D in Eq. (5.7), where e i , e 2, …, e n are the estimation errors. It is obvious that this equation can be written as

where
![$$ \begin{array}{lllll} X&=\left[\arraycolsep4pt\begin{array}{cccccc}\hfill {x}_1^2\hfill & \hfill {y}_1^2\hfill & \hfill {z}_1^2\hfill & \hfill 2{x}_1{y}_1\hfill & \hfill 2{y}_1{z}_1\hfill & \hfill 2{z}_1{x}_1\hfill \\ {}\hfill {x}_2^2\hfill & \hfill {y}_2^2\hfill & \hfill {z}_2^2\hfill & \hfill 2{x}_2{y}_2\hfill & \hfill 2{y}_2{z}_2\hfill & \hfill 2{z}_2{x}_2\hfill \\ {}\hfill \vdots \hfill & \hfill \vdots \hfill & \hfill \vdots \hfill & \hfill \vdots \hfill & \hfill \vdots \hfill & \hfill \vdots \hfill \\ {}\hfill {x}_i^2\hfill & \hfill {y}_i^2\hfill & \hfill {z}_i^2\hfill & \hfill 2{x}_i{y}_i\hfill & \hfill 2{y}_i{z}_i\hfill & \hfill 2{z}_i{x}_i\hfill \\ {}\hfill \vdots \hfill & \hfill \vdots \hfill & \hfill \vdots \hfill & \hfill \vdots \hfill & \hfill \vdots \hfill & \hfill \vdots \hfill \\ {}\hfill {x}_n^2\hfill & \hfill {y}_n^2\hfill & \hfill {z}_n^2\hfill & \hfill 2{x}_n{y}_n\hfill & \hfill 2{y}_n{z}_n\hfill & \hfill 2{z}_n{x}_n\hfill \end{array}\right],\beta =\left[\begin{array}{c}\hfill {D}_{xx}\hfill \\ {}\hfill {D}_{yy}\hfill \\ {}\hfill {D}_{zz}\hfill \\ {}\hfill {D}_{xy}\hfill \\ {}\hfill {D}_{yz}\hfill \\ {}\hfill {D}_{zx}\hfill \end{array}\right],e=\left[\begin{array}{c}\hfill {e}_1\hfill \\ {}\hfill {e}_2\hfill \\ {}\hfill \vdots \hfill \\ {}\hfill {e}_i\hfill \\ {}\hfill \vdots \hfill \\ {}\hfill {e}_n\hfill \end{array}\right],\\ Y &=-\frac{1}{b}\left[\begin{array}{c}\hfill \ln \frac{S_1\left(b,g\right)}{S_0}\hfill \\ {}\hfill \ln \frac{S_2\left(b,g\right)}{S_0}\hfill \\ {}\hfill \vdots \hfill \\ {}\hfill \ln \frac{S_i\left(b,g\right)}{S_0}\hfill \\ {}\hfill \vdots \hfill \\ {}\hfill \ln \frac{S_n\left(b,g\right)}{S_0}\hfill \end{array}\right]. \end{array}$$](/wp-content/uploads/2016/04/A317179_1_En_5_Chapter_Equa.gif) where X is the predefined gradient vector and Y is the diffusion-weighted signal. We only need to estimate β in the linear equation. If only six independent direction diffusion-weighted images are available, then the rank of matrix X is six, and Eq. (5.8) has unique solution. However, if more than six independent directions are available, we need to solve the overdetermined system to get the optimal solution, i.e., minimize sum square error (SSE) of Eq. (5.9); this leads to minimize (compare Eq. (2.9) in Chap. 2)
where X is the predefined gradient vector and Y is the diffusion-weighted signal. We only need to estimate β in the linear equation. If only six independent direction diffusion-weighted images are available, then the rank of matrix X is six, and Eq. (5.8) has unique solution. However, if more than six independent directions are available, we need to solve the overdetermined system to get the optimal solution, i.e., minimize sum square error (SSE) of Eq. (5.9); this leads to minimize (compare Eq. (2.9) in Chap. 2)

![$$ \left[\arraycolsep4pt\begin{array}{cccccc}\hfill {x}_1^2\hfill & \hfill {y}_1^2\hfill & \hfill {z}_1^2\hfill & \hfill 2{x}_1{y}_1\hfill & \hfill 2{y}_1{z}_1\hfill & \hfill 2{z}_1{x}_1\hfill \\ {}\hfill {x}_2^2\hfill & \hfill {y}_2^2\hfill & \hfill {z}_2^2\hfill & \hfill 2{x}_2{y}_2\hfill & \hfill 2{y}_2{z}_2\hfill & \hfill 2{z}_2{x}_2\hfill \\ {}\hfill \vdots \hfill & \hfill \vdots \hfill & \hfill \vdots \hfill & \hfill \vdots \hfill & \hfill \vdots \hfill & \hfill \vdots \hfill \\ {}\hfill {x}_i^2\hfill & \hfill {y}_i^2\hfill & \hfill {z}_i^2\hfill & \hfill 2{x}_i{y}_i\hfill & \hfill 2{y}_i{z}_i\hfill & \hfill 2{z}_i{x}_i\hfill \\ {}\hfill \vdots \hfill & \hfill \vdots \hfill & \hfill \vdots \hfill & \hfill \vdots \hfill & \hfill \vdots \hfill & \hfill \vdots \hfill \\ {}\hfill {x}_n^2\hfill & \hfill {y}_n^2\hfill & \hfill {z}_n^2\hfill & \hfill 2{x}_n{y}_n\hfill & \hfill 2{y}_n{z}_n\hfill & \hfill 2{z}_n{x}_n\hfill \end{array}\right]\kern0.5em \left[\begin{array}{c}\hfill {D}_{xx}\hfill \\ {}\hfill {D}_{yy}\hfill \\ {}\hfill {D}_{zz}\hfill \\ {}\hfill {D}_{xy}\hfill \\ {}\hfill {D}_{yz}\hfill \\ {}\hfill {D}_{zx}\hfill \end{array}\right]+\left[\begin{array}{c}\hfill {e}_1\hfill \\ {}\hfill {e}_2\hfill \\ {}\hfill \vdots \hfill \\ {}\hfill {e}_i\hfill \\ {}\hfill \vdots \hfill \\ {}\hfill {e}_n\hfill \end{array}\right]=-\frac{1}{b}\left[\begin{array}{c}\hfill \ln \frac{S_1\left(b,g\right)}{S_0}\hfill \\ {}\hfill \ln \frac{S_2\left(b,g\right)}{S_0}\hfill \\ {}\hfill \vdots \hfill \\ {}\hfill \ln \frac{S_i\left(b,g\right)}{S_0}\hfill \\ {}\hfill \vdots \hfill \\ {}\hfill \ln \frac{S_n\left(b,g\right)}{S_0}\hfill \end{array}\right] $$](/wp-content/uploads/2016/04/A317179_1_En_5_Chapter_Equ8.gif)
(5.8)

(5.9)
![$$ \begin{array}{lllll} X&=\left[\arraycolsep4pt\begin{array}{cccccc}\hfill {x}_1^2\hfill & \hfill {y}_1^2\hfill & \hfill {z}_1^2\hfill & \hfill 2{x}_1{y}_1\hfill & \hfill 2{y}_1{z}_1\hfill & \hfill 2{z}_1{x}_1\hfill \\ {}\hfill {x}_2^2\hfill & \hfill {y}_2^2\hfill & \hfill {z}_2^2\hfill & \hfill 2{x}_2{y}_2\hfill & \hfill 2{y}_2{z}_2\hfill & \hfill 2{z}_2{x}_2\hfill \\ {}\hfill \vdots \hfill & \hfill \vdots \hfill & \hfill \vdots \hfill & \hfill \vdots \hfill & \hfill \vdots \hfill & \hfill \vdots \hfill \\ {}\hfill {x}_i^2\hfill & \hfill {y}_i^2\hfill & \hfill {z}_i^2\hfill & \hfill 2{x}_i{y}_i\hfill & \hfill 2{y}_i{z}_i\hfill & \hfill 2{z}_i{x}_i\hfill \\ {}\hfill \vdots \hfill & \hfill \vdots \hfill & \hfill \vdots \hfill & \hfill \vdots \hfill & \hfill \vdots \hfill & \hfill \vdots \hfill \\ {}\hfill {x}_n^2\hfill & \hfill {y}_n^2\hfill & \hfill {z}_n^2\hfill & \hfill 2{x}_n{y}_n\hfill & \hfill 2{y}_n{z}_n\hfill & \hfill 2{z}_n{x}_n\hfill \end{array}\right],\beta =\left[\begin{array}{c}\hfill {D}_{xx}\hfill \\ {}\hfill {D}_{yy}\hfill \\ {}\hfill {D}_{zz}\hfill \\ {}\hfill {D}_{xy}\hfill \\ {}\hfill {D}_{yz}\hfill \\ {}\hfill {D}_{zx}\hfill \end{array}\right],e=\left[\begin{array}{c}\hfill {e}_1\hfill \\ {}\hfill {e}_2\hfill \\ {}\hfill \vdots \hfill \\ {}\hfill {e}_i\hfill \\ {}\hfill \vdots \hfill \\ {}\hfill {e}_n\hfill \end{array}\right],\\ Y &=-\frac{1}{b}\left[\begin{array}{c}\hfill \ln \frac{S_1\left(b,g\right)}{S_0}\hfill \\ {}\hfill \ln \frac{S_2\left(b,g\right)}{S_0}\hfill \\ {}\hfill \vdots \hfill \\ {}\hfill \ln \frac{S_i\left(b,g\right)}{S_0}\hfill \\ {}\hfill \vdots \hfill \\ {}\hfill \ln \frac{S_n\left(b,g\right)}{S_0}\hfill \end{array}\right]. \end{array}$$](/wp-content/uploads/2016/04/A317179_1_En_5_Chapter_Equa.gif)

(5.10)
5.1.3 Invariant Indices for DTI Analysis
Afterβ or diffusion tensor in Eq. (5.7) has been estimated, we need to calculate the eigenvalue and eigenvector of D. From linear algebra, we know that for every symmetric real matrix D, there exists a real orthogonal matrix Q such that

is a diagonal matrix. The diagonal elements of A are eigenvalues of matrix D and Q = (q 1,q 2,q 3)T consisting of eigenvectors for D. From this, we obtain the eigenvalues of D as
![$$ D\sim A=\left[\arraycolsep3pt\begin{array}{ccc}\hfill {\lambda}_1\hfill & \hfill 0\hfill & \hfill 0\hfill \\ {}\hfill 0\hfill & \hfill {\lambda}_2\hfill & \hfill 0\hfill \\ {}\hfill 0\hfill & \hfill 0\hfill & \hfill {\lambda}_3\hfill \end{array}\right] $$](/wp-content/uploads/2016/04/A317179_1_En_5_Chapter_Equ12.gif)
where λ 1 > λ 2 > λ 3 are eigenvalues of matrix D. Based on these eigenvalues, we introduce the invariant indices for DTI analysis. The most commonly used invariant indices are the mean diffusivity (MD), relative anisotropy (RA), fractional anisotropy (FA), and volume ration (VR) indices, defined as follows:


![$$ \mathrm{FA}=\frac{\sqrt{3\left[{\left({\lambda}_1-\overline{\lambda}\right)}^2+{\left({\lambda}_2-\overline{\lambda}\right)}^2+{\left({\lambda}_3-\overline{\lambda}\right)}^2\right]}}{\sqrt{2\left({\lambda}_1^2+{\lambda}_2^2+{\lambda}_3^2\right)}} $$](/wp-content/uploads/2016/04/A317179_1_En_5_Chapter_Equ15.gif)
and


(5.11)
![$$ D\sim A=\left[\arraycolsep3pt\begin{array}{ccc}\hfill {\lambda}_1\hfill & \hfill 0\hfill & \hfill 0\hfill \\ {}\hfill 0\hfill & \hfill {\lambda}_2\hfill & \hfill 0\hfill \\ {}\hfill 0\hfill & \hfill 0\hfill & \hfill {\lambda}_3\hfill \end{array}\right] $$](/wp-content/uploads/2016/04/A317179_1_En_5_Chapter_Equ12.gif)
(5.12)

(5.13)

(5.14)
![$$ \mathrm{FA}=\frac{\sqrt{3\left[{\left({\lambda}_1-\overline{\lambda}\right)}^2+{\left({\lambda}_2-\overline{\lambda}\right)}^2+{\left({\lambda}_3-\overline{\lambda}\right)}^2\right]}}{\sqrt{2\left({\lambda}_1^2+{\lambda}_2^2+{\lambda}_3^2\right)}} $$](/wp-content/uploads/2016/04/A317179_1_En_5_Chapter_Equ15.gif)
(5.15)

(5.16)
RA is a normalized standard deviation and also represents the ratio of the anisotropic part of D to its isotropic part. FA measures the fraction of the “magnitude” of D that can be ascribed to anisotropic diffusion; FA and RA vary between 0 (isotropic diffusion) and 1 ( for RA) (infinite anisotropy). VR represents the ratio of the ellipsoid volume to the volume of a sphere of radius
  ; its range is from 1 (isotropic diffusion) to 0 [1].
 for RA) (infinite anisotropy). VR represents the ratio of the ellipsoid volume to the volume of a sphere of radius
  ; its range is from 1 (isotropic diffusion) to 0 [1].
To give an example of FA map, one set of data from Appendix I was employed. Figure 5.1a, b shows the structural image of this subject, while Fig. 5.1c, d displays the corresponding FA images. From these figures, it is evident that white matter has larger FA values than the gray matter, suggesting that white matter has a larger anisotropy than the gray matter.
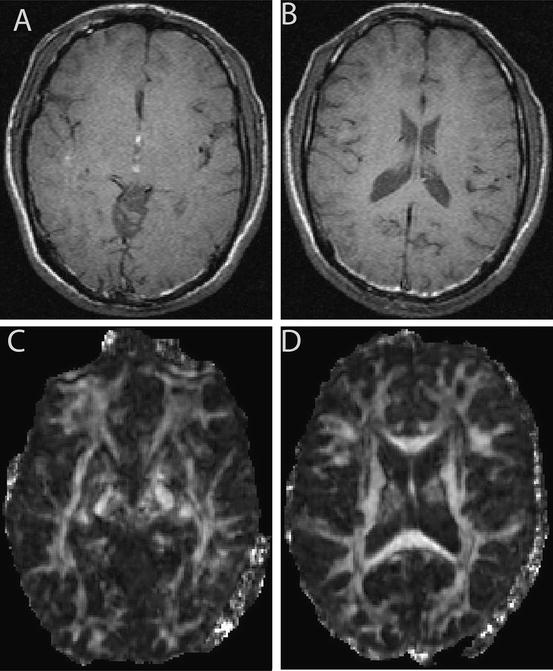

Fig. 5.1
Structural image and its FA maps. (a and b) are MRI structural images. (c and d) are the corresponding FA maps
5.1.4 High-Order DTI Data Analysis
The second-order tensor (Eq. (5.6)) is depicted as a 3 × 3 matrix and has six independent components. This may not be adequate to describe water diffusion processing; to overcome this limitation, generalized diffusion tensor imaging [11, 12] has been proposed and it can be expressed as

where  denotes tensor,
  represents gradient direction tensor, and
  . This equation can be expended to the following if we only used the first four terms:


(5.17)
 denotes tensor,
  represents gradient direction tensor, and
  . This equation can be expended to the following if we only used the first four terms:
(5.18)
For example, where  is second-order tensor, which can be expressed in Eq. (5.7) and
  can be written as
![$$ {D}^{(4)}=\left[\arraycolsep3pt\begin{array}{ccccccccc}\hfill {D}_{xxxx}\hfill & \hfill {D}_{xxxy}\hfill & \hfill {D}_{xxxz}\hfill & \hfill {D}_{xxxy}\hfill & \hfill {D}_{xxyy}\hfill & \hfill {D}_{xxyz}\hfill & \hfill {D}_{xxxz}\hfill & \hfill {D}_{xxyz}\hfill & \hfill {D}_{xxzz}\hfill \\ {}\hfill {D}_{xxxy}\hfill & \hfill {D}_{xxyy}\hfill & \hfill {D}_{xxyz}\hfill & \hfill {D}_{xxyy}\hfill & \hfill {D}_{xyyy}\hfill & \hfill {D}_{xyyz}\hfill & \hfill {D}_{xxyz}\hfill & \hfill {D}_{xyyz}\hfill & \hfill {D}_{xyzz}\hfill \\ {}\hfill {D}_{xxxz}\hfill & \hfill {D}_{xxyz}\hfill & \hfill {D}_{xxzz}\hfill & \hfill {D}_{xxyz}\hfill & \hfill {D}_{xyyz}\hfill & \hfill {D}_{xyzz}\hfill & \hfill {D}_{xxzz}\hfill & \hfill {D}_{xyzz}\hfill & \hfill {D}_{xzzz}\hfill \\ {}\hfill {D}_{xxxy}\hfill & \hfill {D}_{xxyy}\hfill & \hfill {D}_{xxyz}\hfill & \hfill {D}_{xxyy}\hfill & \hfill {D}_{xyyy}\hfill & \hfill {D}_{xyyz}\hfill & \hfill {D}_{xxyz}\hfill & \hfill {D}_{xyyz}\hfill & \hfill {D}_{xyzz}\hfill \\ {}\hfill {D}_{xxyy}\hfill & \hfill {D}_{xyyy}\hfill & \hfill {D}_{xyyz}\hfill & \hfill {D}_{xyyy}\hfill & \hfill {D}_{yyyy}\hfill & \hfill {D}_{yyyz}\hfill & \hfill {D}_{xyyz}\hfill & \hfill {D}_{yyyz}\hfill & \hfill {D}_{yyzz}\hfill \\ {}\hfill {D}_{xxyz}\hfill & \hfill {D}_{xyyz}\hfill & \hfill {D}_{xyzz}\hfill & \hfill {D}_{xyyz}\hfill & \hfill {D}_{yyyz}\hfill & \hfill {D}_{yyzz}\hfill & \hfill {D}_{xyzz}\hfill & \hfill {D}_{yyzz}\hfill & \hfill {D}_{yzzz}\hfill \\ {}\hfill {D}_{xxxz}\hfill & \hfill {D}_{xxyz}\hfill & \hfill {D}_{xxzz}\hfill & \hfill {D}_{xxyz}\hfill & \hfill {D}_{xyyz}\hfill & \hfill {D}_{xyzz}\hfill & \hfill {D}_{xxzz}\hfill & \hfill {D}_{xyzz}\hfill & \hfill {D}_{xzzz}\hfill \\ {}\hfill {D}_{xxyz}\hfill & \hfill {D}_{xyyz}\hfill & \hfill {D}_{xyzz}\hfill & \hfill {D}_{xyyz}\hfill & \hfill {D}_{yyyz}\hfill & \hfill {D}_{yyzz}\hfill & \hfill {D}_{xyzz}\hfill & \hfill {D}_{yyzz}\hfill & \hfill {D}_{yzzz}\hfill \\ {}\hfill {D}_{xxzz}\hfill & \hfill {D}_{xyzz}\hfill & \hfill {D}_{xzzz}\hfill & \hfill {D}_{xyzz}\hfill & \hfill {D}_{yyzz}\hfill & \hfill {D}_{yzzz}\hfill & \hfill {D}_{xzzz}\hfill & \hfill {D}_{yzzz}\hfill & \hfill {D}_{zzzz}\hfill \end{array}\right] $$](/wp-content/uploads/2016/04/A317179_1_En_5_Chapter_Equ19.gif)
 is second-order tensor, which can be expressed in Eq. (5.7) and
  can be written as
![$$ {D}^{(4)}=\left[\arraycolsep3pt\begin{array}{ccccccccc}\hfill {D}_{xxxx}\hfill & \hfill {D}_{xxxy}\hfill & \hfill {D}_{xxxz}\hfill & \hfill {D}_{xxxy}\hfill & \hfill {D}_{xxyy}\hfill & \hfill {D}_{xxyz}\hfill & \hfill {D}_{xxxz}\hfill & \hfill {D}_{xxyz}\hfill & \hfill {D}_{xxzz}\hfill \\ {}\hfill {D}_{xxxy}\hfill & \hfill {D}_{xxyy}\hfill & \hfill {D}_{xxyz}\hfill & \hfill {D}_{xxyy}\hfill & \hfill {D}_{xyyy}\hfill & \hfill {D}_{xyyz}\hfill & \hfill {D}_{xxyz}\hfill & \hfill {D}_{xyyz}\hfill & \hfill {D}_{xyzz}\hfill \\ {}\hfill {D}_{xxxz}\hfill & \hfill {D}_{xxyz}\hfill & \hfill {D}_{xxzz}\hfill & \hfill {D}_{xxyz}\hfill & \hfill {D}_{xyyz}\hfill & \hfill {D}_{xyzz}\hfill & \hfill {D}_{xxzz}\hfill & \hfill {D}_{xyzz}\hfill & \hfill {D}_{xzzz}\hfill \\ {}\hfill {D}_{xxxy}\hfill & \hfill {D}_{xxyy}\hfill & \hfill {D}_{xxyz}\hfill & \hfill {D}_{xxyy}\hfill & \hfill {D}_{xyyy}\hfill & \hfill {D}_{xyyz}\hfill & \hfill {D}_{xxyz}\hfill & \hfill {D}_{xyyz}\hfill & \hfill {D}_{xyzz}\hfill \\ {}\hfill {D}_{xxyy}\hfill & \hfill {D}_{xyyy}\hfill & \hfill {D}_{xyyz}\hfill & \hfill {D}_{xyyy}\hfill & \hfill {D}_{yyyy}\hfill & \hfill {D}_{yyyz}\hfill & \hfill {D}_{xyyz}\hfill & \hfill {D}_{yyyz}\hfill & \hfill {D}_{yyzz}\hfill \\ {}\hfill {D}_{xxyz}\hfill & \hfill {D}_{xyyz}\hfill & \hfill {D}_{xyzz}\hfill & \hfill {D}_{xyyz}\hfill & \hfill {D}_{yyyz}\hfill & \hfill {D}_{yyzz}\hfill & \hfill {D}_{xyzz}\hfill & \hfill {D}_{yyzz}\hfill & \hfill {D}_{yzzz}\hfill \\ {}\hfill {D}_{xxxz}\hfill & \hfill {D}_{xxyz}\hfill & \hfill {D}_{xxzz}\hfill & \hfill {D}_{xxyz}\hfill & \hfill {D}_{xyyz}\hfill & \hfill {D}_{xyzz}\hfill & \hfill {D}_{xxzz}\hfill & \hfill {D}_{xyzz}\hfill & \hfill {D}_{xzzz}\hfill \\ {}\hfill {D}_{xxyz}\hfill & \hfill {D}_{xyyz}\hfill & \hfill {D}_{xyzz}\hfill & \hfill {D}_{xyyz}\hfill & \hfill {D}_{yyyz}\hfill & \hfill {D}_{yyzz}\hfill & \hfill {D}_{xyzz}\hfill & \hfill {D}_{yyzz}\hfill & \hfill {D}_{yzzz}\hfill \\ {}\hfill {D}_{xxzz}\hfill & \hfill {D}_{xyzz}\hfill & \hfill {D}_{xzzz}\hfill & \hfill {D}_{xyzz}\hfill & \hfill {D}_{yyzz}\hfill & \hfill {D}_{yzzz}\hfill & \hfill {D}_{xzzz}\hfill & \hfill {D}_{yzzz}\hfill & \hfill {D}_{zzzz}\hfill \end{array}\right] $$](/wp-content/uploads/2016/04/A317179_1_En_5_Chapter_Equ19.gif)
(5.19)
The 15 independent components of D (4) and its repetitions are as follows: 1 × D xxxx , 1 × D yyyy , 1 × D zzzz , 4 × D yzzz , 4 × D xzzz , 4 × D xyyy , 4 × D yyyz , 4 × D xxxz , 4 × D xxxy , 12 × D xxyz , 12 × D xyyz , 12 × D xyzz , 6 × D yyzz , 6 × D xxzz , and 6 × D xxyy . From Eq. (5.18), it is easy to see that the real part of the logarithmic signal is solely determined by the even-order tensors, while the imaginary part is completely governed by odd-order tensors. Considering second-order tensor has six independent components and fourth-order tensor has 15 independent components, these are the parameters that need to be estimated. Taking into account the symmetry of  and
and  , and based on the real part of the logarithmic signal in Eq. (5.18), we have the following relation:
![$$ \begin{array}{lllll} {}& \left[\arraycolsep5pt\begin{array}{cccccccc}\hfill -{x}_1^2\hfill & \hfill -{y}_1^2\hfill & \hfill \cdots \hfill & \hfill -2{x}_1{z}_1\hfill & \hfill {x}_1^4\hfill & \hfill {y}_1^4\hfill & \hfill \cdots \hfill & \hfill 6{x}_1^2{y}_1^2\hfill \\ {}\hfill -{x}_2^2\hfill & \hfill -{y}_2^2\hfill & \hfill \cdots \hfill & \hfill -2{x}_2{z}_2\hfill & \hfill {x}_2^4\hfill & \hfill {y}_2^4\hfill & \hfill \cdots \hfill & \hfill 6{x}_2^2{y}_2^2\hfill \\ {}\hfill \vdots \hfill & \hfill \vdots \hfill & \hfill \ddots \hfill & \hfill \vdots \hfill & \hfill \vdots \hfill & \hfill \vdots \hfill & \hfill \ddots \hfill & \hfill \vdots \hfill \\ {}\hfill -{x}_n^2\hfill & \hfill -{y}_n^2\hfill & \hfill \cdots \hfill & \hfill -2{x}_n{z}_n\hfill & \hfill {x}_n^4\hfill & \hfill {y}_n^4\hfill & \hfill \cdots \hfill & \hfill 6{x}_n^2{y}_n^2\hfill \end{array}\right]\kern0.5em \left[\begin{array}{c}\hfill {D}_{xx}\hfill \\ {}\hfill {D}_{yy}\hfill \\ {}\hfill \vdots \hfill \\ {}\hfill {D}_{zx}\hfill \\ {}\hfill {D}_{xx xx}\hfill \\ {}\hfill {D}_{yy yy}\hfill \\ {}\hfill \vdots \hfill \\ {}\hfill {D}_{xx yy}\hfill \end{array}\right]+\left[\begin{array}{c}\hfill {e}_1\hfill \\ {}\hfill {e}_2\hfill \\ {}\hfill \vdots \hfill \\ {}\hfill {e}_i\hfill \\ {}\hfill \vdots \hfill \\ {}\hfill {e}_n\hfill \end{array}\right]\\[-2pt] &=\frac{1}{b}\left[\begin{array}{c}\hfill \ln \dfrac{S_1\left(b,g\right)}{S_0}\hfill \\ {}\hfill \ln \dfrac{S_2\left(b,g\right)}{S_0}\hfill \\ \vdots \hfill \\ {}\hfill \ln \dfrac{S_i\left(b,g\right)}{S_0}\hfill \\ \vdots \hfill \\ {}\hfill \ln \dfrac{S_n\left(b,g\right)}{S_0}\hfill \end{array}\right] \end{array} \raisetag{5pc} $$](/wp-content/uploads/2016/04/A317179_1_En_5_Chapter_Equ20.gif)
 and
and  , and based on the real part of the logarithmic signal in Eq. (5.18), we have the following relation:
![$$ \begin{array}{lllll} {}& \left[\arraycolsep5pt\begin{array}{cccccccc}\hfill -{x}_1^2\hfill & \hfill -{y}_1^2\hfill & \hfill \cdots \hfill & \hfill -2{x}_1{z}_1\hfill & \hfill {x}_1^4\hfill & \hfill {y}_1^4\hfill & \hfill \cdots \hfill & \hfill 6{x}_1^2{y}_1^2\hfill \\ {}\hfill -{x}_2^2\hfill & \hfill -{y}_2^2\hfill & \hfill \cdots \hfill & \hfill -2{x}_2{z}_2\hfill & \hfill {x}_2^4\hfill & \hfill {y}_2^4\hfill & \hfill \cdots \hfill & \hfill 6{x}_2^2{y}_2^2\hfill \\ {}\hfill \vdots \hfill & \hfill \vdots \hfill & \hfill \ddots \hfill & \hfill \vdots \hfill & \hfill \vdots \hfill & \hfill \vdots \hfill & \hfill \ddots \hfill & \hfill \vdots \hfill \\ {}\hfill -{x}_n^2\hfill & \hfill -{y}_n^2\hfill & \hfill \cdots \hfill & \hfill -2{x}_n{z}_n\hfill & \hfill {x}_n^4\hfill & \hfill {y}_n^4\hfill & \hfill \cdots \hfill & \hfill 6{x}_n^2{y}_n^2\hfill \end{array}\right]\kern0.5em \left[\begin{array}{c}\hfill {D}_{xx}\hfill \\ {}\hfill {D}_{yy}\hfill \\ {}\hfill \vdots \hfill \\ {}\hfill {D}_{zx}\hfill \\ {}\hfill {D}_{xx xx}\hfill \\ {}\hfill {D}_{yy yy}\hfill \\ {}\hfill \vdots \hfill \\ {}\hfill {D}_{xx yy}\hfill \end{array}\right]+\left[\begin{array}{c}\hfill {e}_1\hfill \\ {}\hfill {e}_2\hfill \\ {}\hfill \vdots \hfill \\ {}\hfill {e}_i\hfill \\ {}\hfill \vdots \hfill \\ {}\hfill {e}_n\hfill \end{array}\right]\\[-2pt] &=\frac{1}{b}\left[\begin{array}{c}\hfill \ln \dfrac{S_1\left(b,g\right)}{S_0}\hfill \\ {}\hfill \ln \dfrac{S_2\left(b,g\right)}{S_0}\hfill \\ \vdots \hfill \\ {}\hfill \ln \dfrac{S_i\left(b,g\right)}{S_0}\hfill \\ \vdots \hfill \\ {}\hfill \ln \dfrac{S_n\left(b,g\right)}{S_0}\hfill \end{array}\right] \end{array} \raisetag{5pc} $$](/wp-content/uploads/2016/04/A317179_1_En_5_Chapter_Equ20.gif)
(5.20)
5.2 Fiber Tracking
Based on the assumption that the direction of the fibers is collinear with the direction of the eigenvector associated with the largest eigenvalue diffusivity, we can estimate fiber orientation. Roughly, there are three ways to represent fiber orientation on a voxel by voxel basis, i.e., color-encoded method, ellipsoids, and 3D display methods [1].
5.2.1 Color Encoding Method to Represent Fiber
To visualize fiber direction, one idea is to assign different color components to DWI or ADC maps acquired with gradients applied in perpendicular directions. We introduce commonly used color representation of fiber orientation, and one way to represent color scheme is based on the eigenvector from DTI. From Eqs. (5.8) and (5.11), we obtain three eigenvector, Q = (q 1,q 2,q 3), then we normalize the eigenvector as


(5.21)
Next we modulate each component with FA map using


(5.22)
Because the r, g, and b maps are often disturbed by strong computational noise, Wiener or Gaussian filters are often adopted to smooth these images, and because in the RGB color space all values have to be mapped within the range of [0 1], this can be achieved using the following formula:


(5.23)
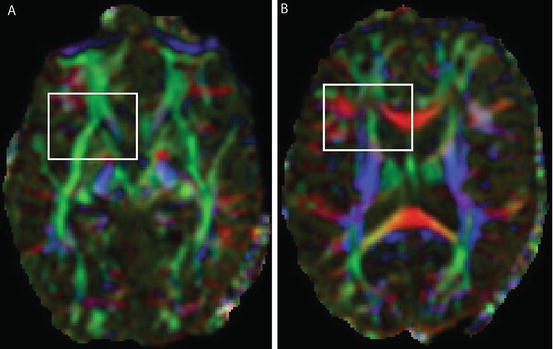
Finally, the color-encoded FA map becomes RGB = [R,G,B]. Figure 5.2 shows color-encoded FA maps from Fig. 5.1c, d. The fiber direction map is represented by different color.
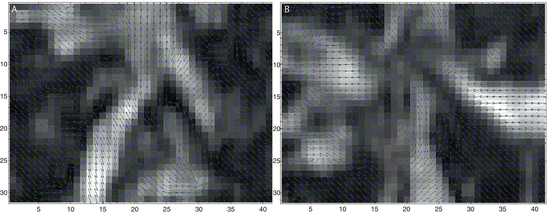
Another way to display fiber direction is to overlay arrow (orientation) information which denotes water diffusion direction on the FA maps as given in Fig. 5.3. FA map in Fig. 5.3a is from the white box regions (Fig. 5.2a), while Fig. 5.3b exhibits the direction map from Fig. 5.2b. It is obvious that the region with high FA value has the stronger and more obvious fiber direction than the region with low FA values.
5.2.2 Fiber Tracking and 3D Representation
In recent year, there has been an increasing interest in developing fiber tacking algorithm to represent fiber in 3D space. For example, fast matching method [13], probability density distribution function method [14], and best neighbor method have been suggested for fiber tracking [15, 16]. Because of its conceptual simplicity, we introduce best neighbor method for fiber tracking in this chapter.
We begin with 2D case. Assume we are at current pixel position A in Fig. 5.4 with coordinate of (0,0). The purpose of fiber tracking is to search for the next pixel which is supposed to be connected to the current pixel. Because for any pixel in brain image, it has eight neighbors as shown in Fig. 5.4; we start from the pixel A and calculate angles between voxel A and B, and  and
and  using
using
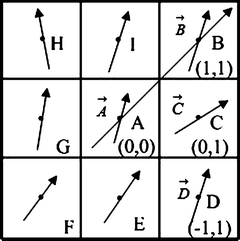
![$$ \begin{array}{lllll}[b] {\alpha}_1&= \arccos \left(\frac{\overrightarrow{A}\cdot AB}{\left|\overrightarrow{A}\right|\cdot \left| AB\right|}\right),\\ {\alpha}_2 &= \arccos \left(\frac{\overrightarrow{B}\cdot AB}{\left|\overrightarrow{B}\right|\cdot \left| AB\right|}\right),\kern1em {\alpha}_3= \arccos \left(\frac{\overrightarrow{A}\cdot \overrightarrow{B}}{\left|\overrightarrow{A}\right|\cdot \left|\overrightarrow{B}\right|}\right) \end{array}$$](/wp-content/uploads/2016/04/A317179_1_En_5_Chapter_Equ24.gif)
where α 1, α 2, and α 3 represent the angle between two vectors  and AB,
  and AB, and
  , and
, and  , respectively. Then we define the curvature criterion as

where |AB| is the magnitude of vector AB as shown in Fig. 5.4. Then we move on to the next pixel C and do the similar calculation as described in Eqs. (5.24) and (5.25); we obtain s 2 = s(A,C), continuing this calculation until all eight neighbors’ curvatures s 1, s 2, …, s 8 have been calculated. Then we use the following rule to decide the best neighbor (BN) for the fiber tracking in 2D:

 and
and  using
using
Fig. 5.4
8 neighbor pixels for fiber tracking.  ,
,  ,
,  , and
, and  denote the direction map from eigenvalue of DTI
 ,
,  ,
,  , and
, and  denote the direction map from eigenvalue of DTI
![$$ \begin{array}{lllll}[b] {\alpha}_1&= \arccos \left(\frac{\overrightarrow{A}\cdot AB}{\left|\overrightarrow{A}\right|\cdot \left| AB\right|}\right),\\ {\alpha}_2 &= \arccos \left(\frac{\overrightarrow{B}\cdot AB}{\left|\overrightarrow{B}\right|\cdot \left| AB\right|}\right),\kern1em {\alpha}_3= \arccos \left(\frac{\overrightarrow{A}\cdot \overrightarrow{B}}{\left|\overrightarrow{A}\right|\cdot \left|\overrightarrow{B}\right|}\right) \end{array}$$](/wp-content/uploads/2016/04/A317179_1_En_5_Chapter_Equ24.gif)
(5.24)
 and AB,
  and AB, and
  , and
, and  , respectively. Then we define the curvature criterion as
(5.25)

(5.26)
For example, if s 3 is the smallest curvature in all eight neighbors, then the fiber will go to the next pixel C as shown in Fig. 5.4, and its relative coordinate to the current pixel is [0 1]. Then we move on to the next central voxel C and repeat the processing until the fiber direction map becomes zero. We can set direction map to be 0 if FA value is smaller than 0.2, or we can segment white matter from the structural image and use it as a mask to stop fiber growing in the tracking processing.
It should be mentioned that we can threshold the direction map using an additional condition, i.e., the angle between AB, AC,…,AI, and current voxel direction map is smaller than a given angle (typically we set it to 45°). The best neighbor tracking method can be easily extended to the 3D DTI data. In 3D, a voxel has 26 neighbors, and the same method as 2D can be applied. However, this linear line propagation approach is easy to be disturbed by noise. The error is likely to be more significant for smaller tracts close to the gray matter in which white matter tracts tend to be more dispersed and narrow, with smaller FA values and concomitant smaller anisotropies. Due to this problem, tracking results may deviate from the real tract trajectories [16


Stay updated, free articles. Join our Telegram channel

Full access? Get Clinical Tree


