The Importance of Postprocessing and Data Analysis for Breast Diffusion Weighted Imaging
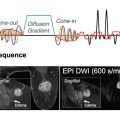
The role of magnetic resonance imaging (MRI) in breast cancer diagnosis and management is evolving as a supplemental screening tool for high-risk populations. Nowadays, a myriad of magnetic resonance (MR) sequences is applicable to breast imaging, with common protocol consisting in T1-weighted contrast-enhanced and T2-weighted imaging. Dynamic contrast-enhanced (DCE) MRI is highly sensitive, improving detection compared with mammography alone and approaching, with automation techniques, a sensitivity of 89% for all breast cancers. However, specificity remains an issue. Though not yet generalized in the clinical practice, diffusion-weighted imaging (DWI) could improve the diagnostic specificity of DCE (i.e., decrease the false positive rate and consequently reduce the number of unnecessary biopsies). If different MRI sequences offer specific information on lesion morphology and physiology, they could, when combined, guide the operator toward improved lesion identification and characterization. However, the widespread use of breast DWI is limited by its high sensitivity factors that diminish image quality (e.g., residual eddy-currents- and susceptibility-induced distortions). Newer DWI sequences are emerging in complement of standard spin-echo echo-planar DWI, such as readout segmented (RS), multishot, simultaneous multislice (SMS), and zoomed two-dimensional spatially selective radiofrequency (2D RF) excitation pulses, to reduce those effects. Yet, there is very little agreement on the optimal protocol to acquire data and even less on the analysis method to characterize the malignant nature of a breast lesion, tumor aggressiveness, or grade.
This lack of consensus in the clinical community leaves the vendor uncertain as to what characteristics in their software product would be the most applicable for the market. In an effort to address these discrepancies that affect clinicians and vendors alike, the European Society of Breast Imaging (EUSOBI) recently published the first guidelines regarding DWI breast parameters from the consensus of an international group of experts. They include specifications for data acquisition: axial acquisition with at least two b values of 0 and 800 s/mm 2 , fat saturation, and a minimal spatial resolution of 2 × 2 mm. Guidelines also recommend to compute standard apparent diffusion coefficient (ADC) maps from these raw diffusion images. Yet there is little information on data analysis besides region-of-interest (ROI) positioning. The determination of the possible malignant nature of a specific lesion based on DWI relies on a combination of observations and metrics based on b -800, ADC maps, and a range of ADC values of the ROI.
Diffusion imaging covers a broad spectrum of techniques, from the mapping of apparent diffusion coefficient (ADC) values using the mono-exponential model to advanced diffusion models such as Intravoxel incoherent motion (IVIM) and Diffusion Kurtosis imaging (DKI) (see Chapters 1 and 8 ) or diffusion tensor imaging (DTI) (see Chapter 9 )
In this chapter, we describe the technical options currently available in the Olea Medical portfolio for the advanced postprocessing of diffusion imaging, compatible with clinical practice expectations in terms of time-effectiveness and clinical impact, in breast lesion assessment.
Breast Diffusion Image Pre- and Postprocessing in Olea Sphere
Preprocessing
Background Extraction
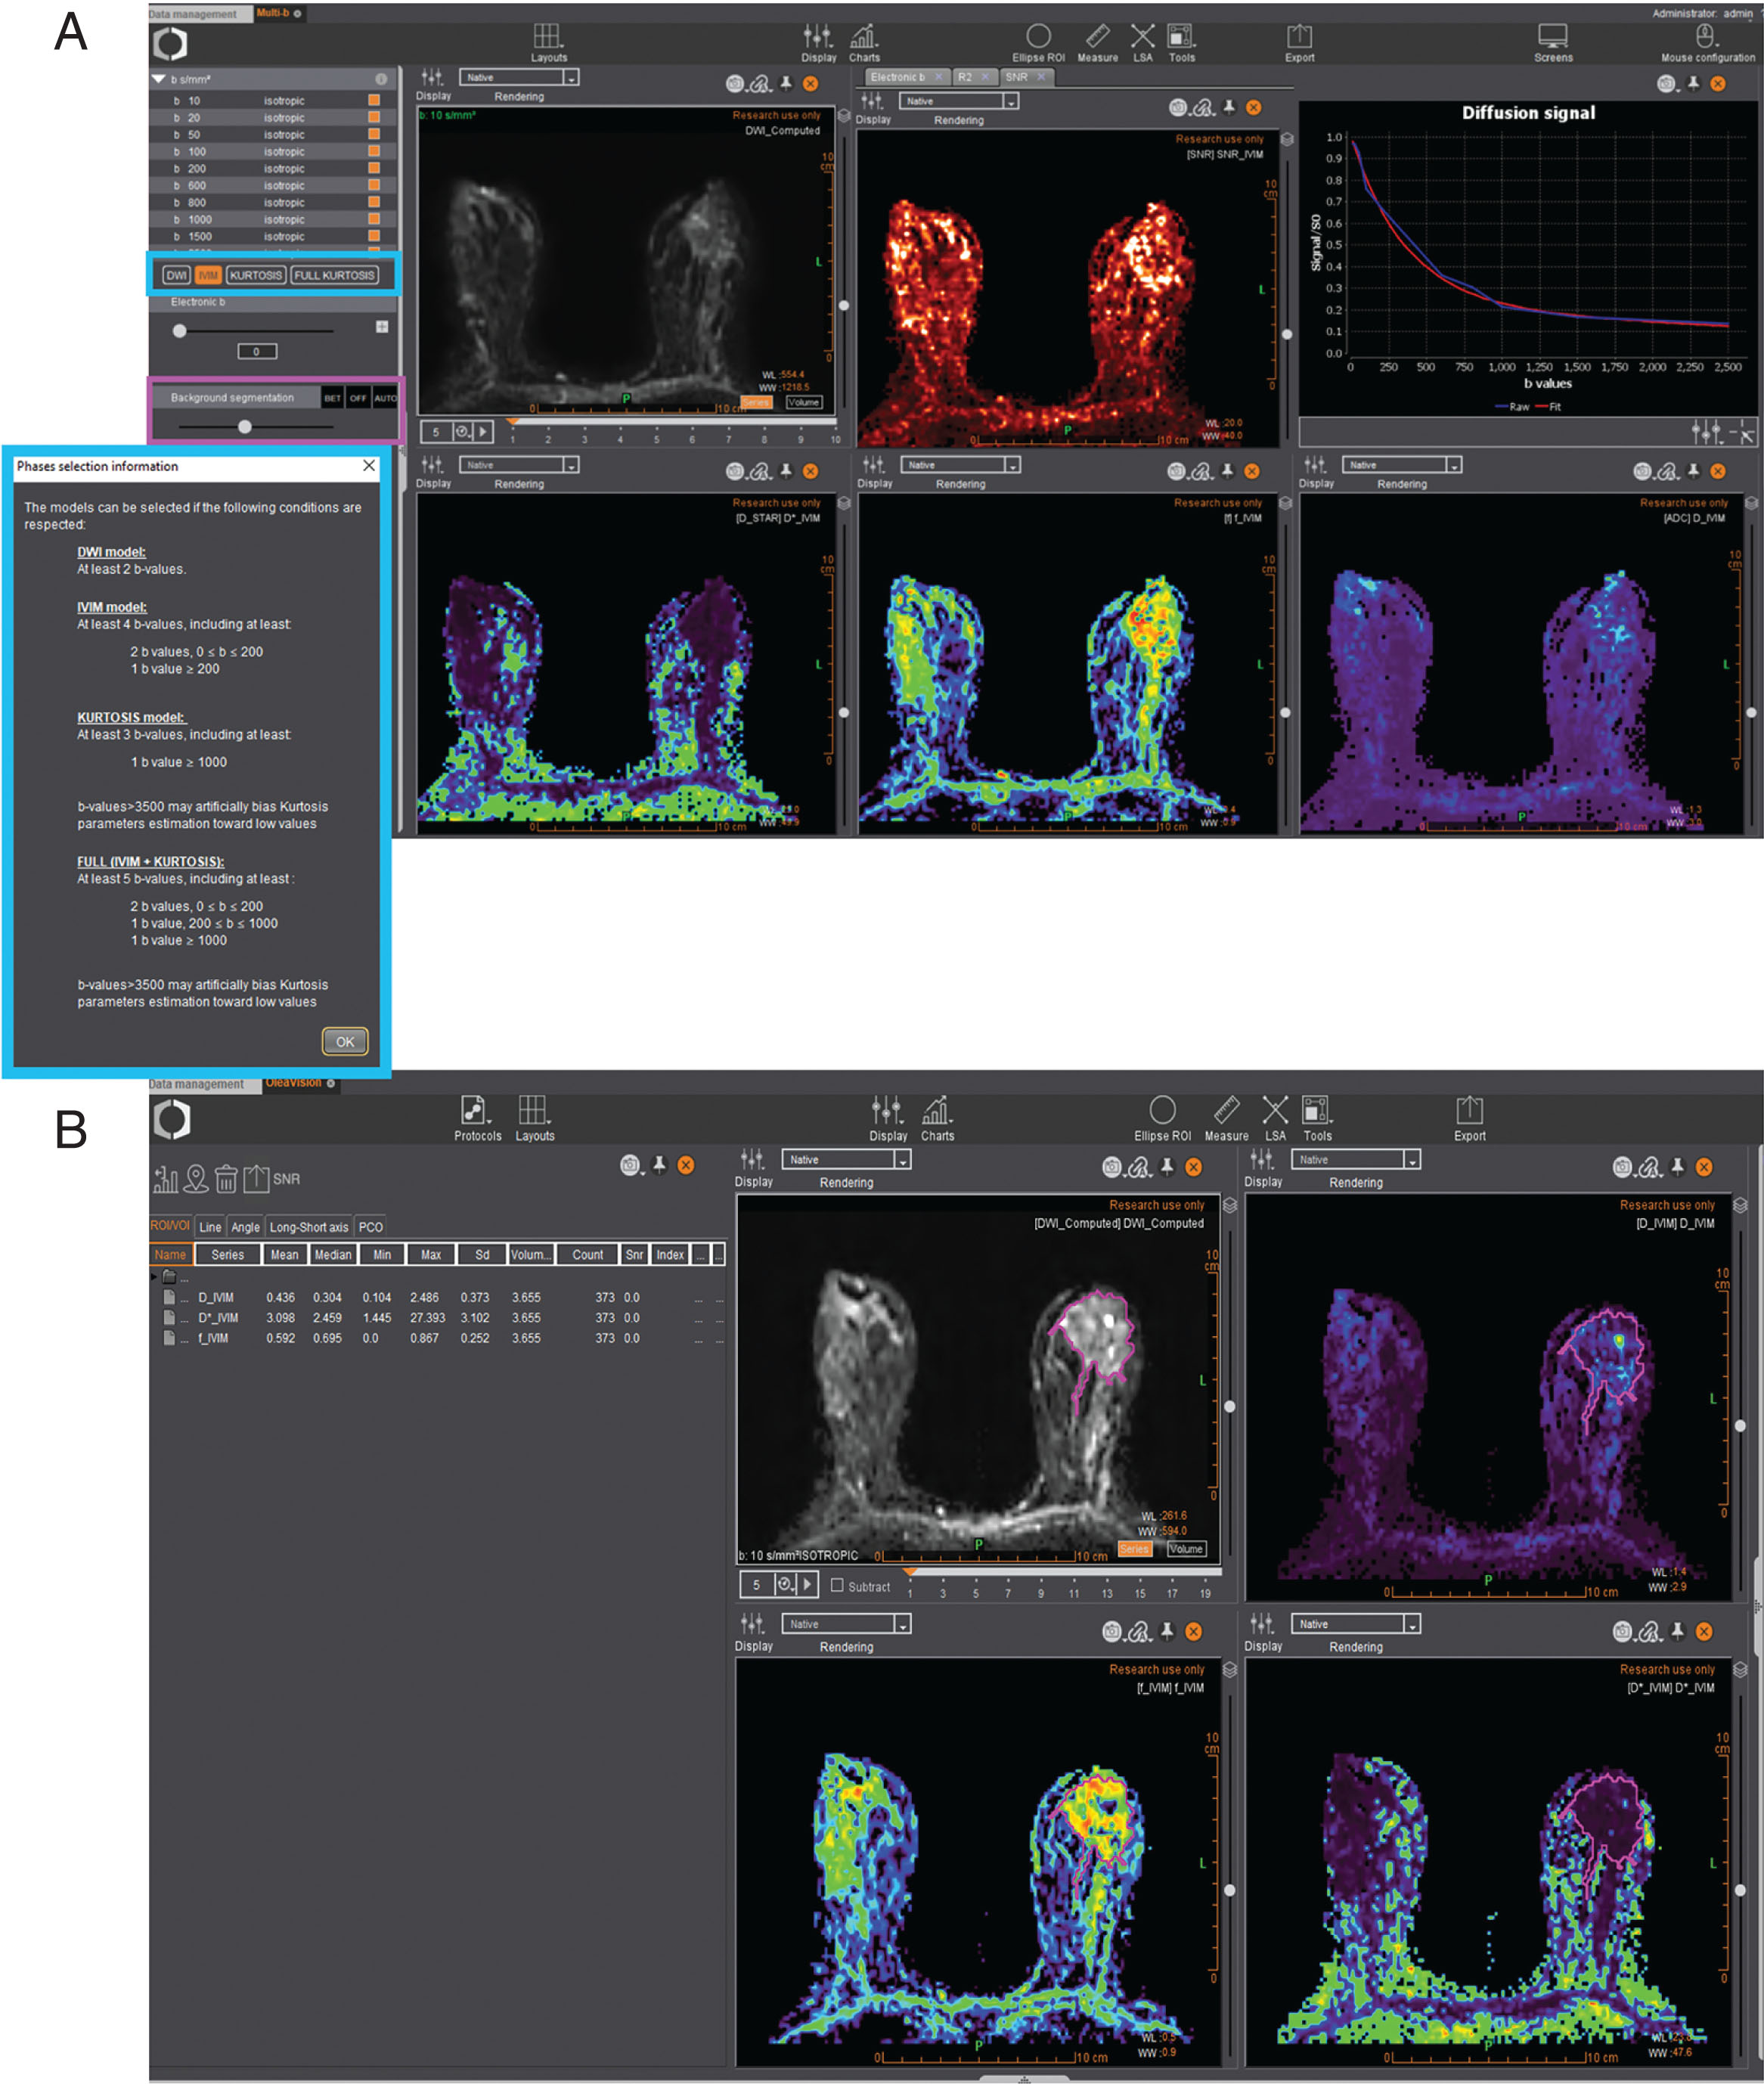
In an effort to optimize calculation time and reduce background noise, Olea Sphere automatically applies a background segmentation based on a histogram analysis of the raw diffusion images. The user can manually adjust the thresholds and visualize the filtering process on the displayed series.
Noise Reduction
If several acquisitions of the same b value are made in several orientations, Olea Sphere averages the data using the geometrical mean. This operation improves the signal-to-noise ratio (SNR) for isotropic acquisitions.
Motion Correction
To cancel moderate patient motion during image acquisition, Olea Sphere includes a 2D motion correction algorithm that achieves in-plane rigid coregistration of all raw images ( b values) of a given slice to the first acquired image, usually the b0 acquisition. The coregistration minimizes the sum of squares differences between the reference and the target images.
Geometrical Distortion Correction on DTI Series
Due to the high gradient amplitudes and short echo time (TE) used during acquisition, DTI imaging is particularly prone to eddy-currents distortions. Motion artifacts due to the patient’s movement during the examination can also affect estimation of diffusion parameters. Although most of these artifacts have been reduced by manufacturers with active shielding of the gradient coils and adjustments on the acquisition protocols, diffusion postprocessing software must reduce the remnant artifacts. In Olea Sphere, all diffusion volumes are aligned to the b0 volume using a 12-degrees-of-freedom affine transformation. The algorithm takes into account translation, rotation, and scaling due to movements as well as shearing due to eddy currents.
Model Parameter Estimates
Spectrum of Techniques
Diffusion imaging covers a broad spectrum of techniques implemented within Olea Sphere ( Fig. 18.1 ), from the mapping of ADC values using the monoexponential model (see Chapter 1 ) to advanced diffusion models such as IVIM, DKI (see Chapter 8 ), and DTI (see Chapter 9 ), along with the capability of generating computed b values if needed.
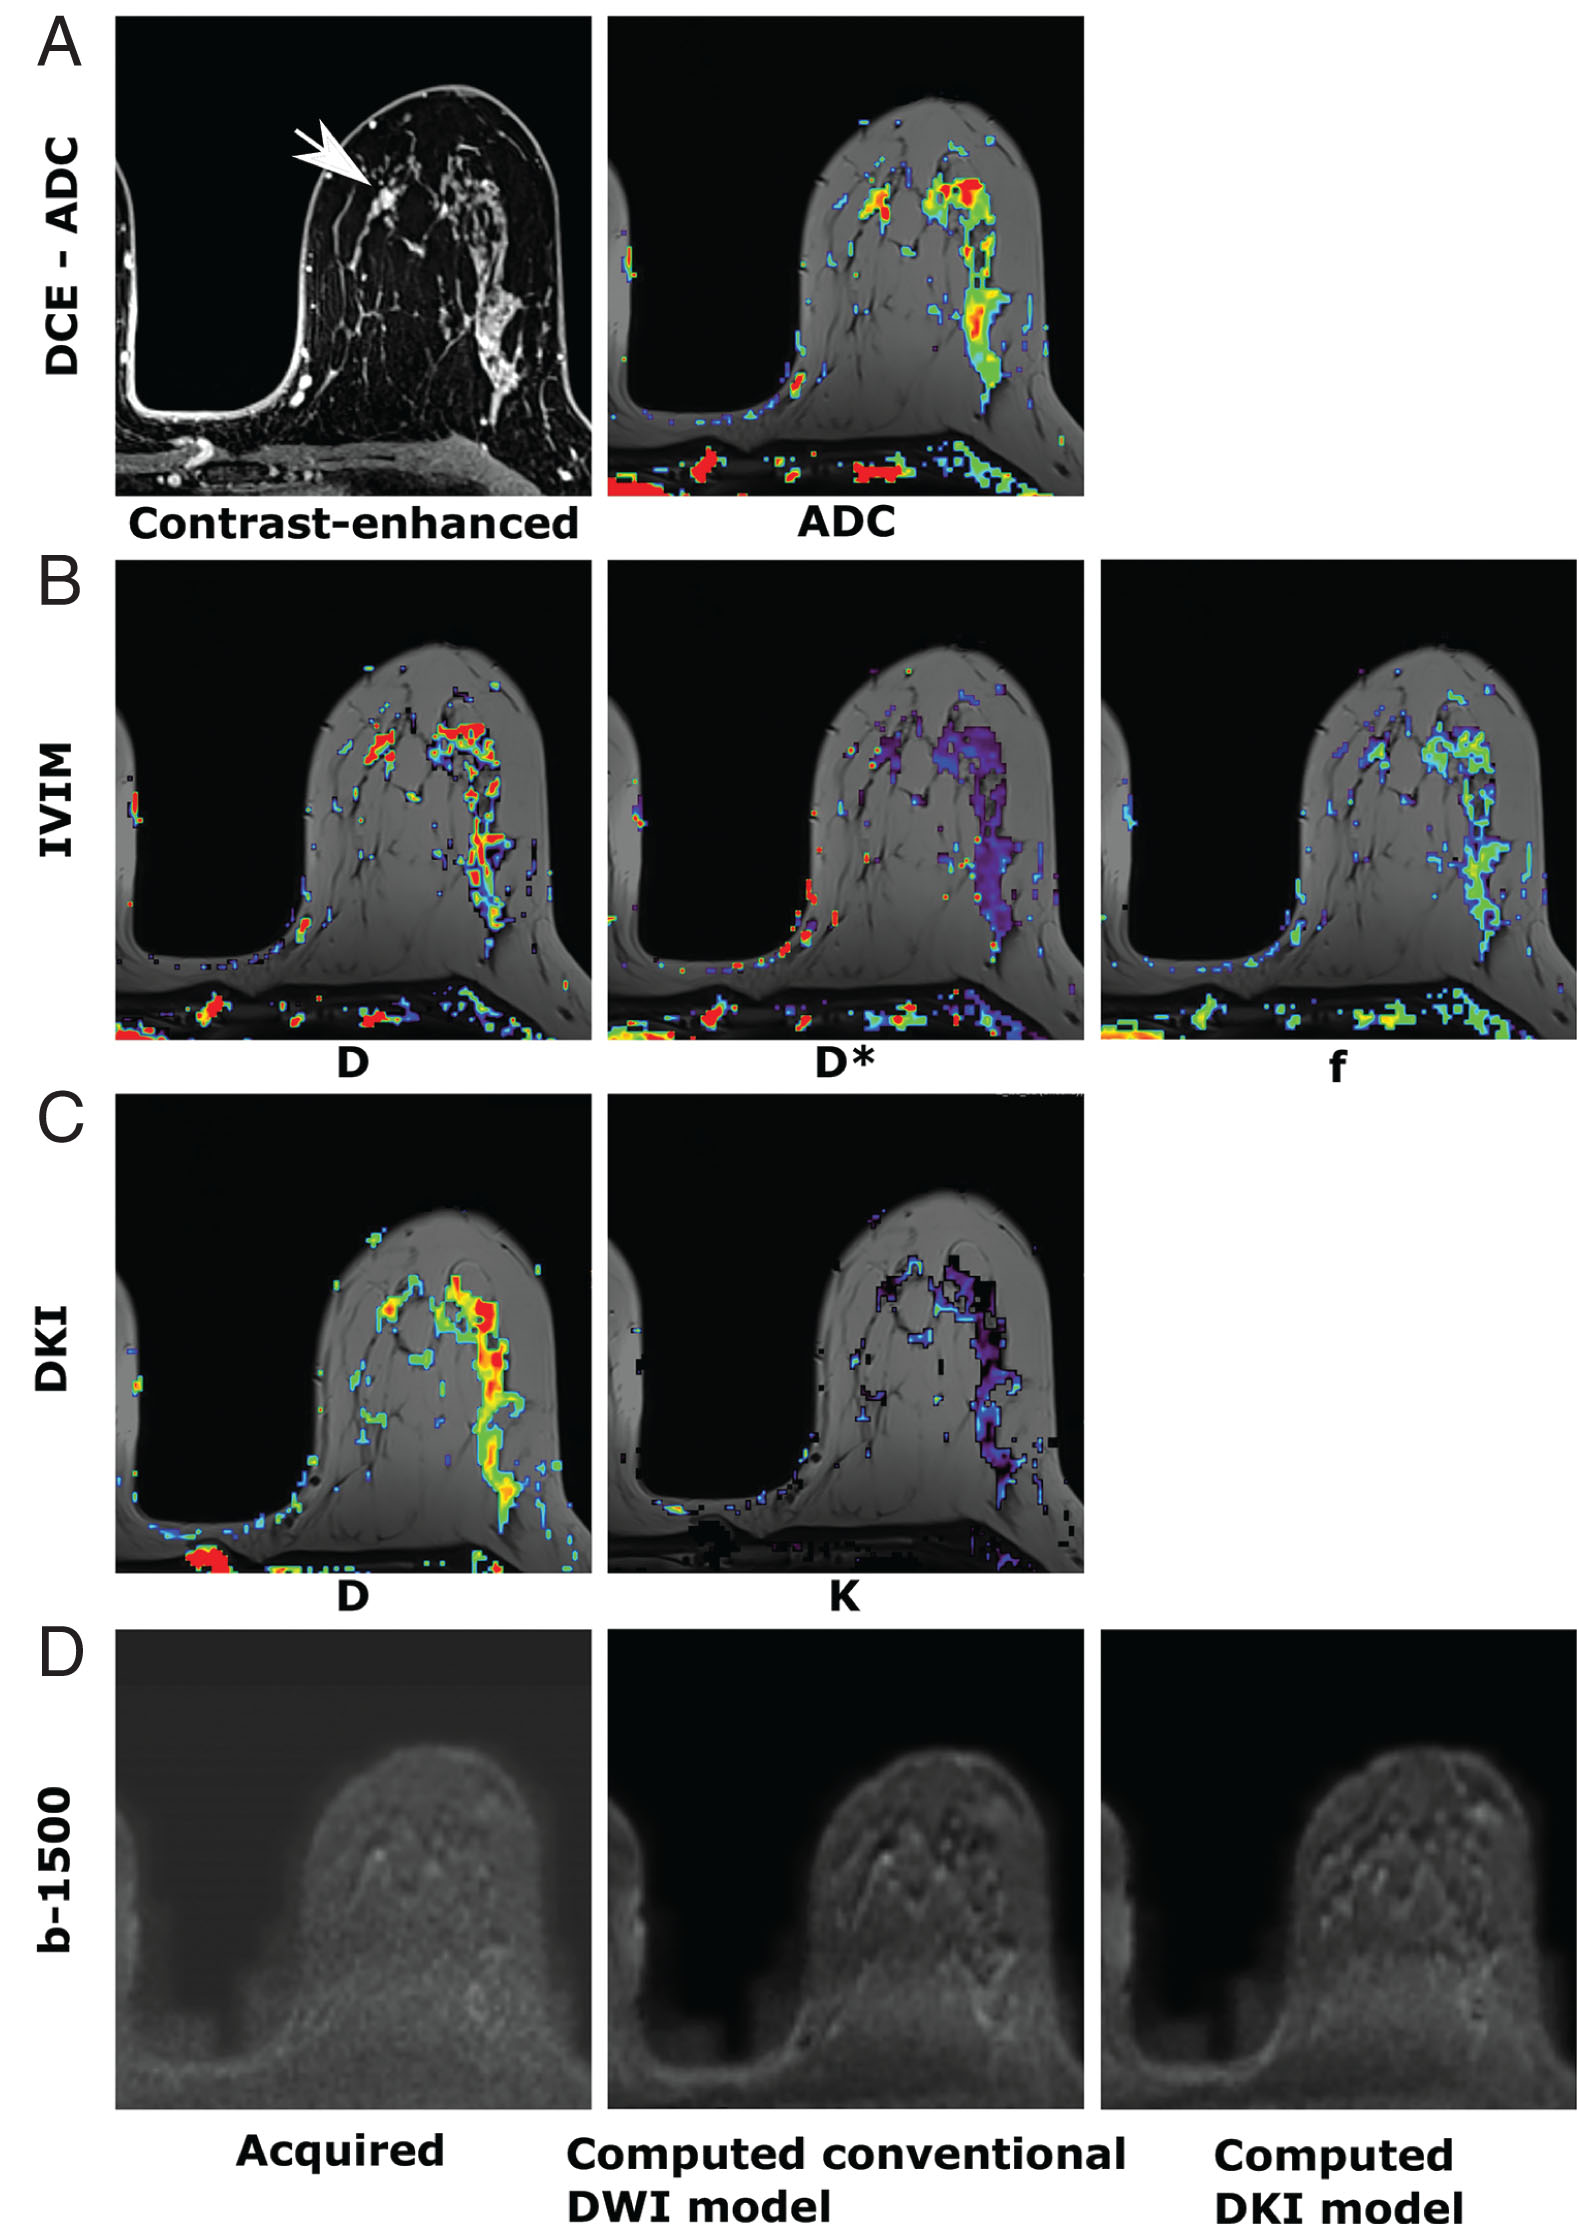
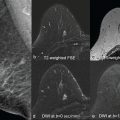
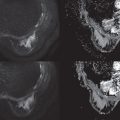
DWI is quantified by computing the ADC ( Fig. 18.2A ). Previous studies have shown that ADC values vary between malignant and benign breast lesions. However, an overlap may occur, as benign breast changes can occasionally mimic malignancy. Suspicious lesions are typically hyperintense on DWI images with corresponding low ADC values, indicating restricted diffusion and hypercellularity ( Fig. 18.3 ).
Related posts:
 DWI and Breast Physiology Status
 Disease and Treatment Monitoring
 Diffusion MRI as a Stand-Alone Unenhanced Approach for Breast Imaging and Screening
 High-Resolution Diffusion-Weighted Breast MRI Acquisition
 Diffusion-Weighted Whole Body Imaging With Background Body Signal Suppression (DWIBS)
 Breast Diffusion MRI Acquisition and Processing Techniques: The GE Healthcare Perspective
Stay updated, free articles. Join our Telegram channel

Full access? Get Clinical Tree


