Diffusion-weighted (DW) imaging is playing an increasingly important role in disease detection, prognostication, and monitoring of treatment response. Particularly in the realm of oncology, the potential applications for DW imaging continue to expand. In this article, the authors detail the role of DW imaging for pathologic processes involving the male pelvis. The authors describe the current data, new insights, and ongoing controversies regarding DW imaging of the male pelvis with a particular emphasis on oncologic applications. The authors also discuss imaging techniques and common pitfalls for DW imaging in this anatomic region.
Key points
- •
Diffusion-weighted (DW) imaging is playing an increasingly important role in disease detection, prognostication, and monitoring of treatment response. Particularly in the realm of oncology, the potential applications for DW imaging continue to expand.
- •
As magnetic resonance (MR) imaging plays a role in the diagnosis, characterization, and staging of most of these diseases, and DW imaging is a noninvasive, robust tool, its added value is only beginning to be realized.
- •
DW imaging holds promise for providing earlier cancer detection and evaluation of the treatment response. DW imaging enjoys several advantages over other advanced MR imaging tools, including the lack of reliance on intravenous contrast and relative rapidity of image acquisition.
Introduction
Diffusion-weighted (DW) imaging is playing an increasingly important role in disease detection, prognostication, and monitoring of treatment response. Particularly in the realm of oncology, the potential applications for DW imaging continue to expand. This technique has been applied toward the detection and characterization of a wide range of primary malignancies. It has also shown particular utility in the noninvasive staging of cancers. In addition, DW imaging holds promise for providing earlier cancer detection and evaluation of treatment response. DW imaging enjoys several advantages over other advanced magnetic resonance (MR) imaging tools, including lack of reliance on intravenous contrast and relative rapidity of image acquisition. As a quantitative imaging tool, DW imaging may also provide important information regarding tumor aggressiveness and histologic grading in a noninvasive manner.
In this article, the authors detail the role of DW imaging for pathologic processes involving the male pelvis. The authors describe the current data, new insights, and ongoing controversies regarding DW imaging of the male pelvis with a particular emphasis on oncologic applications. The authors also discuss imaging techniques and common pitfalls for DW imaging in this anatomic region.
Technique
Principles of DW Imaging
Signal intensity in DW imaging is predicated on the relative freedom by which water molecules are able to move within tissue. In an unrestricted system, water molecules move randomly, a property initially observed in the 1800s and later mathematically characterized by Albert Einstein in 1905. Water within tissue, on the other hand, cannot move in an entirely random manner. Intracellular water is obstructed by organelles within the cell and the plasma membrane constraining the cellular contents; likewise, the motion of extracellular water is limited by extracellular matrix and cell membranes. Tissues with high cellularity, therefore, restrict the motion of water to a greater degree than tissues with low cellularity or tissues consisting of cells with defective plasma membranes.
DW imaging as an MR imaging technique has its roots in 1965, when it was conceived as a variation of a T2-weighted pulse sequence. The value of this imaging technique to identify areas of acute infarction in the brain led to its widespread use in neuroimaging. However, more recently, its relevance toward pelvic imaging has begun to be appreciated. This new appreciation is possible in part because of technological advances in the 1990s, including the development of stronger diffusion gradients and faster imaging sequences.
Technical Aspects of DW Imaging
Imaging of the pelvis with MR imaging can be challenging because of the susceptibility artifact created at multiple air-tissue interfaces. Moreover, bowel motion can degrade image quality. Some institutions routinely administer spasmolytic drugs to inhibit peristalsis. Also, though not commonly performed, a homogenous material, such as ultrasound gel, can be used to fill the rectum to reduce the susceptibility signal caused by air in the rectum. DW imaging is typically performed in the axial plane, as the magnetic field homogeneity is best at the isocenter of the bore in addition to reducing eddy currents. However, for certain applications, such as rectal imaging, acquiring images in an oblique plane orthogonal to the long axis of the organ under investigation may facilitate evaluation of the extent of disease spread. Respiratory motion is not a common problem in pelvic imaging, though in some patients respiratory-triggered imaging may improve image resolution.
DW imaging can be performed at either 1.5T or 3.0T, with the higher magnetic field strength offering higher signal to noise, though at the expense of worse susceptibility artifacts. In DW imaging, 2 symmetric gradients are applied on either side temporally of the 180° refocusing radiofrequency pulse of a conventional spin-echo T2-weighted sequence. The effects of the first gradient, known as the dephasing gradient , are nullified by the second gradient, known as the rephasing gradient , in tissues with protons whose free movement is restricted. The net effect on the transverse magnetization is, therefore, minimal, and there is no signal loss. On the other hand, protons that are freely moving within the tissue will experience different strengths of the 2 gradients, and so the net effect will not be zero; these protons will not be fully rephased, resulting in signal loss. The 2 diffusion gradients are characterized by a constant b, which encapsulates the strength, duration, and time interval between the 2 gradients and is measured in units of seconds per square millimeter. At b = 0, a DW imaging pulse sequence is simply a T2-weighted imaging sequence. As the b value increases, the relative contribution of tissue diffusivity to signal intensity increases. Areas of restricted diffusion will appear bright on high b-value images, whereas areas of free-flowing fluid, such as within cysts or within the bladder, will appear dark.
Diffusivity of tissue can be quantified using DW imaging by calculating a value known as the apparent diffusion coefficient (ADC). The ADC is calculated as the slope of the line on a log linear plot connecting the signal intensity of a pixel measured at different b values; therefore, measurements of signal intensity from at least 2 b values are required, and the accuracy of the ADC value improves when more data points (ie, b values) are acquired. The choice of b value, however, to determine the ADC is a point of controversy, with low b values (10–150) being heavily weighted to perfusion effects (so-called intravoxel incoherent motion), and higher b values demonstrating improved diffusion weighting. As a result of the perfusion weighting, there is alteration of the expected mono-exponential behavior of signal loss with b-value increase, potentially altering calculated ADC values. There is growing consensus about avoiding low b values (<150) when using mono-exponential fitting as a result of this added perfusion weighting, in addition to clearly visible nonlinear behavior on log-linear plots. The low b-value imaging, however, has excellent value in lesion detection secondary to its high signal-to-noise ratio. Until these data are better understood, it is recommended to use at least 3 to 4 b values less than 1000 in order to calculate ADC. Regardless, the ADC value is independent of magnetic field strength.
Interpretation of DW Imaging
The diffusivity of water is inversely proportional to the organization and compactness of a tissue’s microenvironment. Three discrete tissue characterization patterns can be described in DW imaging. Malignant lesions, because of their dense cellularity and disordered interstitium, demonstrate restricted diffusion. Fluid or necrotic tissue in which the integrity of plasma membranes has been compromised, allow for the free diffusion of water and, therefore, have the opposite signal characteristics of tumors; that is, they are dark on high b-value images and bright on ADC maps. Finally, rapidly flowing water within blood vessels will appear dark even on low b-value images.
Malignant lesions, because of their hypercellularity, restrict the free diffusion of water. This restriction manifests on DW imaging as high signal within lesions on images acquired at high b values (>800 s/mm 2 ). Likewise, these lesions appear as low signal intensity on the ADC maps.
Consideration of the ADC value of a suspected malignant lesion is of paramount importance, as lesions with intrinsic T2 hyperintensity may still appear bright on high b-value imaging but should appear bright on the ADC map, indicating T2 “shine-through.” Moreover, the clinical context of the examination must be taken into account when interpreting lesions that demonstrate restricted diffusion, as tumors are not the only pathologic conditions that exhibit this tissue characteristic. For example, abscesses may appear bright at high b values as well as dark on ADC maps, and the patients’ presenting symptoms may be the only guide to differentiate between malignancy and infection. The distribution of restricted diffusion within the lesion can also guide differentiating between these two causes. That is, tumors tend to demonstrate peripheral restricted diffusion with central necrosis, akin to a chocolate donut on an ADC map with a dark outer component and a bright inner component; inversely, abscesses tend to demonstrate central restricted diffusion, resembling a vanilla donut on ADC maps.
Limitations of DW Imaging
Although DW imaging holds the promise of being a quantitative imaging tool, precision in the quantification of ADC maps remains a challenge in DW imaging. There remains wide variability in published ADC values for similar pathologic conditions. This variability is likely caused by a multitude of factors. First, there is no standardized protocol for performing DW imaging, and parameters such as b values can differ significantly across institutions, rendering comparison of ADC values from different published reports fraught with peril. When imaging at higher b values, signal to noise can decrease, which in turn can degrade the quality of the data used to calculate ADC values. Moreover, as DW imaging is a variation on T2-weighted imaging, the parameters that affect the T2 signal will affect the DW imaging signal intensity. For example, the lack of fat-suppression techniques, parallel imaging, matrix size, and echo train length may all affect the T2 signal intensity and, therefore, the ADC value.
The importance of quantitative analysis of ADC maps remains an area of controversy. In addition to the issues surrounding relatively low b values exhibiting added perfusion effects to diffusivity and thereby altering mono-exponential behavior and, therefore, the ADC value, an ADC value that can be used as a cutoff between malignancy and benignity is also a concept of wide variability and controversy, so much so that centralized efforts (eg, Quantitative Imaging Biomarkers Alliance, ) using internal standards (eg, muscle) to gauge restriction are necessary.
Not all malignancies demonstrate restricted diffusion. For example, mucinous adenocarcinomas of the colon may not be bright on high b-value imaging; likewise, calcified lesions will appear as signal voids. Additionally, not all lesions that demonstrate restricted diffusion are malignant. For example, abscesses and cytotoxic edema also classically demonstrate restricted diffusion. Finally, DW imaging is burdened by poor spatial resolution, which limits the detectability of tumors less than approximately 1 cm in size.
Prostate
Specific Technical Considerations
Endorectal coils provide higher-quality imaging of the prostate and are used whenever possible, primarily for improved T2-weighted imaging. Given the intrinsically high T2 signal of the peripheral zone of the prostate, described in further detail later, a multiple b-value approach is generally taken, whereby data are acquired at several b values, such as b = 0, 50, 400, and 800 s/mm 2 . Recent provocative results have identified possible utility in ultrahigh b-value imaging within the prostate gland, exploiting kurtosis as a means to better detect and characterize malignancy. These data are then used to calculate a mono-exponential ADC map.
Prostate Cancer Imaging
Background
Prostate cancer is the most common malignancy in men and second most common cause of cancer-related deaths in men. Clinical suspicion for prostate cancer is typically raised by palpation of a firm nodule on digital rectal examination or an elevated serum prostate-specific antigen (PSA) level; however, it is important to note that not all prostate cancers are associated with an elevation in PSA. A typical evaluation for prostate cancer includes a systematic 12 core prostate biopsy, commonly performed with transrectal ultrasound guidance. If the biopsy is positive for malignancy, the patients’ treatment plan is tailored to their symptoms and their life expectancy. For symptomatic patients with greater than 5 years of life expectancy, pelvic imaging with computed tomography (CT) or MR imaging is recommended if the patients’ biopsy revealed either T3/T4 disease or T1/T2 disease with a greater than 10% chance of lymph node metastasis. For these patients, imaging plays a key role in the identification of lymph node metastases.
For patients with very-low-risk disease and a life expectancy of greater than 20 years, or for those patients with low-risk disease and a life expectancy of less than 10 years, active surveillance is an increasingly used approach. These patients undergo routine PSA checks as well as other diagnostic tests to vigilantly monitor the disease and detect early signs of progression. If there is a clinical concern for disease progression, usually indicated by an elevated PSA, repeat prostate biopsy is performed. However, this procedure is an imperfect evaluation of the prostate, both because nontargeted cores are obtained and because the anterior prostate is inaccessible to transrectal sampling. Therefore, patients in this low-risk category undergo MR imaging, particularly to evaluate the anterior prostate. Indeed, MR imaging is more accurate than transrectal biopsy or digital rectal examination in identifying prostate cancer and possibly better correlated to the actual tumor aggressiveness parameters.
A third scenario in which MR imaging plays a role in the management of patients with prostate cancer is in the setting of biochemical recurrence following radical prostatectomy. That is, for patients with increasing PSA levels following radical prostatectomy, MR imaging may assist in identifying residual or recurrent foci of malignancy in the resection bed.
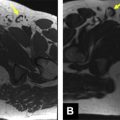
Prostate cancer typically develops in the peripheral zone of the prostate; on MR imaging, focal malignant lesions appear as low-signal-intensity areas on T2-weighted imaging, a feature that defines it against a background of typically high T2 signal in the peripheral gland tissue. However, not all areas of low T2 signal in the peripheral gland are malignant, as mimickers, including hemorrhage, prostatitis, and posttreatment change, may share a similar appearance. The challenge of arriving at a specific diagnosis for malignancy on conventional MR imaging is all the more difficult for the minority of tumors that arise in the central gland; this region of the prostate usually demonstrates a heterogeneous T2 appearance because of the benign prostatic hyperplasia, and so the identification of a focal lesion within the morass of T2 signal variability is not trivial ( Fig. 1 ).
DW imaging of prostate cancer
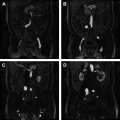
DW imaging has been evaluated extensively as a tissue characterization tool to assist in the identification of prostate malignancy. On DW imaging, prostate cancer classically appears bright at high b values and is dark on ADC maps; this latter finding may be of value when attempting to identify a discrete lesion within areas of heterogeneous T2 signal. Evaluation for prostate cancer that includes both T2-weighted imaging and DW imaging is superior to evaluations that rely on T2-weighted imaging alone ( Fig. 2 ).
Multiple published series have highlighted the ability of DW imaging to define focal malignant lesions within the peripheral zone. Reported sensitivities and specificities vary broadly across studies, ranging from 40% to 95% for either. DW imaging, when used in conjunction with T2-weighted imaging, both significantly improves the sensitivity and specificity for identifying prostate cancer in the peripheral zone and reduces interobserver variability. A recent study by Mazaheri and colleagues found a sensitivity of 82% and specificity of 95% using an ADC cutoff value of 1.6 × 10 −3 mm 2 /s. However, because of the lack of standardization of imaging parameters, comparison of such absolute ADC cutoff values between studies is limited.
DW imaging of the central gland is less specific for malignancy owing to the overlap in imaging appearances of cancer and benign prostatic hyperplasia. In a study by Oto and colleagues, 38 tumors were compared with 38 foci of stromal hyperplasia and 38 areas of glandular hyperplasia in the central gland; although the mean ADC values of these 3 groups were statistically significantly different, there was a high degree of overlap between the individual values. More recently, Hoeks and colleagues retrospectively reviewed 3T MR imaging examinations performed with endorectal coils on patients who subsequently underwent prostatectomy. They found that dynamic contrast imaging and DW imaging did not improve on detection accuracy over T2-weighted imaging for transition zone tumors.
Patients enrolled in an active surveillance protocol with an increasing PSA level but negative transrectal prostate biopsy may significantly benefit from DW imaging. Park and colleagues reported on 43 patients with negative prostate biopsies and persistently elevated PSA levels who underwent DW imaging before rebiopsy. DW imaging was used to localize the most suspicious area to be targeted by the subsequent biopsy; this location was defined as the area with the lowest ADC value. The researchers found that a significant portion of the cancers in their study group were in the transitional zone (76%), an area not routinely sampled in random prostate biopsies. Of the 17 cancers identified on DW imaging, only 6 were detectable on T2-weighted imaging alone. DW imaging, therefore, may be a powerful tool for biopsy guidance in patients with suspicion for malignancy but an initial negative biopsy.
DW imaging may play an increasingly important role in predicting prostate cancer aggressiveness. Although the histology-based Gleason grading system is a critical component in prognosticating disease-free survival, this method is inherently limited because it is based on a random sampling of prostate tissue. The biopsy-based Gleason score may significantly underestimate the final postprostatectomy score. DW imaging could potentially fulfill the current unmet clinical need for accurate prediction of prostate cancer aggressiveness. Indeed, multiple studies have identified an inverse proportionality between ADC value and Gleason score, based on transrectal ultrasound-guided prostate biopsies, MR-guided prostate biopsies, or prostatectomy specimens. However, there is a significant overlap of ADC values for different Gleason scores; so at present, an ADC value cannot be used to accurately estimate a Gleason score.
DW imaging has also been used to augment noninvasive prostate cancer staging, specifically with regard to involvement of the seminal vesicles. Invasion of the seminal vesicles by prostate cancer is an important negative prognostic indicator. Two reports describe the ability of DW imaging to predict seminal vesicle involvement. When combined with T2-weighted imaging, DW imaging improved accuracy and specificity to approximately 97% and 96%, respectively, compared with T2-weighted imaging alone.
DW imaging has also been applied to the evaluation of treatment response in prostate cancer. For postradiation and post–high-intensity focused ultrasound therapy for prostate cancer, DW imaging improves on the detection of residual tumor compared with T2-weighted imaging alone ( Fig. 3 ). However, at present, there is insufficient evidence to rely on DW imaging alone for these patients; dynamic contrast-enhanced (DCE) MR imaging remains the imaging tool of choice in this setting.
DW imaging has also shown utility in predicting patients who will exhibit biochemical recurrence following radical prostatectomy. In a retrospective study of 30 patients after surgical resection with elevated PSA, the presurgical ADC value of the tumor was the only independent predictive factor for biochemical recurrence. Identifying the site of local recurrence can be challenging, but DW imaging also shows promise in this regard. Giannarini and colleagues reported on a small case series of 5 patients for whom DW imaging was the only imaging modality able to identify the site of recurrence, all of which were confirmed histologically.
Bladder
Specific Technical Considerations
Bladder distention is a prerequisite for MR imaging of the bladder. For patients with indwelling catheters, 250 to 400 mL of saline can be infused into the bladder. Otherwise, patients should be instructed to drink plenty of fluids before the examination. Care should be taken, however, to prevent overdistention of the bladder, as this can contribute to overstaging of bladder malignancy by MR imaging. As bladder filling is a dynamic process that can alter the morphology of the bladder during the MR imaging examination, it is important to be aware that lesions may seem to change location or shape during the course of the imaging study.
Bladder Cancer Imaging
Background
Bladder cancer is the fourth most common cancer in the United States and is 3 times more common in men than in women. Accurately characterizing tumors as muscle invasive versus superficial is of paramount clinical significance in bladder cancer. Tumors that only involve the subepithelial connective tissue are considered T1 lesions and are treated with transurethral resection of bladder tumor with or without adjuvant chemotherapy, followed by surveillance. On the other hand, T2 lesions that invade the muscularis propria are usually managed with a radical cystectomy. Accurate characterization of tumor invasiveness can have a profound impact on a patient’s management.
MR imaging is commonly used for bladder cancer staging. However, this approach is not without its drawbacks. Specifically, MR imaging may overstage bladder cancer. Moreover, contrast-enhanced imaging is an important component of the conventional MR evaluation of bladder cancer invasiveness; patients with impaired renal function may not be able to receive gadolinium-based contrast agents. DW imaging has, therefore, emerged as a potential alternative approach to contrast-enhanced MR imaging for bladder cancer detection, staging, and treatment monitoring. Because the median age at diagnosis of bladder cancer is 65 years, it is not uncommon for patients with this disease to have multiple medical comorbidities, including renal dysfunction that may preclude the use of gadolinium-based contrast agents.
DW imaging of bladder cancer
On high b-value imaging, bladder malignancies appear as bright lesions, well delineated along their luminal margin by the dark urine within the bladder. The bladder wall has intrinsically intermediate signal intensity on high b-value images. On ADC maps, the tumors are dark, whereas normal bladder wall maintains an intermediate signal intensity ( Fig. 4 ). Takeuchi and colleagues studied the potential benefits of adding DW imaging to conventional T2-weighted imaging on accurately assessing bladder cancer staging. A total of 40 patients with 52 bladder malignancies underwent pelvic MR imaging before cystoscopy and tumor resection/sampling. The researchers compared the accuracy of tumor staging based on T2-weighted imaging alone, T2-weighted imaging with DW imaging, T2-weighted imaging with post–contrast-enhanced imaging, and all 3 combined; they found the respective accuracies to be 67%, 88%, 79%, and 92%. The tissue characterization of DW imaging augmented the accuracy of the T2-weighted imaging interpretation to a greater degree than postcontrast imaging. There was a statistically significant improvement in specificity and area under the receiver operating characteristic (ROC) curve by adding DW imaging to T2-weighted imaging. The researchers also conceived a useful system of morphologic descriptors for bladder cancer that predicts tumor staging. Tumors that are T1 may be flat or demonstrate an inchworm appearance, with a C-shaped tumor enveloping a submucosal stalk. Tumors that extend into the submucosa but with smooth margins are likely to be T2, whereas tumors with irregular spiculations extending into the bladder wall are likely T3 or greater.