, Foster D. Lasley2, Indra J. Das2, Marc S. Mendonca2 and Joseph R. Dynlacht2
(1)
Department of Radiation Oncology, CHRISTUS St. Patrick Regional Cancer Center, Lake Charles, LA, USA
(2)
Department of Radiation Oncology, Indiana University School of Medicine, Indianapolis, IN, USA
Dose Calculation: Water Versus Patient
Please refer to Chapt. 8 (Photon Dosimetry in Water) for the basic dose calculation equations.
This chapter assumes you already know how to calculate dose to water.
Dose to patient is different from dose to water because:
Patient surface is not perfectly flat.
Patient tissue is not perfectly water-equivalent: it contains air, bone, metal etc.
Clinical treatments often contain more than one radiation field. When matching fields, beam geometry must be matched to minimize hot and cold spots.
Corrections For Patient Contour
Unlike a water phantom, patients have a non-flat surface. Therefore, corrections must be made for their contour.
The difference between a flat surface and the patient surface is known as “tissue deficit” or “tissue excess”.
x = tissue excess (negative number for tissue deficit)
d = depth in tissue
r = field size (Fig. 9.1)
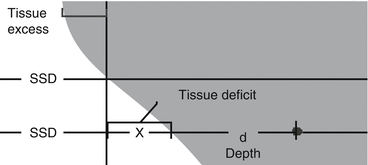
Fig. 9.1
Tissue excess and deficit. These values are measured as centimeters of deviation from a perfectly flat surface.
Several different methods exist to calculate the dose with an irregular surface.
Inhomogeneity Corrections
High-density tissue (bone) increases attenuation, while low-density tissue (lung) decreases attenuation.
Therefore the dose distal to an inhomogeneity will be different than the dose in a homogeneous phantom (Fig. 9.2).
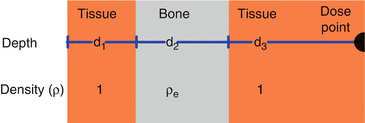
Fig. 9.2
Inhomogeneity correction. An inhomogeneity can be characterized by its location (depth), density and thickness as depicted above.
Classical Methods
Uses beam data measured in water, and applies simple correction factors for irregularities in surface contour and inhomogeneities in tissue.
These methods are rarely used in modern era radiotherapy.
Irregular Contour Corrections:
Effective SSD Method: Uses a SSD/PDD calculation and corrects for depth in tissue.
TAR Ratio Method: Uses a TAR correction factor based on the thickness of tissue excess or tissue deficit.
Isodose Shift Method: Uses a “shift factor” to move the isodose lines based on tissue excess or deficit.
Inhomogeneity Corrections:
TAR ratio method: Uses the “radiographic depth” to calculate a new TAR.
Batho power law method: Calculates TAR based on an exponential function of depth.
Isodose Shift Method: Uses a “shift factor” based on the thickness and nature of the inhomogeneity.
Model Based Calculations
Modern treatment planning systems use computer models to calculate dose.
These are all based on Monte Carlo (MC) simulated pencil beam kernels.
In order from least sophisticated to most sophisticated, the common computer models are:
Pencil beam (PB) kernel: Only accounts for central axis of the beam.
Superposition/Convolution method: Also accounts for lateral inhomogeneities.
Collapsed Cone method: Also accounts for lateral inhomogeneities.
Analytical anisotropic algorithm (AAA)
Accuros
Monte Carlo: The most accurate and computationally intensive algorithm.
The details of computer based models are beyond the scope of this review book.
Inhomogeneity Perturbations
At an interface between “less dense” and “more dense”, there is a loss of electronic equilibrium needed to calculate dose in medium.
High density tissue generates more secondary electrons and low density tissue generates less secondary electrons (Fig. 9.3).
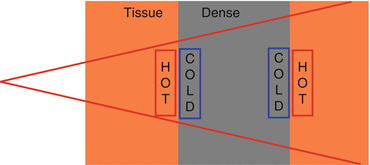
Fig. 9.3
Interface effects. When a photon beam encounters an inhomogeneity, hot and cold spots occur due to differences in secondary electron production.
The high-density side is relatively underdosed because there are not enough electrons coming from the low-density side.
Tissue next to lung/air may be underdosed.
The low-density side is relatively overdosed because there are too many electrons coming from the high-density side.
Tissue next to bone/metal may be overdosed.
Photon scatter may also contribute to this hot spot, especially with a metal/tissue interface.
Doses at an inhomogeneity interface are difficult to calculate or measure accurately, but several of the algorithms described above can handle inhomogeneities.
Parallel Opposed Fields
Evenly weighted parallel opposed fields are the simplest method to create a “uniform” dose.
Tissue Lateral Effect (aka hourglass effect): Dose is always higher superficially than at depth.
Larger separation increases the max dose, as D max increases faster than D exit decreases.
Depth = Separation/2
This is a common test-taking mistake.
Always know whether you are using depth or separation, or you will be off by a factor of 2 (Fig. 9.4)
.
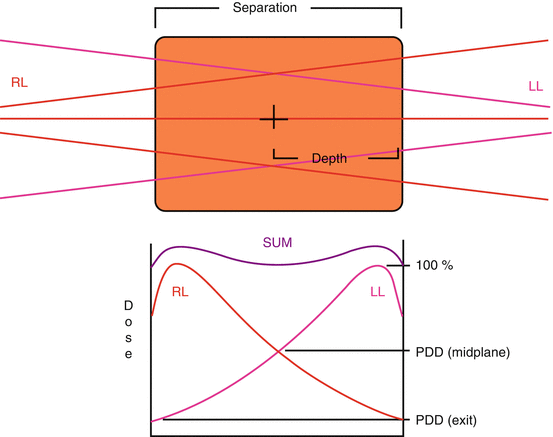
Fig. 9.4
Tissue lateral effect. In a radiation treatment with parallel opposed beams, the peripheral dose is always higher than the central dose. This effect increases with separation and decreases with beam energy.
How to calculate the lateral dose?

(9.1)
How to keep D max low: (and what are the tradeoffs?)
Increased beam energy:
You lose superficial dose.
Extend SSD:
Mayneord F-factor works in your favor.
More time consuming setup.
Add more fields:
A 3- or 4-field combination will reduce the superficial dose compared to AP/PA, at the cost of increasing complexity of treatment.
Wedges
A wedge produces a sloped isodose distribution with less dose on one side (the heel) and more dose on the other (the toe).
A physical wedge is a wedge-shaped piece of metal.
A non–physical wedge or soft–wedge is a software program that moves the collimator jaw in a calibrated fashion to produce a wedge-shaped dose distribution.
Each linac manufacturer has a unique soft wedge with a different proprietary name.
Physical wedges generate scatter. Non–physical wedges do not.
Scatter increases dose outside the field, so any organs sensitive to very low dose are at increased risk. (such as the contralateral breast during whole breast RT).
This may also slightly increase surface dose.
Physical wedges also cause beam hardening, so the angle of the isodose lines decreases at very deep depths (Fig. 9.5).
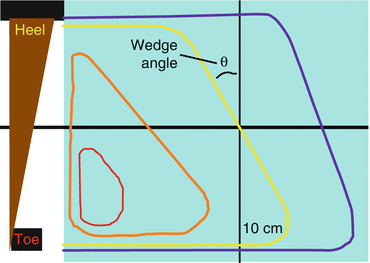
Fig. 9.5
Wedge angle. Wedge angle is defined by the angle between the wedged isodose line and a straight line at 10 cm depth. This figure is repeated from Chapt. 7.
Wedge Angle is defined as depicted above.
Stay updated, free articles. Join our Telegram channel

Full access? Get Clinical Tree


