Fig. 9.1
Multimodality data from a stroke patient, 7 h since last seen normal (LSN). Note the difference in contrast between different modalities. In this case, the DWI and ADC maps provide excellent contrast for ROI definition of the stroke area: hyperintense on DWI, hypointense on ADC. DWI diffusion-weighted image, ADC apparent diffusion coefficient, T2WI T2-weighted image, CBF cerebral blood flow, CBV cerebral blood volume, MTT mean transit time, Tmax time to max in perfusion [adapted from Wu et al. [7]. With permission from Wolters Kluwer Health]
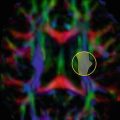
When the researcher is interested in a sub-part of a certain structure and wants to have control over the size of the ROI, a geometrical ROI (circle/sphere, square/cube, etc.) could be used. The ROI is then placed in the center of the structure and has the same size in each subject, in contrast to manual ROI delineation where ROI size is different for each subject.
The sites of activation of a BOLD fMRI study can also serve as a ROI, for example to start tractography, and it may lead to a very-well-localized ROI in each subject. Because the main signal is in the gray matter, it may be necessary to dilate the ROI into the white matter [8–10].
Atlas-Based ROIs
There are multiple predefined atlases of white matter available, and these may serve as good starting points for ROI analysis. Well-known atlases are the JHU atlas [11] and the probabilistic Juelich atlas [12]. Data from multiple subjects is used to create a 3-D overview of well-defined brain regions. A key advantage of using an atlas is that it is created in a standard space (i.e., MNI, Talaraich), which makes it easy to compare between subjects or studies. A common approach is therefore to register the subject’s data to the atlas data, or vice versa. When using atlases, care must be taken to check overlap of the regions with the data under study, as misalignment may obscure region location. Once the data is correctly aligned, diffusion measures such as FA or ADC can be easily extracted from predefined regions such as corpus callosum, fornix etc.
ROI Definition
While relatively easy to implement, there are some important things to keep in mind when performing ROI analysis. As mentioned before, a ROI can be best defined on high quality T1 or T2 weighted anatomical reference images. This is to avoid bias of defining the ROI on the parameter map of interest, which may influence the position and boundaries or the ROI. However, when choosing this approach one has to take great care that the ROI position on the reference images and the parameter map of interest are aligned as illustrated in Fig. 9.2. In this figure the contour of the brain derived from the reference scan is overlaid on the diffusion weighted images and the FA map . Both images were acquired during the same scanning session, which should assure a good alignment. At first sight, the un-weighted and the diffusion-weighted images seem to match well with the reference image. However, closer examination clearly shows misalignment. This same misalignment may not be so apparent when just looking at the corresponding FA map (see Fig. 9.2d, h).
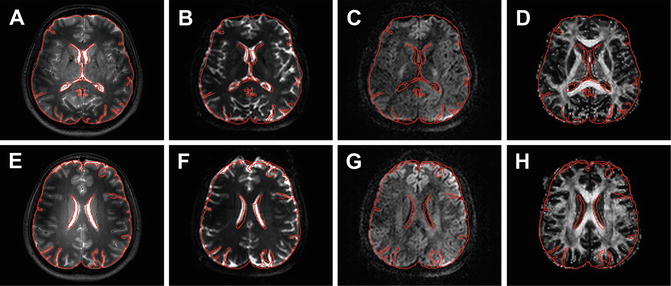
Fig. 9.2
Examples of misalignment between different image types. Panels (a) and (e) show high-resolution T2-weighted images with the contour of the brain outlined in red. This contour is overlaid on the corresponding un-weighted (b = 0, (b) and (f)) and diffusion weighted (b = 1000 s/mm2, (c) and (g)) images and the FA map (d and h)
The origin of the discrepancy between the different images can have multiple reasons but can have a great effect on parameter quantification and fiber tractography [13]. One common reason for misalignment is that the diffusion images are usually acquired with a single-shot EPI readout, which commonly has nonrigid geometric distortions due to its sensitivity to susceptibility artifacts (see Chap. 6). Furthermore, there can be patient motion in between acquisition of the reference image and diffusion data within the same scan protocol. This motion causes rigid misalignment of the images
Effect of Motion and Size
Although the distortions and offset might seem negligible, one has to realize that only a small misalignment can have serious impact on the parameter estimation. To illustrate this point, two regions of interest in the corpus callosum were defined. Both the regions were based on the anatomical reference image as well as the FA map (see Fig. 9.3). Furthermore, the size of the two different ROIs was varied to illustrate the effect of partial volume effects and user bias in defining the regions of interest. The results for the average FA and MD value s from these different ROIs are given in Table 9.1. The variation of the parameters clearly emphasizes the sensitivity of the technique to ROI definition and positioning [14]. Small ROIs will typically be more sensitive to erroneous voxels within the ROI. Increasing the ROI size will generally decrease the sensitivity to these errors, but will increase contamination by other structures, also known as partial volume effects , decreasing the sensitivity [15].
Fig. 9.3
Two examples of a rectangular ROI selecting the frontal and middle part of the corpus callosum. For each region one ROI was drawn based on the high-resolution reference scan (red) and one ROI was drawn based on the FA map (blue). The selections are shown on the T2-weighted anatomical image (a and e), the un-weighted diffusion image (b and f), the FA map (c and g), and the MD map (d and h)
Table 9.1
Average values for two part of the corpus callosum for different sizes of manually drawn rectangular regions of interest. The ROIs were drawn both on the anatomical reference images and the FA maps
Anatomy | FA map | ||||
|---|---|---|---|---|---|
Size (pixels) | FA | MD (×10−3 mm2/s) | FA | MD (×10−3 mm2/s) | |
Front | 3 × 5 | 0.71 ± 0.20 | 0.82 ± 0.44 | 0.81 ± 0.11 | 0.77 ± 0.17 |
5 × 7 | 0.59 ± 0.33 | 1.19 ± 0.82 | 0.77 ± 0.20 | 0.85 ± 0.49 | |
7 × 9 | 0.52 ± 0.35 | 1.34 ± 0.87 | 0.63 ± 0.28 | 0.96 ± 0.58 | |
Mid | 7 × 7 | 0.75 ± 0.13 | 0.79 ± 0.11 | 0.80 ± 0.10 | 0.76 ± 0.13 |
9 × 9 | 0.75 ± 0.16 | 0.80 ± 0.17 | 0.75 ± 0.16 | 0.85 ± 0.32 | |
11 × 11 | 0.75 ± 0.19 | 0.81 ± 0.23 | 0.71 ± 0.22 | 0.93 ± 0.47 | |
This implies that the definition of the ROIs should be done with great care and accuracy. Although the positioning of circles or rectangles is fast and easy it is generally better to accurately outline the ROI according to the shape of the structure. The latter is more time consuming but can greatly help minimize the inclusion of other structures [16]. Another way to exclude different types of tissue is to exclude pixels based on diffusion parameters. For example one can exclude cerebrospinal fluid by excluding pixels with high MD and low FA. However, with this method it is also possible to exclude the tissue of interest with pathology and thus affected parameters.
Registration
There are multiple strategies to correct for the distortions of the EPI images, e.g., B0 field mapping [17, 18], point spread function mapping [19, 20], or reversed gradient acquisition [21, 22]. However, these correction methods demand an extra data acquisition prolonging scan time. Another commonly available method is image registration (see Chap. 10). This technique is widely available in data processing software [1]. Figure 9.4 shows an example of nonrigid registration to correct for the misalignment between the diffusion tensor imaging data and the corresponding anatomical reference data. In panel A and B one can clearly see the misalignment between the corpus callosum, shown in red on the color-coded FA map, and the lateral ventricles, shown in white on the anatomical reference image. After nonrigid registration using ExploreDTI [23] one can appreciate the correct alignment of these structures as shown in panel C and D. The effect of registration on parameters estimated from ROIs drawn on the anatomical image are shown in Table 9.2. The ROIs were drawn in the regions indicated by the white arrows. In this example the FA increases and MD decreases after registration. For all parameters the standard deviation decreased.