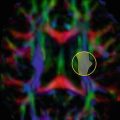
Fig. 15.1
Differentiation between arachnoid cyst and epidermoid cyst using DWI. A 19-year-old female patient (a–c) and a 27-year-old male patient (d–f), each with a lesion located in the quadrigeminal cistern. Both lesions show a high signal intensity on T2-weighted images (a, d) and low signal intensity on T1-weighted images (b, e). The axial diffusion-weighted trace images (b = 1000) demonstrate no restricted diffusion in the 19-year-old female patient (c). The lesion was a histologically proven arachnoid cyst. In the 27-year-old male, the trace image (f) showed restricted diffusion. He had a histologically proven epidermoid cyst
In addition to standard DTI derived parameters such as ADC (or mean diffusivity, MD) and FA, other indices have been proposed, which may provide additional complementary information when characterizing brain tumors, such as the FAtumor/FAnormal appearing white matter ratio, fiber coherence index, and tumor infiltration index [2, 3].
It is important to understand however that although the utility of DTI has been demonstrated in clinical studies, there remains a wide range of findings, which are sometimes contradictory and which may be due to differences in methodology. This limits the clinical applicability of such DTI findings in individual patients. This topic is addressed in more detail in this chapter. Supplemented with illustrative case studies, the remainder of the chapter reviews the role of DTI in the differential diagnosis and follow-up of brain tumors, and includes detailed sections on surgical planning, tumor grading, and characterizing posterior fossa tumors in children.
The Role of DWI and DTI in the Characterization and Differential Diagnosis of Mass Lesions in the Brain
Imaging findings in brain tumors are frequently nonspecific on conventional MRI. Both low-grade (LGGs) and high-grade gliomas (HGGs) , metastases, and lymphomas show variable high signal on FLAIR and T2-weighted images, and are hypo- to isointense on T1-weighted images, whilst all lesions may show some degree of enhancement on contrast-enhanced T1-weighted images. Also non-tumoral lesions, such as acute and subacute infarcts, tumefactive demyelinating lesions, abscesses, and hematomas may sometimes be difficult to differentiate. More advanced neuroimaging techniques such as DWI and DTI, in combination with MR spectroscopy and perfusion and permeability MR imaging, may be helpful in obtaining a specific diagnosis.
Differentiating between Tumors, Cysts, and Abscesses
Abscess pus is a creamy and viscous fluid containing inflammatory cells, bacteria, mucoid proteins, and cell debris. The high cellularity of pus represents the main biological parameter leading to a diminution of the extracellular space and to decreased diffusion. Ebisu et al. [4] were the first to report on the difference in ADC value between abscess fluid and necrotic or cystic tumors , and to highlight the capability of DWI to discriminate between these two types of mass lesions. Marked hyperintensity on DWI was observed in the abscess cavity, which was associated with an extremely low ADC (0.31 × 10⁻³ mm2/s). Restricted diffusion might be characteristic but is not pathognomonic for abscesses, as low ADC values also may be found in brain metastases. Rare cases of glioblastoma multiforme (GBM) that show restricted diffusion, i.e., hyperintense on trace DW images and hypointense on ADC maps, have been also reported in the literature [5]. The application of MR spectroscopy and MR perfusion may be helpful in these patients. Additionally, there are cases of cerebral abscess cavities showing hypointensity on DWI and high ADC values which overlapped with findings of neoplastic cysts . The cause of increasing diffusion in abscess cysts might be due to changes in pus composition and probably reflects increasing pus liquefaction as a result of adequate antibiotic therapy [6].
Conventional MRI does not allow an adequate differentiation between an abscess, a glioblastoma, and a solitary metastasis. The three entities generally present as rim-enhancing, central necrotic, expansive lesions with distinct perilesional edema.
At histopathological examination, the cystic parts of glioblastoma and metastases contain necrotic tumor tissue, while the enhancing rim on conventional MRI represents viable tumor cells. In a brain abscess, the cavity contains necrotic debris, neutrophils, and bacteria whereas the enhancing rim is a fibrous capsule formed by collagen [7, 8]. The role of DWI in the differential diagnosis of tumoral lesions versus abscesses, with the ADC typically low in abscess cavities and high in tumor cysts, has been widely demonstrated. However, high diffusivity similar to that found in necrotic tumors has been reported in abscesses. Brain tumors with infected or hemorrhagic material can show similar ADC in the cystic core compared to brain abscesses. Several studies addressed the role of DTI in optimizing the differential diagnosis of tumoral from non-tumoral infectious lesions.
Although results vary greatly among different studies, the consistent findings are reported regarding the FA values in the immediate perilesional edema of abscesses versus tumors. Elevated FA values are reported in the perilesional edema of the GBM and metastases [8–10]. In contrast, brain abscesses are associated with a lower FA in the peritumoral edematous zone. The elevated FA value in the immediate peritumoral edematous region of tumors is probably a result of a compressive effect, as well as gliosis. The gliotic response, an astrocytic reaction in response to any central nervous system injury, usually exists for a shorter duration in an abscess compared to a tumor. Consequently, the gliosis may be in an earlier stage with more irregular glial fibers, explaining the lower FA value.
Higher FA values in the core of abscesses compared to GBM and metastases are reported [10, 11]. The higher FA in the abscess cavity is postulated to reflect a combination of cells, necrotic debris, viscosity, and macromolecules present in the pus due to upregulation of various adhesion surface molecules [8].
Elevated FA values are also reported in the enhancing rim of abscesses , which probably reflect the concentric layers of collagen fibers that intermix with the neutrophils and macrophages [8, 12, 13].
Although absolute FA values vary greatly among studies due to different acquisition schemes, field strengths and processing methods, some guidelines can be deducted. FA values measured in the necrotic and solid enhancing parts of glioblastoma and metastases are typically lower than those in normal white matter. FA in the cystic cavity and enhancing rim of an abscess can be as high as values found in normal white matter.
Differentiating between Epidermoid and Arachnoid Cysts
Epidermoid cysts are slow-growing lesions derived from ectodermal tissue that are hypothesized to have been inwardly displaced from the ectodermal surfaces during embryologic development. These cysts represent 1–2 % of all intracranial tumors, and occur typically as extra-axial lesions, most commonly in the cerebellopontine angle [14], fourth ventricle, parasellar region, and subarachnoid spaces of the basal cisterns. Less common locations include the middle cranial fossa, the lateral ventricles [15], diploe, and the spinal canal [16]. Epidermoid cysts that are exclusively intraparenchymal are very rare [17]. Most are asymptomatic but may occasionally result in mass effect, cranial neuropathy, or seizure. Occasionally, epidermoid cysts rupture and may elicit a granulomatous meningitis [18]. Most epidermoid cysts are isointense to CSF, although close inspection often shows they are not precisely identical in signal intensity to CSF [18]. The differential diagnosis with arachnoid cysts is usually made with FLAIR and DWI [19]. Epidermoid cysts do not suppress completely on FLAIR images and show high signal intensity on DW images [18–21]. The usefulness of DWI in distinguishing epidermoid tumors from arachnoid cysts was first reported by Tsuruda et al. in 1990. They showed that the ADC of epidermoid tumors is clearly lower than that of arachnoid cysts. Epidermoid cysts display much lower ADC values than the CSF, and little higher ADC values when compared with normal gray or white matter [21, 22]. So, whether the high signal on DW images in epidermoid cysts is due to diffusion restriction or T2 shine-through remains controversial [20–22]. Reduced ADC is not the only explanation of the epidermoid cysts bright signal intensity on the DW trace images [20]. The mechanisms of signal intensity generation in epidermoid appear to be different in various sequences and the additive effect of diffusion anisotropy and T2 shine-through may be the cause for bright signal on DWI [22]. On exponential DW images, epidermoid cysts have similar intensity with brain parenchyma showing that hyperintensity of these lesions on trace images is caused by increased T2 effect rather than the decrease in ADC values [23].
The high signal intensity on DWI of epidermoid tumors also serves as a useful feature for the detection of any residual tumor on postoperative follow-up examinations (Fig. 15.2).
Fig. 15.2
A 7 year old boy (a–c) and a 51-year-old woman (d–f) both presented with headache and fever. Contrast-enhanced CT (not shown) displayed a solitary ring-enhancing lesion in the brain. MRI was performed to further characterize the lesions. Gd-enhanced T1-weighted images (a, d) show smooth ring enhancement in the right temporal lobe lesion (a) and a slightly irregular ring enhancement in the deep frontal white matter of the left cerebral hemisphere (d). The axial diffusion-weighted trace images (b = 1000) show high signal intensity (b) with corresponding low signal on the ADC map (c) indicative for restricted diffusion in the 7-year-old boy. Facilitated diffusion (low signal on DWI trace image (e), and high signal on ADC (f)) is observed in the 51-year-old woman. Final diagnosis was bacterial abscess and necrotic solitary metastasis of a primary lung cancer
Differentiating between High-Grade Gliomas and Tumefactive Demyelinating Lesions
Tumefactive demyelinating lesions (TDL) are demyelinating lesions larger than 2 cm, often indistinguishable from high-grade gliomas with conventional MRI. Incorrect diagnosis leads to unnecessary treatment such as radiotherapy, which could exacerbate demyelinating disease. Conventional imaging features of TDL include a relative lack of mass effect, less substantial perilesional edema, and open ring enhancement. These findings were proven to be nonspecific [24]. Very few studies have focused on the role of DTI in the characterization of TDL [25, 26]. Intralesional elevated FA values in the peripheral enhancing portions as well as in the central portion have been reported to differentiate TDL from high-grade gliomas, although differences were very small (average FA: 0.07 versus 0.06) [25]. Therefore we conclude that quantitative DTI is not useful in the differential diagnosis of TDL and high-grade glioma in individual patients.
Characterizing Brain Tumors
Glioblastoma Multiforme versus Solitary Metastasis
Intracranial metastases and glioblastoma are the most common intra-axial brain tumors in adults with gliomas representing 40 % of all primary brain tumors and brain metastases occurring in almost 15 % of all cancer patients [27]. In the typical setting of an oncological patient presenting with multiple lesions, the diagnosis of brain metastasis is straightforward using conventional MRI and clinical history. However, in the patient with unknown primary malignancies and a solitary brain lesion, differentiation may often be difficult. On conventional MR imaging, both HGGs and solitary metastasis display similar signal intensity characteristics and contrast enhancement patterns [2, 28–30] and anatomical MRI is not able to accurately characterize the extent of tumor infiltration.
Chiang et al. found the mean ADC values in contrast-enhancing areas of metastases to be significantly higher than those in HGGs [31]. However, the ADC values for metastases and enhancing gliomas overlap and most studies in the literature have suggested that the tumoral ADC value is not useful for discriminating metastatic tumors from HGGs [32–40]. HGGs and metastatic tumors often display heterogeneous signal intensity secondary to necrosis and susceptibility artifacts. As a result of this heterogeneity, DWI metrics obtained from the tumor can be imprecise or inaccurate [39].
Most tumors are surrounded by a high T2 signal area indicative of vasogenic edema. In general, the nonenhancing area of signal abnormalities that surrounds the enhancing tumor is referred to as peritumoral edema. In metastatic brain tumors or non-infiltrative primary tumors such as meningioma, peritumoral edema is synonymous with vasogenic edema. In HGGs, however, peritumoral edema is better referred to as “infiltrative edema” because it represents vasogenic edema and infiltrating tumor cells that invade newly formed or pre-existing blood vessels and white matter tracts [39]. Therefore, the key to distinguishing between these two entities appears to lie in detecting the changes within the peritumoral area—that is, the area beyond the enhancing margin [39].
Several studies have suggested that DTI can aid in the distinction of vasogenic edema surrounding metastases from nonenhancing tumor infiltration in gliomas [3, 10, 41–43]. A number of studies have demonstrated the utility of ADC in the peritumoral region for differentiating HGGs and solitary metastasis, and have found that the mean or minimum ADC values in peritumoral edema of metastases are significantly higher than those in HGGs [31, 37–39, 44]. Other groups, however, believe that ADC measurements in the peritumoral areas of GBM and metastasis cannot be used to distinguish between these groups, as a large overlap is often demonstrated [34, 40].
In metastasis, the peritumoral region does not contain infiltrating tumor cells. FA values have been reported to be negatively correlated with cellular density and tumor infiltration. In addition to FA, less commonly used scalar measures: p, q, and L exist, which represent pure isotropic, anisotropic diffusion, and the total magnitude of the diffusion tensor, respectively [42]. Wang et al. [45] argued that the integration of multiple measures would provide insights in tumor infiltration. In several studies, Price et al. demonstrated that increased isotropic diffusion correlates with tumor infiltration [43, 46]. The extent of the abnormality of pure isotropic diffusion was a predictor for tumor spread at the time of progression [43] (Fig. 15.3).
Fig. 15.3
Low-grade glioma in the midbrain of a 28-year-old male. The axial Flair (a) demonstrates a diffuse infiltrating tumor in the midbrain around the aqueduct. The lesion has a high T2-signal intensity. The color-coded FA map (b) and measurements of FA and ADC calculated on a Siemens Leonardo (Erlangen) workstation values (c) in the tumor (red) and NAWM (green) illustrating that FAtumor < FANAWM and ADCtumor > FANAWM
Glioblastoma Multiforme versus Lymphoma
Primary central nervous system lymphoma (PCNSL) is a manifestation of extranodal non-Hodgkin’s lymphoma, which accounts for 6 % of all intracranial malignant tumors. 90 % of PCNSLs are histologically diffuse large B-cell lymphomas, and the remaining 10 % are poorly characterized low-grade, Burkitt’s or T-cell lymphomas. An increase in the incidence of PCNSL has been reported both in immune-compromised and immune-competent individuals in the last decades, especially among the elderly [47]. The peak prevalence is between the fifth and sixth decades of life. Histologically, PCNSLs are typically angiocentric tumors that form perivascular cuffs of tumor cells, which infiltrate brain parenchyma either as individual diffusely infiltrating cells or as a compact aggregates of tightly packed cells [48]. Because of their high degree of cellularity, PCNSLs are frequently hyperattenuating to gray matter on CT and hypointense to gray and white matter on T2-wi. Usually these tumors show homogeneous and intense contrast enhancement. Both tumors can primarily affect or secondarily extend across the corpus callosum with a characteristic butterfly pattern of infiltration [49] (Fig. 15.4).
Fig. 15.4
Primary central nervous system lymphoma (PCNSL) characterized by DWI. A 54-year-old man with an expansile lesion within the splenium of the corpus callosum. Low signal intensity on T1-weighted image (a) and intermediate signal intensity (almost isointense with cortical gray matter) on T2-weighted (b) and FLAIR (c) images. Moderate vasogenic edema can also be observed. After gadolinium injection, homogeneous and intense contrast enhancement is seen (d). The axial diffusion-weighted trace image (b = 1000) shows high signal intensity (e) with corresponding low signal on the ADC map (f) indicative of restricted diffusion. The proposed diagnosis of PCNSL was confirmed by stereotactic biopsy
Differentiation between PCNSL and other primary brain tumors, such as GBM, can however sometimes be difficult or even impossible because conventional MR imaging findings may overlap [47]. Accurate preoperative differentiation between these two tumor types is important. Primary therapy for HGGs/GBMs almost always includes neurosurgical resection, whereas PCNSL is managed primarily with chemotherapy or radiation therapy after stereotactic biopsy [47].
PCNSLs are generally hyperintense to gray matter on trace DW images and isointense to hypointense on ADC maps, findings consistent with restricted diffusion due to high cellularity [33, 35, 48]. In contrast, HGGs are generally hyperintense to gray matter on both trace DW images and ADC maps, findings consistent with the so-called T2 shine-through phenomenon, rather than low diffusivity [48]. Guo et al. were the first to publish quantitative data regarding water diffusivity (i.e., ADC values) in PCNSL and to correlate these values directly with the cellularity of the tumor [48]. Strongly reduced ADC values have been described as being typical for PCNSL [33, 48–50]. However, rare cases of GBMs that show restricted diffusion, i.e., hyperintense on trace DW images and hypointense on ADC maps, have been reported in the literature [5]. The application of MR spectroscopy and MR perfusion may be helpful in these patients. In a series of PCNSLs and astrocytic tumors infiltrating the corpus callosum, Horger et al. observed lower (17 %) ADC values for both tumor types when compared to other previous studies. The lower ADCs in their cohort may be the result of mixed inhibition of water diffusivity caused by both tumor tissue and the underlying white matter fibers of the corpus callosum [49] (Fig. 15.5).
Fig. 15.5
(a) A 46-year-old male with a strong enhancing lesion in the left cerebellar hemisphere on the axial T1-weighted images. The lesion has a restricted diffusion with a very low ADC value as demonstrated on the trace images (b) and the ADC maps (c). The color-coded FA maps a low FA value of the lesion, which is a histological proven B-cell lymphoma (d)
Meningiomas
Meningiomas account for 30 % of all intracranial neoplasms, with up to 20 % of these lesions being atypical (WHO grade II) or anaplastic (WHO grade III) [51]. These are more aggressive tumors with high morbidity, mortality, and recurrence rates. The incidence and prevalence of meningiomas are twice as high in women compared to men, and higher in middle-aged patients. Most meningiomas are benign, but some may cause edema in the adjacent brain parenchyma depending on their size, subtype, or hormone receptors present in the lesion. The edema surrounding meningiomas is purely vasogenic. In most cases diagnosis of meningioma is straightforward given their extra-axial location. In some cases it may be difficult to differentiate meningiomas from large intra-axial tumors. Most meningiomas are well organized, from which the organization may differ between subtypes. Meningiothelial meningiomas, the most common meningioma, consist of cells arranged in lobules or whorls. The fibroblastic meningiomas consist of spindle cells with nuclei arranged in fascicules or storiform pattern. Atypical and malignant meningiomas show discohesion of the tumor cells with loss of histologic structure. Distinctions in microstructure are reflected on DTI in differing FA values, which appear to be helpful to differentiate fibroblastic meningiomas from other benign subtypes [52] and atypical or malignant meningiomas from the benign ones [53]. Preoperative planning for meningiomas requires information about tumor location, size, and tumor consistency and in grade I meningioma, lesion consistency is an important factor determining surgical outcome. For example, a hard consistency, as seen in fibroblastic subtypes, makes the removal difficult [54], whereas soft tumors are suckable and therefore more easy to resect than hard tumors, especially if there is an encasement of nerves or blood vessels. This means they require a shorter operating time and have a better outcome than hard meningiomas. Conventional MRI is unable to differentiate subtypes and grades, based on signal intensity value on T1- and T2-weighted images. An elevated FA is observed in fibroblastic meningiomas compared to meningothelial meningiomas. Fibroblastic meningiomas present with a fascicular orientation of long spindle-shaped tumor cells with a high content of intracellular collagen and reticulin, which is believed to be responsible for the hard consistency of these tumors. Transitional meningiomas showed no differences with either type [45, 52, 54, 55]. Although literature reports concerning the added value of DTI in predicting meningioma consistency are fairly consistent, studies regarding the differentiation of typical versus atypical and anaplastic meningiomas using DTI show substantially less agreement [2, 53, 56]. Further studies are warranted to address this issue. Conventional MRI features with cystic changes, hemorrhage, ischemic necrosis, and extracranial extension through the skull are more indicative of rapid growth and thus of an aggressive nature, although this reflects already advanced stages of disease [1, 57] (Fig. 15.6).
Fig. 15.6
Midline meningothelial meningioma in the anterior cranial fossa in a 61-year-old woman. A coronal TSE T2 (a) and Gadolinium-enhanced axial TSE T1 (b) demonstrate a large well-circumscribed midline tumor, which displays the typical characteristics of a meningioma. Hematoxylin and eosin staining, original magnification × 200, demonstrates the fascicular arrangement of the tumor cells (d). This more organized structure is reflected in the axial color-coded FA map (e). A schematic representation of the FA map is shown in (f). Green indicates a predominantly anteroposterior direction of fibers (as seen in the anterior and posterior quadrant of the lesion), whereas red indicates fibers with a predominantly left-right orientation (as seen in the left and right lateral quadrants of the tumor). A blue area, in the center of the tumor, indicates vertically oriented fibers. The architecture of this tumor with high FA values can be displayed using diffusion tensor tractography (c), which nicely illustrates the spoke-wheel pattern
Posterior Fossa Tumors in Children
Brain tumors are the most common solid tumors in children, with an estimated incidence between 1 and 3 per 100,000. Whereas in infants most brain tumors are located at the supratentorial level, in children over the age of 4, infratentorial tumors are more frequent. Most common posterior fossa tumors in children include pilocytic astrocytoma (PA) , medulloblastoma (MB) , ependymoma (EP) , and brain stem glioma [58]. Other tumor types such as atypical teratoid–rhabdoid tumor, hemangioblastoma, schwannoma, and choroid plexus papilloma are less frequently observed. Accurate preoperative diagnosis is important, because the most common tumors in this location and age group, benign PA and highly malignant MB, not only have different treatment approaches but also different natural histories and outcomes [59].
DWI distinguishes tumor types and histological grades, because higher-grade tumors have increasingly restricted diffusion (high signal intensity on DWI, low ADC values) [59, 60]. Kotsenas et al. were the first to describe the high signal intensity of MB on DWI. They postulated that the densely packed tissue, the high cellularity, and small extracellular space of MB restrict the extracellular diffusion of water protons, and that the high nuclear-to-cytoplasmic ratio of these tumor cells limits intracellular motion. The combination of these factors leads to a marked increase in signal on DWI (Fig. 15.7). Indeed, MBs are highly cellular WHO grade IV neoplasms, with little cytoplasm and extracellular matrix (i.e., small extracellular spaces). On the other hand, PAs (WHO grade I) are paucicellular tumors with abundant extracellular spaces. EPs (classic and anaplastic, WHO grades II and III, respectively) are between these two ends of the cellularity spectrum [51]. The significant differences in cellularity between these group of tumors—particularly between PAs and MBs—indicate that these lesions could potentially be distinguished by DWI and their ADC values. Rumboldt et al. observed significantly higher ADC values in PAs than in EPs and MBs, and EPs demonstrated higher ADC values than MBs [59]. They concluded that assessment of ADC values of enhancing solid tumor is a simple and reliable technique for preoperative differentiation of cerebellar tumors in children [59]. These observations were confirmed by other group [61, 62]. Other groups, however, observed overlap in ADC values between the different groups of tumors [60, 63–65]. Overlap was observed between the ADC values of the PAs and EPs, and the ADC values of EPs and MBs. There was, however, no overlap between the ADC values of PAs and MBs [66]. This overlap in ADC values between tumor types may be due to technical factors (especially in small, heterogeneous, calcified or hemorrhagic lesions) but also likely reflects true histologic variability [60]. Both MBs and EPs are heterogeneous tumors, and this heterogeneity presumably contributes to the possible overlap of their ADC values. MB consists of a classic type and four variants according to the latest WHO classification [67]. Desmoplastic MB is one of these variants that has a more favorable prognosis compared to the classical MB. Remarkable finding in this subgroup is the lower ADC values due to the presence of dense reticulin fiber networks within the extracellular space of the tumor [64, 68]. Rare cases of classic MB that show normal or even increased ADC values have been published; reticulin deposition was absent in these lesions [64]. Conversely, the large cell or anaplastic MB subtype which is associated with a high relapse risk and poor outcome may show increased ADC values since tumor cells are much larger when compared to classic MBs [68, 69]. Similarly, EPs have two distinct types, presumably contributing to their heterogeneity.
Fig. 15.7
Medulloblastoma characterized by DWI. An 18-month-old boy presented with headaches, nausea, and vomiting, Sagittal and axial T1-weighted images before (a, c) and after (b, d) Gd injection show a large tumor obstructing the fourth ventricle. Only very mild contrast enhancement in the center of the tumor is observed. Obvious obstructive hydrocephalus with dilatation of the third ventricle and temporal horns of the lateral ventricles and transependymal migration of CSF can be seen. The tumor is “bright” on the DW images (e), and “black” on the ADC maps (f), i.e., restricted diffusion. Final diagnosis after total resection was medulloblastoma, classic subtype
DWI is also a valuable tool in early detection of metastatic disease and treatment monitoring of MB patients. DWI may show recurrent tumor and/or metastatic deposits that are not seen on contrast-enhanced MRI [68, 70]. DWI is more sensitive than contrast-enhanced MRI alone in the early diagnosis of recurrent disease. It should therefore be included in the follow-up of patients with MB, especially when gross total resection of the tumor could not be achieved.
Determination of Tumor Grade
Diffusely infiltrating gliomas are the most common primary tumors of the brain in adults, ranging from low grade (WHO grade II) to high grade (WHO grade III and IV). Grading is based on the histopathological findings of the tumor, and differentiation between HGGs and LGGs is important for therapeutic planning, and assessing prognosis and response to therapy [71]. The presence of contrast enhancement on CT and conventional MRI as a marker of tumor angiogenesis has been an important criterion in predicting the malignancy of gliomas for many years. However, this is not a reliable finding since tumoral enhancement is mainly due to disruption of the blood brain barrier and not tumor angiogenesis [72]. Localized astrocytomas such as pilocytic astrocytoma (WHO grade I), subependymal giant cell astrocytoma (WHO grade I), and pleiomorphic xanthoastrocytoma (WHO grade II) typically show contrast enhancement. In a series by Kono et al., abnormal contrast enhancement was observed in 50 % of patients with diffuse astrocytoma grade II. Conversely, in a large series of supratentorial gliomas one third of the nonenhancing tumors proved to be malignant [73]. Other findings in HGGs on conventional MRI include the presence of peritumoral edema, mass effect, tumor heterogeneity, central necrosis, and intratumoral hemorrhage [74].
Previous reports have shown that the histopathological grade of glial tumors is inversely correlated with ADC, with lower ADCs found in higher-grade tumors in comparison with lower-grade tumors [32, 35, 59, 74]. Regions with minimum ADCs have been suggested to reflect the highest tumor cell density, or the most proliferative portion of the tumor, within heterogeneous tumors. Recent studies have shown that minimum ADCs may facilitate accurate grading of astrocytic tumors because regions exhibiting the minimum ADC correspond to the highest-grade glioma foci within heterogeneous tumors [74–76].
The higher the tumor cellularity and grade are, the lower the ADC is because of decreased water diffusivity [31, 32]. However, other factors may be complicating this relationship: ADC increases with increased edema and increased edema is seen in high-grade tumors [71].
Related posts:

Stay updated, free articles. Join our Telegram channel

Full access? Get Clinical Tree


