, Valery Kornienko1, Alexander Potapov2 and Igor Pronin3
(1)
Department of Neuroradiology, Burdenko Neurosurgery Intitute, Moscow, Russia
(2)
Department of Neurotrauma, Burdenko Neurosurgery Insitute, Moscow, Russia
(3)
Department of Neuroradiology, Burdenko Neurosurgery Institute, Moscow, Russia
Abstract
Chapter 4 is dedicated to dynamic structural changes of the white matter tracts examined by diffusion-tensor magnetic resonance imaging on the model of diffuse axonal injury. The objectives of this research were to study the analysis results of apparent diffusion coefficient and fractional anisotropy for diagnosis and prognosis of severe diffuse axonal injury and to study the structure of the corpus callosum and corticospinal tracts in patients with different types of conscious impairments and mental and motor disorders in dynamics in different periods following diffuse axonal injury.
The new data on pathogenesis and dynamics of diffuse brain injury with quantitative and qualitative changes in the white matter fiber tracts have been obtained. It was demonstrated that diffuse axonal injury, being a trigger mechanism of fiber tract degeneration with their subsequent atrophy, may be regarded as a clinical model of multidimensional “split brain” with commissural, association, and projection white matter tract disturbances. The degree of primary damage of the projection, commissural, or association connections is determined in each specific case by predominant biomechanics of the linear, angular, and rotational impact.
4.1 Quantitative Evaluation of Corpus Callosum and Corticospinal Tract Condition in the Acute Period of TBI
Quantitative DT-MRI analysis was performed in 22 patients aged 9–54 years (average 25 years, 13 males, 11 females) and in 8 healthy volunteers (control group) aged 22–57 years (average 33 years, 5 males, 3 females). All 22 patients were in coma (GCS of 4–8, average 6) on admission to the Burdenko Neurosurgery Institute, which lasted 3–20 days (average 12 days). CT revealed signs of DAI in all patients (categories I–IV according to Marshall et al. 1991). The outcomes in 3 months after injury in the analyzed group were as follows: good recovery in 3 patients, moderate disability in 7, severe disability in 9, and vegetative state in 3. MRI studies for these 22 patients were performed within 2–17 days of TBI, average of 10 days. The selection criteria for MRI studies were as follows: stabilization of patient’s condition, normalization of intracranial pressure and hemodynamics, adequate ventilation, and absence of metallic implants.
No statistically significant differences were found in ADC and FA between the right and left sides in the control group (Table 4.1). For this reason, all bilateral measurements in the control subjects were averaged.
Table 4.1
Average ADC and FA values for the control group
ADC values × 10 −3 ± SD × 10 −3 , mm 2 /s | |||
ROI | Right | Left | p -value |
CST at the level: | |||
PLIC | 0.699 ± 0.05 | 0.716 ± 0.05 | 0.489 |
Midbrain | 0.779 ± 0.03 | 0.799 ± 0.09 | 0.571 |
Pons | 0.732 ± 0.1 | 0.711 ± 0.1 | 0.673 |
Genu of CC | 0.852 ± 0.069 | 0.857 ± 0.07 | 0.885 |
Splenium of CC | 0.791 ± 0.1 | 0.789 ± 0.1 | 0.973 |
FA values ± SD | |||
Right | Left | p -value | |
CST at the level: | |||
PLIC | 0.714 ± 0.02 | 0.695 ± 0.02 | 0.081 |
Midbrain | 0.717 ± 0.038 | 0.698 ± 0.049 | 0.451 |
Pons | 0.573 ± 0.04 | 0.553 ± 0.04 | 0.317 |
Genu of CC | 0.755 ± 0.045 | 0.739 ± 0.045 | 0.526 |
Splenium of CC | 0.787 ± 0.051 | 0.786 ± 0.051 | 0.965 |
At the same time, average FA values in the control group along the corticospinal tracts at the level of pons were significantly lower compared to cerebral peduncles and internal capsule (Fig. 4.1).
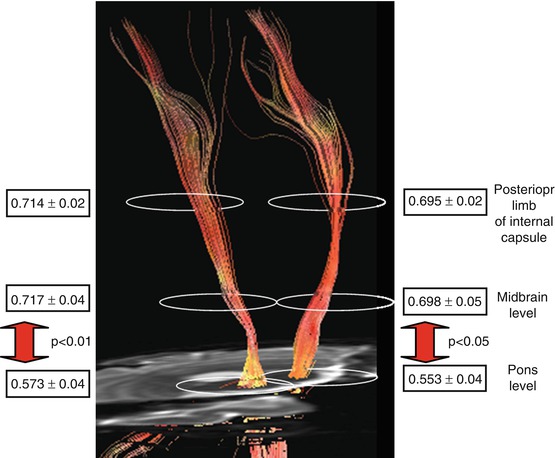
Fig. 4.1
Average fractional anisotropy values alongside the corticospinal tracts in healthy volunteers
The results of comparisons of bilateral ADC and FA values in seven patients without paresis are presented in Table 4.2.
Table 4.2
Comparison of bilateral average ADC and FA values in patients without paresis (n = 7)
ADC values × 10 −3 ± SD × 10 −3 , mm 2 /s | |||
ROI | Right | Left | p -value |
CST: | |||
PLIC | 0.732 ± 0.047 | 0.761 ± 0.139 | 0.471 |
Midbrain | 0.761 ± 0.074 | 0.749 ± 0.09 | 0.75 |
Pons | 0.756 ± 0.06 | 0.724 ± 0.084 | 0.308 |
FA values ± SD | |||
ROI | Right | Left | p -value |
CST: | |||
PLIC | 0.638 ± 0.106 | 0.652 ±0.125 | 0.764 |
Midbrain | 0.622 ± 0.114 | 0.629 ± 0.085 | 0.857 |
Pons | 0.515 ± 0.085 | 0.501 ± 0.082 | 0.696 |
Table 4.2 shows that no statistically significant differences were noted for ADC and FA between the right and left sides along corticospinal tracts in patients without motor disturbances. Thus, they were also averaged. The average ADC and average FA values in this group were compared with those in the control group (Table 4.3).
Table 4.3
Comparison of averaged ADC and FA values in patients without paresis (n = 7) and in control group (n = 8)
ADC values × 10 −3 ± SD × 10 −3 , mm 2 /s | |||
ROI | Control group | Patients | p -value |
CST: | |||
PLIC | 0.708 ± 0.047 | 0.743 ±0.092 | 0.071 |
Midbrain | 0.789 ± 0.063 | 0.756 ±0.08 | 0.066 |
Pons | 0.722 ± 0.1 | 0.744 ± 0.07 | 0.131 |
FA values ± SD | |||
ROI | Control group | Patients | p -value |
CST: | |||
PLIC | 0.704 ± 0.02 | 0.643 ± 0.111 | 0.041 |
Midbrain | 0.708 ± 0.044 | 0.625 ± 0.101 | 0.0007 |
Pons | 0.563 ± 0.04 | 0.510 ± 0.082 | 0.013 |
There was a statistically significant FA value reduction along the corticospinal tracts in patients without hemiparesis compared with the control group, but no differences were observed for ADC values in any region (Table 4.3).
A statistically significant FA reduction was found at the cerebral peduncle level (p < 0.05) in the homolateral to hemiparesis CST in patients with hemiparesis (n = 11) compared to the control group (Table 4.4).
Table 4.4
Comparison of averaged ADC and FA values in homolateral to hemiparesis side in patients (n = 11) and in control group (n = 8)
ADC values × 10 −3 ± SD × 10 −3 , mm 2 /s | |||
ROI | Control group | Patients | p -value |
CST: | |||
PLIC | 0.708 ± 0.047 | 0.733 ±0.049 | 0.088 |
Midbrain | 0.789 ± 0.063 | 0.785 ± 0.079 | 0.444 |
Pons | 0.722 ± 0.1 | 0.749 ± 0.101 | 0.249 |
FA values ± SD | |||
ROI | Control group | Patients | p -value |
CST: | |||
PLIC | 0.704 ± 0.02 | 0.677 ± 0.092 | 0.296 |
Midbrain | 0.708 ± 0.044 | 0.666 ± 0.068 | 0.034 |
Pons | 0.563 ± 0.04 | 0.528 ± 0.111 | 0.192 |
Statistically significant differences were observed for FA in the posterior limb of the internal capsule (PLIC) and peduncles and for ADC in PLIC on the contralateral to hemiparesis side of CST in patients with hemiparesis compared to the control group (Table 4.5).
Table 4.5
Comparison of averaged ADC and FA values in contralateral to hemiparesis side (n = 11) and in control group (n = 8)
ADC values × 10 −3 ± SD × 10 −3 , mm 2 /s | |||
ROI | Control group | Patients | p -value |
CST: | |||
PLIC | 0.708 ± 0.047 | 0.785 ±0.116 | 0.011 |
Midbrain | 0.789 ± 0.063 | 0.786 ± 0.055 | 0.450 |
Pons | 0.722 ± 0.1 | 0.753 ± 0.085 | 0.198 |
FA values ± SD | |||
ROI | Control group | Patients | p -value |
CST: | |||
PLIC | 0.704 ± 0.02 | 0.590 ± 0.136 | 0.0065 |
Midbrain | 0.708 ± 0.044 | 0.585 ± 0.126 | 0.0011 |
Pons | 0.563 ± 0.04 | 0.509 ± 0.096 | 0.055 |
A statistically significant difference in FA values was found in the cerebral peduncles and PLIC between homolateral and contralateral sides in patients with hemiparesis (Table 4.6, Fig. 4.2).
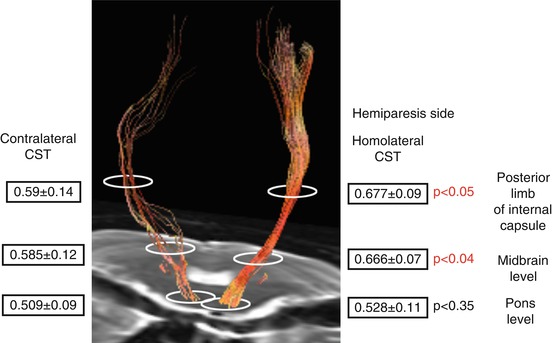
Table 4.6
Comparison of averaged ADC and FA values in homo- and contralateral sides in 11 patients with hemiparesis
ADC values × 10 −3 ± SD × 10 −3 , mm 2 /s | |||
ROI | Homolateral | Contralateral | p -value |
CST: | |||
PLIC | 0.733 ± 0.049 | 0.785 ±0.116 | 0.092 |
Midbrain | 0.785 ± 0.079 | 0.786 ± 0.055 | 0.486 |
Pons | 0.749 ± 0.101 | 0.753 ± 0.085 | 0.460 |
FA values ± SD | |||
ROI | Homolateral | Contralateral | p -value |
CST: | |||
PLIC | 0.677 ± 0.092 | 0.590 ± 0.136 | 0.046 |
Midbrain | 0.666 ± 0.068 | 0.585 ± 0.126 | 0.036 |
Pons | 0.528 ± 0.111 | 0.509 ± 0.096 | 0.355 |
Fig. 4.2
Average fractional anisotropy values alongside the corticospinal tracts in patients with hemiparesis
A statistically significant FA reduction was noted in all regions of interest along the CSTs when comparing 4 patients with tetraparesis to the control group (Table 4.7).
Table 4.7
Comparison of averaged ADC and FA values in patients with tetraparesis (n = 4) and in control group (n = 8)
ADC values × 10 −3 ± SD × 10 −3 , mm 2 /s | |||
ROI | Control group | Patients | p -value |
CST: | |||
PLIC | 0.708 ± 0.047 | 0.699 ± 0.057 | 0.165 |
Midbrain | 0.789 ± 0.063 | 0.793 ± 0.094 | 0.704 |
Pons | 0.722 ± 0.1 | 0.668 ± 0.158 | 0.002 |
FA values ± SD | |||
ROI | Control group | Patients | p -value |
CST: | |||
PLIC | 0.704 ± 0.02 | 0.634 ± 0.071 | <0.00001 |
Midbrain | 0.708 ± 0.044 | 0.579 ± 0.151 | <0.00001 |
Pons | 0.563 ± 0.04 | 0.477 ± 0.076 | <0.00001 |
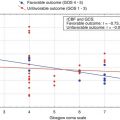
The study showed that FA values in the corpus callosum and along the corticospinal tracts as well as ADC values in the splenium of the corpus callosum significantly correlated (p < 0.01) with outcome in patients examined within 10–17 days after TBI (Table 4.8). However, there was no significant correlation between clinical outcome and diffusion parameters when patients were scanned 2–9 days following trauma.
Table 4.8
Correlation between averaged ADC and FA values and outcome (by GOS) in patients examined within 10–17 days after injury
ADC values | R-value (Correlation coefficient) | p -value |
PLIC | −0.068 | 0.749 |
Midbrain | −0.167 | 0.435 |
Pons | −0.213 | 0.317 |
Genu of CC | −0.141 | 0.512 |
Splenium of CC | −0.512 | 0.010 |
FA values | R-value (Correlation coefficient) | p -value |
PLIC | 0.660 | 0.0004 |
Midbrain | 0.390 | 0.059 |
Pons | 0.635 | 0.0008 |
Genu of CC | 0.534 | 0.007 |
Splenium of CC | 0.415 | 0.044 |
Comparisons of average ADC and FA values for the genu and splenium of the corpus callosum were performed in all groups of patients with DAI: with no paresis (7), with unilateral paresis (11), with tetraparesis (4), and in control group (8) (Table 4.9).
Table 4.9
Comparison of averaged ADC and FA values in the genu and splenium of the corpus callosum in patients with diffuse axonal injury and in control group
ROI | ADC values × 10 −3 ± SD × 10 −3 , mm 2 /s | ||
Control group | Without paresis | p -value | |
Genu of CC | 0.855 ± 0.067 | 0.847 ± 0.226 | 0.449 |
Splenium of CC | 0.790 ± 0.098 | 0.698 ± 0.092 | 0.0681 |
FA values ± SD | |||
Control group | Without paresis | p -value | |
Genu of CC | 0.748 ± 0.044 | 0.655 ± 0.075 | 0.0046 |
Splenium of CC | 0.786 ± 0.049 | 0.639 ± 0.119 | 0.007 |
ADC values × 10 −3 ± SD × 10 −3 , mm 2 /s | |||
Control group | Hemiparesis | p -value | |
Genu of CC | 0.855 ± 0.067 | 0.903 ± 0.158 | 0.081 |
Splenium of CC | 0.790 ± 0.098 | 0.681 ± 0.148 | 0.018 |
FA values ± SD | |||
Control group | Hemiparesis | p -value | |
Genu of CC | 0.748 ± 0.044 | 0.625 ± 0.129 | 0.001 |
Splenium of CC | 0.786 ± 0.049 | 0.604 ± 0.128 | 0.0001 |
ADC values × 10 −3 ± SD × 10 −3 , mm 2 /s | |||
Control group | Tetraparesis | p -value | |
Genu of CC | 0.855 ± 0.067 | 0.948 ± 0.098 | 0.023 |
Splenium of CC | 0.790 ± 0.098 | 0.700 ± 0.226 | 0.159 |
FA values ± SD | |||
Control group | Tetraparesis | p -value | |
Genu of CC | 0.748 ± 0.044 | 0.607 ± 0.090 | 0.0003 |
Splenium of CC | 0.786 ± 0.049 | 0.532 ± 0.171 | 0.0003 |
ADC values × 10 −3 ± SD × 10 −3 , mm 2 /s | |||
Control group | All patients | p -value | |
Genu of CC | 0.855 ± 0.067 | 0.892 ± 0.156 | 0.287 |
Splenium of CC | 0.790 ± 0.098 | 0.710 ± 0.137 | 0.034 |
FA values ± SD < div class='tao-gold-member'>
Only gold members can continue reading. Log In or Register to continue
Related posts: Clinical and Prognostic Value of Neuroimaging in Traumatic Brain Injury Clinical and Prognostic Value of Neuroimaging in Traumatic Brain Injury
 Clinical Evaluation and Neuroimaging Technologies Clinical Evaluation and Neuroimaging Technologies
 Mapping of Cerebral Blood Flow in Focal and Diffuse Brain Injury Mapping of Cerebral Blood Flow in Focal and Diffuse Brain Injury
 Dynamics of Hemispheric and Brain Stem Regional Cerebral Blood Flow Dynamics of Hemispheric and Brain Stem Regional Cerebral Blood Flow
 Neuroimaging Classification of Traumatic Brain Injury Neuroimaging Classification of Traumatic Brain Injury
 High-Resolution Magnetic Resonance Neurography in Upper Extremity Neuropathy High-Resolution Magnetic Resonance Neurography in Upper Extremity Neuropathy
Stay updated, free articles. Join our Telegram channel
Full access? Get Clinical Tree
 Get Clinical Tree app for offline access

| |||