(1)
Clinical Department, Urals Research Centre for Radiation Medicine, Chelyabinsk, Russia
Abstract
This section more thoroughly elaborates the dynamics of changes in the hematopoietic system which was critical in residents of the Techa riverside villages both as a result of the highest exposure doses due to 90Sr and also because of the high radiosensitivity of HSC (HSC). It is known that hematopoietic system maintains constant cell number in the peripheral blood and immune homeostasis. The major clinical changes in the period of CRS formation were cytopenia (neutropenia, thrombocytopenia, and less frequently lymphopenia), and changes in the RBM (delays in the maturation of the granulocytes at the stage of myelocyte, accelerated maturation and increased proliferation of erythrokaryocytes, etc.). A high level of lethal aberrations (chromosomal bridges, fragmentosis of the nucleus, etc.) and abnormal mitoses (chromosome clumping) were registered in the RBM cells. The dynamics of hematological disorders is determined by the dose rate to RBM. The extent and duration of the hematopoiesis recovery depend on the degree of CRS severity. In mild CRS cases there may occur a gradual spontaneous recovery of the hematopoiesis. In the majority of such patients in six to ten years after the onset of the exposure the number of neutrophils, thrombocytes and lymphocytes normalized .
This section more thoroughly elaborates the dynamics of changes in the hematopoietic system which was critical in residents of the Techa riverside villages both as a result of the highest exposure doses due to 90Sr and also because of the high radiosensitivity of HSC (HSC). It is known that hematopoietic system maintains constant cell number in the peripheral blood and immune homeostasis. Hematopoietic system is structurally and functionally closely connected to the immune system. The central organ of hematopoiesis and immunogenesis is RBM. Most HSC are located and develop in RBM. HSC self-sustaining pool maintains myeloid and lymphoid hematopoiesis. Erythrocytes, all types of granulocytes, monocytes, and thrombocytes are formed in the process of myeloid hematopoiesis. T-and B-lymphocytes develop as a result of lymphoid hematopoiesis. Thymus, lymphatic nodes, spleen, tonsils, Peyer’s patches, and solitary nodes of the mucous membranes are the organs and tissues involved in lymphoid hematopoiesis. Regulation of the blood-forming organs is performed through cell migration, as well as by means of neural and humoral factors. Cytokines (interleukins, hemopoetins, chalones) produced by hematopoietic cells and cells of hematopoietic microenvironment (fibroblasts, macrophages) play an important role in the regulation of various hematopoietic lineages.
6.1 Hematopoietic Status in Patients During the Period of CRS Development
The status of the peripheral blood and RBM was studied for the period of 1951 through 1956 in 794 persons who in 1950–1960s were diagnosed with CRS (hereinafter referred to as persons with CRS) and in the control group that comprised 306 people. The control group consisted of persons living in the same administrative areas but whose dose rate to RBM during the period of maximum radiation exposure (1951) did not exceed 5 mGy/year. As it has already been mentioned earlier, in this period maximum releases of radioactive wastes into the Techa River occurred and maximum organ dose rates were registered. The study included people who at the date of the examination did not have any significant health impairments (cancer and hematological pathology, acute and chronic inflammatory disease exacerbation). To eliminate the influence of medical therapy and diagnostic procedures on the peripheral blood status, the results of the blood analysis on admission of the patient were analyzed.
The study and control groups were comparable in age and sex. The study included individuals from the age of 16. The number of men and women and the elderly (60 years and older) in the two compared groups was not significantly different. The mean age at the onset of exposure (1950) in the group of persons with CRS was 28.1 ± 0.5 years, and in the control group, 27.8 ± 1.1 years. The age range in both groups was 14–66 and 14–64 years, respectively. The number of men in the group of exposed subjects was 303 people (32.4 %). In the control the number of males was 128 (41.8 %).
RBM hematopoiesis in persons with CRS was studied in 1954–1956 in 38 individuals. The control group (16 people) consisted of apparently healthy individuals (RBM donors – 5 persons) and individuals with somatic disorders (11 people). The latter underwent RBM analysis in order to exclude hematopoietic pathology in cases of transient neutropenia, leukopenia, and “band shift” in the blood count. The age range in the exposed and control groups formed during the study of the RBM hematopoiesis was 14–43 and 14–49 years, and mean age was 24.1 ± 1.6 and 24.8 ± 3.4, respectively.
The cell composition of the peripheral blood in dynamics was analyzed in all persons with CRS and those from the control group: the amount of erythrocytes, hemoglobin, leukocytes, and thrombocytes was determined, leukogram was counted. As throughout the long-term follow-up period methods of laboratory examinations have changed, in order to unify the results, the errors of blood count analysis, performed with the use of different methods, were compared. For this purpose, literature data (Sokolov and Gribova 1972; Ilyin 1985; Menshchikov 1987) and manual to the analyzer were used. In the course of the analysis, the conclusion was made concerning the comparability and consistency of the methods used in the clinical laboratory of the URCRM and the country. However, it should be noted that the analytical methods based on automatic performance, compared to routine methods, by reducing the value of the calculation error, could have somewhat underestimated the value which characterizes the variability of the investigated parameter (σ) (Sokolov and Gribova 1972).
Smears of the liquid RBM, obtained in 1954–1956 during RBM aspiration and stained by Romanowski-Giemza method with prefixation with methanol, served as the material for cytological examination of the RBM (Smirnova and Kost 1960). The following methods of cell counting were used:
Calculation of the total number of nucleated cells (in Fuchs-Rosenthal count chamber)
Standard myelogram count (200 cells)
Calculation of the partial myelograms of the myeloid and erythroid hematopoietic lineages (1,000 cells) (Sokolov and Gribova 1972)
The analysis of partial myelograms made it possible to estimate cell distribution through the stages of differentiation (M1) from myeloblast to segmented neutrophil (M7) in neutrophil lineage of RBM and from erythroblast (E1) to oxyphilic normocytes (E5) in erythroid lineage, and also proliferative activity of the cells in neutrophil and erythroid lineages, mitotic activity of the cells at M3 + M4, E1 + E2, E3, and E4 stages.
6.1.1 Peripheral Blood Cell Composition
As the results presented in Fig. 6.1 show, the initial period of CRS formation (1951–1956) was characterized by a significant reduction in leukocyte count in the peripheral blood. The lowest values of the leukocytes were observed in the first 3 years after the onset of radiation exposure (1951–1953) when the dose rate to RBM was the highest (see Chap. 2). In chronically exposed individuals without CRS, leukocyte count at that time decreased to a lesser degree (mean leukocyte number was 5.7 ± 0.1 · 109/l). In 1954–1956 in exposed individuals without CRS, mean leukocyte count in blood did not differ from that in unexposed individuals from the control group and from the reference value (6.4 · 109/l) established for healthy people around the country (Sokolov and Gribova 1972; Ilyin 1985; Menshchikov 1987).
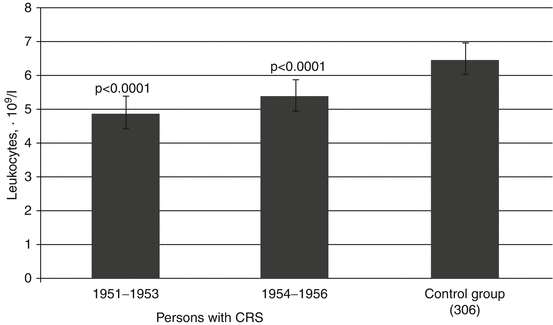

Fig. 6.1
Mean leukocyte count (M ± m) in the peripheral blood of persons with CRS in 1951–1956 (statistically significant difference with control group is presented)
During the CRS formation period in the 1951–1956, persons with CRS also demonstrated increase in frequency of leukopenia (Fig. 6.2). Moderate leukopenia (leukocyte number <4.0 · 109/l) was noted in 22.9 % of patients in 1–3 years after the onset of exposure and in 12.5 % in 4–6 years. The frequency of leukopenia in the group of exposed individuals without CRS in 1951–1953 and in 1954–1956 was 5.6 % and 1.7 %, respectively. In the control group leukopenia was registered in approximately 1 % which corresponds to the level of spontaneous leukopenia (Ilyin 1985). Marked leukopenia (<3.3 · 109/l) was observed in 4.6 % of patients with initial CRS diagnosis in 1951–1955 and in 2.4 % in 1954–1956. In the group of exposed individuals without CRS, it was not revealed at all over the entire period (1951–1956).
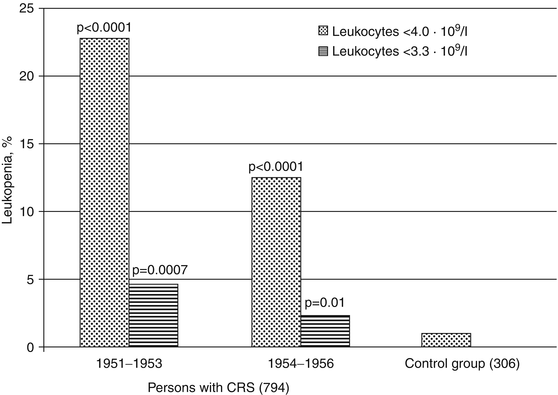

Fig. 6.2
Frequency (%) of leukopenia in the period of CRS formation (statistically significant differences in comparison to control group)
Decrease in the leukocyte number and increased frequency of leukopenia in persons with CRS in 1951–1956 (Table 6.1) was the result of reduction in the absolute neutrophils and lymphocytes in blood. In addition, persons with CRS showed “left shift” in the blood count (in some cases as much as to myelocytes). They demonstrated significant increase in the fraction of band and decline in segmented neutrophils versus the control group, represented by people of the same age. In 1951–1953 in the peripheral blood of exposed persons with CRS in comparison to unexposed individuals, a decrease in relative amount of monocytes was observed.
Table 6.1
Quantitative composition (M ± m) of leukocyte populations in peripheral blood of persons with CRS in 1951–1956
Parameter | Persons with CRS (794) | Control group (306) | |
|---|---|---|---|
1951–1953 | 1954–1956 | ||
Lymphocytes, % | 34.0 ± 0.7 | 37.5 ± 0.41 | 34.3 ± 0.6 |
Lymphocytes, ·109/l | 1.7 ± 0.05 p < 0.0001 | 2.0 ± 0.03 p = 0.0004 | 2.2 ± 0.04 |
Band neutrophils, % | 8.9 ± 0.5 p = 0.007 | 9.2 ± 0.2 p < 0.0001 | 7.3 ± 0.2 |
Segmented neutrophils, % | 46.8 ± 0.8 | 40.0 ± 0.4 p < 0.0001 | 46.4 ± 0.6 |
Neutrophils, ·109/l | 2.8 ± 0.08 p < 0.0001 | 2.7 ± 0.04 p < 0.0001 | 3.5 ± 0.06 |
Monocytes, % | 6.4 ± 0.2 p = 0.004 | 8.0 ± 0.2 | 7.3 ± 0.2 |
Eosinophils, % | 3.6 ± 0.2 | 3.5 ± 0.1 | 3.7 ± 0.2 |
Basophils, % | 0.3 ± 0.05 | 0.5 ± 0.03 | 0.28 ± 0.03 |
The increased frequency of moderate lymphopenia (<1.2 · 109/l) in persons with CRS was observed only in 1951–1953 (Table 6.2). Incidents of significant reduction in lymphocyte count in the peripheral blood (<0.8 · 109/l) in persons with CRS were registered no more than in the control group. Moderate neutropenia (<2.0 · 109/l) in persons with CRS was observed more frequently than in the individuals from the control group throughout the entire period of CRS formation which was characterized by the highest dose rate to RBM. At the same time in 1.8 % of persons with CRS in 1954–1956, when the dose rate to RBM somewhat decreased, the number of neutrophils was less than 1.3 · 109/l.
Table 6.2
Granulocytopenia and lymphocytopenia frequency (%) in the peripheral blood of Persons with CRS
Parameter | Persons with CRS (794) | Control group (306) | ||||
|---|---|---|---|---|---|---|
1951–1953 | 1954–1956 | |||||
Persons | % | Persons | % | Persons | % | |
Neutrophils, <2.0 · 109/l | 23 | 18.1 p = 0.002 | 145 | 22.3 p = 0.0001 | 22 | 7.2 |
Neutrophils, <1.3 · 109/l | 0 | 0 | 12 | 1.8 p = 0.04 | 0 | 0 |
Lymphocytes, <1.2 · 109/l | 27 | 21.2 p = 0.006 | 54 | 8.3 | 20 | 6.6 |
Lymphocytes, <0.8 · 109/l | 3 | 2.4 | 0.8 | 3 | 1.0 | |
As is seen from Table 6.3, the average erythrocyte number in the peripheral blood of persons with CRS in 1951–1956 remained normal. However, the level of hemoglobin in erythrocytes of both male and female persons with CRS during the CRS formation period was slightly lower than that in the control group. The lowest hemoglobin level and color index were observed in persons with CRS in 1951–1953. The fact that female persons with CRS showed a significant increase in the frequency of anemia (erythrocyte number was <3.7 · 1012/l, Table 6.4) presents great interest.
Table 6.3
Erythrocyte and hemoglobin level (M ± m) in the peripheral blood of persons with CRS in 1951–1956
Parameter | Persons with CRS (794) | Control group (306) | |
|---|---|---|---|
1951–1953 | 1954–1956 | 1953–1956 | |
Erythrocytes (male), · 1012/l | 4.4 ± 0.1 | 4.5 ± 0.03 | 4.6 ± 0.05 |
Erythrocytes (female), · 1012/l | 3.9 ± 0.04 | 4.2 ± 0.02 | 4.2 ± 0.05 |
Hemoglobin (male), g/l | 119.4 ± 3.1 p = 0.04 | 120.8 ± 0.9 p = 0.0015 | 126.6 ± 2.2 |
Hemoglobin (female), g/l | 103.5 ± 1.3 p = 0.0001 | 111.6 ± 0.8 p = 0.065 | 115.9 ± 2.2 |
Color index | 0.8 ± 0.03 p = 0.04 | 0.8 ± 0.01 p = 0.001 | 0.83 ± 0.01 |
Table 6.4
Frequency of erythrocytopenia and decrease in hemoglobin level (%) in persons with CRS in 1951–1956
Parameter | Persons with CRS (794) | Control group (306) | ||||
|---|---|---|---|---|---|---|
1951–1953 | 1954–1956 | 1953–1956 | ||||
Persons | % | Persons | % | Persons | % | |
Erythrocytes (male), <4.0 · 1012/l | 6 | 20.0 | 20 | 9.8 | 4 | 8 |
Erythrocytes (female), <3.7 · 1012/l | 21 | 21.0 p = 0.04 | 49 | 11.6 | 4 | 7.7 |
Hemoglobin (male), <130 g/l | 21 | 70.0 | 155 | 45.9 | 32 | 62.7 |
Hemoglobin (Female), <115 g/l | 75 | 75.0 p = 0.004 | 262 | 59.8 | 27 | 50.9 |
It should be noted that in many subjects from the control group (in 62.7 % of men and in 50.9 % of women), the hemoglobin level in erythrocytes within this timeframe was also decreased, and the mean hemoglobin level (Table 6.3) did not reach the physiological norm (Vorobyov 1985; Sokolov and Gribova 1972; Ilyin 1985). It should be mentioned that the population of the country in the postwar years showed increased frequency of hypochromic anemia associated with low animal protein and vitamins in the dietary intake (Yegorov and Bochkaryov 1954; Smirnova and Kost 1960). It is possible to assume that changes in erythroid hematopoietic lineage in chronically exposed subjects for the most part were also induced by the above mentioned non-radiation factors.
As it is seen from Fig. 6.3, the mean thrombocyte count during the CRS formation period was minimal (185.9 ± 4.7 · 109/l) in the first 3 years after the onset of exposure; it somewhat increased in the next 3 years (230.9 ± 4.2 · 109/l), but remained lower than in the control group (256.1 ± 4.7 · 109/l).
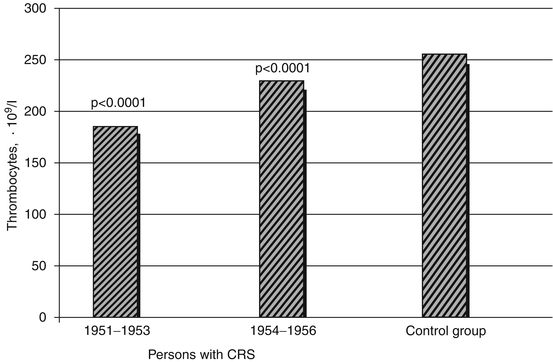

Fig. 6.3
Mean (M ± m) thrombocyte number in the blood of persons with CRS in 1951–1956 (statistically significant differences as compared to the control group are provided)
During the CRS formation period, moderate (thrombocyte count <180 · 109/l) and severe (thrombocyte count <150 · 109/l) thrombocytopenia occurred considerably more often than in the control group (Fig. 6.4). Particularly high level of thrombocytopenia was observed in the period of maximum radiation exposure (1951–1953).
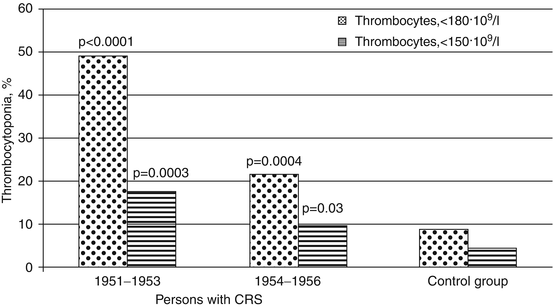

Fig. 6.4
Frequency (%) of thrombocytopenia in persons with CRS in 1951–1956 (statistically significant differences in comparison to the control group are provided)
Thus, during CRS formation period (1951–1956) decreased leukocyte and thrombocyte counts were observed in the peripheral blood of patients, resulting in the development of cytopenia. At that time persons with CRS had high leukopenia and thrombocytopenia frequency, which reached its peak in the first 3 years of exposure (1951–1953) when the highest dose rates to RBM were registered. The decline in leukocyte count in the initial period of the disease occurred due to a reduced count of mature lymphocytes and neutrophils in the blood. Reduction in the lymphocyte count in the peripheral blood of individuals with CRS occurred only in the first 3 years of exposure when the highest exposure doses not only to RBM cells but also to peripheral blood and lymphoid organs were noted. Decrease in the neutrophilic granulocyte count was more pronounced and persistent and was accompanied by the formation of the “left shift” in the leukogram. Changes in the erythroid hematopoietic lineage in persons with CRS were manifested predominantly in the decrease of hemoglobin level in the erythrocytes. The lowest hemoglobin levels were registered in 1951–1953 and occurred predominantly in women. Blood erythrocyte count in men was invariably showing normal findings, whereas certain amount of women with CRS had reduced level of erythrocytes in the peripheral blood in the same timeframe.
6.1.2 Status of BM Hematopoiesis
6.1.2.1 BM Cellular Composition in the Initial Period of CRS Formation (1954–1956)
Tables 6.5 and 6.6 show the results of laboratory examination of the RBM cellular composition in persons with CRS in the period of maximum exposure. It can be seen that in 1954–1956 in persons with CRS, the parameters characterizing the state of RBM hematopoiesis (absolute myelokaryocyte count, relative neutrophilic granulocyte and erythrokaryocyte content, and leukoerythroblastic ratio (L/E)) were comparable to those in the control group and were consistent with reference values.
Table 6.5
BM parameters in persons with CRS in 1954–1956
Parameter | Persons with CRS, M ± m (38) | Control group, M ± m (16) | |
|---|---|---|---|
Myelokaryocyte count,·109/l | 136.3 ± 17.1 (25.0–340.5) | 102.3 ± 11.7 (44–189) | 118.4 (41.6–195.0) |
Erythrokaryocyte count, % | 23.7 ± 1.2 (10.5–45.5) | 20.5 ± 1.38 (10.5–31.0) | 20.5 (14.5–26.5) |
Neutrophilic granulocyte count, % | 67.0 ± 1.2 (52.5–83.5) | 68.5 ± 1.76 (50.5–79) | 60.8 (52.7–68.5) |
Leukoerythroblastic ratio (L/E) | 3.6 ± 0.2 (1.2–8.4) | 4.2 ± 0.41 (2.2–8.4) | 3.3 (2.1–4.5) |
Table 6.6
BM cellular composition in persons with CRS in 1954–1956
Parameter | Persons with CRS, M ± m (38) | Control group, M ± m (16) | |
|---|---|---|---|
Undifferentiated blasts, % | 0.11 ± 0.06 | 0.03 ± 0.03 | 0.6 (0.1–1.1) |
М1, % | 0.74 ± 0.14 | 0.5 ± 0.1 | 1.0 (0.2–1.7) |
М2, % | 1.22 ± 0.17 | 0.7 ± 0.1 | 2.5 (1.0–4.1) |
М3 + М4, % | 18.2 ± 0.7 | 17.1 ± 1.3 | 9.6 (6.9–12.2) |
М5, % | 15.8 ± 0.6 | 17.5 ± 1.1 | 11.5 (8.0–14.9) |
М6, % | 18.1 ± 0.8 | 18.0 ± 1.1 | 18.2 (12.8–23.7) |
М7, % | 13.1 ± 0.9 | 15.8 ± 1.2 | 18.6 (13.1–24.1) |
Neutrophil maturation index (NMI) | 1.2 ± 0.07 | 1.1 ± 0.12 | 0.7 (0.5–0.9) |
All eosinophils, % | 3.7 ± 0.3 | 3.1 ± 0.5 | 3.15 (0.5–5.8) |
All monocytes, % | 0.05 ± 0.02 | 0.2 ± 0.1 | 1.9 (0.7–3.1) |
Lymphocytes, % | 4.1 ± 0.5 | 6.5 ± 0.9 | 9.0 (4.3–13.7) |
Plasmocytes, % | 0.96 ± 0.13 | 1.0 ± 0.2 | 0.95 (0.1–1.8) |
Е1, % | 0.09 ± 0.04 p = 0.015 | 0.3 ± 0.09 | 0.6 (0.2–1.1) |
Е2, % | 1.18 ± 0.14 | 0.8 ± 0.2 | 0.6 (0.1–1.2) |
Е3, % | 3.5 ± 0.3 | 3.3 ± 0.5 | 3.0 (1.4–4.6) |
Е4, % | 8.4 ± 0.8 | 8.3 ± 1.01 | 12.9 (8.9–16.9) |
Е5, % | 10.6 ± 0.6 p = 0.001 | 6.7 ± 0.9 | 3.2 (0.8–5.6) |
The results of the standard myelogram analysis allowed noting (Table 6.6) certain changes in erythroid hematopoietic lineage during the CRS formation period. Statistically significant decrease in erythroblast count (E1) and increase in oxyphilic normocyte level (E5) as compared to the control group were revealed. The above mentioned changes may indicate accelerated erythrokaryocyte maturation during the CRS formation period. Changes in the quantitative cell composition of granulocytic, monocytic, and lymphocytic lineages and plasmocytes in persons with CRS were not detected.
The frequency of hypo-/hypercellular RBM during the CRS formation period is presented in Table 6.7. Reference values of RBM parameters for apparently healthy individuals of the Urals region were used as the criteria (AFRRI 1998; Akleyev and Kisselyov 2001).
Table 6.7
Frequency of hypo- and hypercellular RBM in persons with CRS in 1954–1956, %
Parameter | Persons with CRS (38) | Control group (16) | ||
|---|---|---|---|---|
Persons | % | Persons | % | |
BM hypoplasia (myelokaryocytes <41.6 · 109/l) | 0 | 0 | 0 | 0 |
BM hyperplasia (myelokaryocytes >195.0 · 109/l) | 5 | 13.1 | 0 | 0 |
Partial granulocytopoietic BM hypoplasia (myelocytes <54 %) | 20 | 5.3 | 0 | 0 |
Partial granulocytopoietic BM hyperplasia (myelocytes >69 %) | 17 | 44.7 | 11 | 68.7 |
Partial erythropoietic BM hypoplasia (erythrokaryocytes <14 %) | 6 | 15.8 | 2 | 12.5 |
Partial erythropoietic BM hyperplasia (erythrokaryocytes >26.5 %) | 13 | 34.2 p = 0.04 | 1 | 6.2 |
Shift in L/E ratio to leukopoiesis (L/E >4.5) | 9 | 23.7 | 5 | 31.2 |
Shift in L/E ratio to erythropoiesis (L/E <2.1) | 4 | 10.5 | 0 | 0 |
Delayed maturation of neutrophilic granulocytes (NMI >1) | 31 | 81.6 p < 0.0001 | 8 | 50 |
In persons with CRS during the formation period, partial erythroid hyperplasia was observed significantly more often than in the control group. In 38.2 % of patients erythroid hyperplasia was combined with accelerated erythrokaryocyte maturation. In addition, in the majority of persons with CRS (81.6 %), a higher neutrophil maturation index was detected, which may serve as an indicator of delayed neutrophilic granulocyte maturation in the period of maximum exposure.
For the analysis of proliferative activity and maturation rate of granulocytes and erythroid cells in the RBM, the method of partial myelograms was applied, which allowed establishing the true relationship between the cellular elements in certain hematopoietic lineages. As is seen from Fig. 6.5, overall proliferative activity of neutrophilic granulocytes and mitotic index (MI) of the cells at the stage of myelocyte in persons with CRS were not significantly different from those in the comparison group.
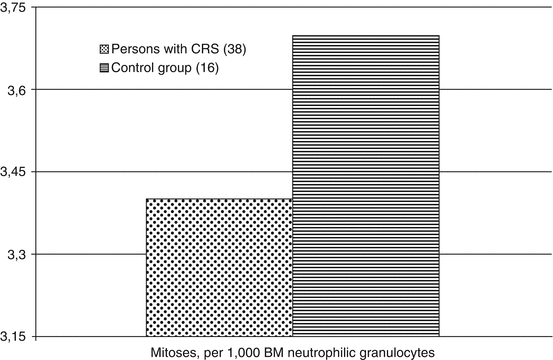

Fig. 6.5
Proliferative activity (M ± m) of BM neutrophilic granulocytes in persons with CRS in 1954–1956 (along the Y–axis, %)
Great interest presents the extension in the individual value range of the mitosis level and mitotic index (MI) of myelocytes in persons with CRS as compared to comparison group. Thus, the percentage of dividing granulocytes in the RBM aspirates of the individuals from the comparison group constantly was 1 to 6 %. This corresponds to the data concerning the mitotic activity of RBM cells in healthy people (Akleyev and Kisselyov 2001). Among persons with CRS 4 people did not have dividing neutrophils in the RBM; in 6 people the amount of mitotic granulocytes exceeded 6 %, reaching 11 %. In five persons diagnosed with CRS, the level of mitotic activity was equal to or approximate to the lower limit of the normal segmented neutrophil amount and increased neutrophil maturation index (NMI).
The results of the partial myelogram analysis depicting the nature of neutrophilic granulocyte differentiation in the period of CRS formation are presented in Fig. 6.6.
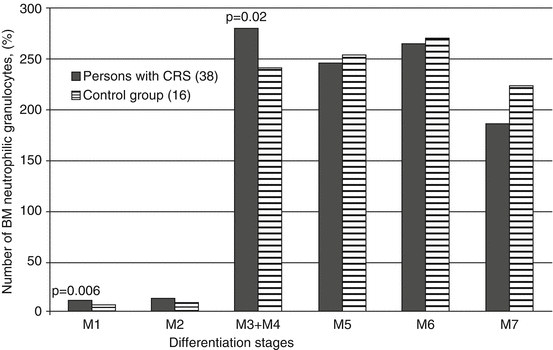

Fig. 6.6
Mean (%) RBM neutrophilic granulocyte count (of varying degree of differentiation) in the patients during CRS formation period (1954–1956)
It can be seen that persons with CRS demonstrate an increase in the proportion of myeloblasts (M1) and, especially, myelocytes (M3 and M4), of which the relative amount of immature “mother” myelocytes (M3) comprised 127 ± 8.9 % and significantly exceeded the amount of those in the control group – 83.8 ± 11.4 % (p = 0.005). Although the level of segmented neutrophils (M7) in persons with CRS was slightly lower than that in the control group, the differences were not statistically significant.
Neutrophil maturation index (NMI) in patients in CRS formation period was 1.26 ± 0.04 and did not differ significantly from that in the control group, 1.07 ± 0.08. Increased NMI (>1.0), indicating delayed RBM granulocyte maturation at the early stages of differentiation, was observed in persons with CRS more frequently than in the control group members (78.9 and 56.3 %, respectively), but the difference was not statistically significant (p = 0.09).
Thus, in the initial period of CRS formation (1954–1956), the delay in the differentiation of RBM granulocytes at the stage of “mother” myelocyte was noted. Proliferative activity of neutrophilic granulocytes in the majority of persons with CRS remained within the physiological norm.
The proliferative activity of RBM erythroid cells (Fig. 6.7) in persons with CRS during the period of the disease formation was increased as compared to the control group. In persons with CRS mean amount of mitoses in erythrokaryocytes significantly exceeded that of the comparison group. Increased proliferative activity of erythrokaryocytes (>19 mitoses per 1,000 cells) also occurred significantly more frequently (p = 0.006) in persons with CRS (36.8 %). Out of 14 patients with increased mitotic activity of erythrokaryocytes, 11 individuals had it in combination with increased fraction of oxyphilic normocytes (greater than 5.6 % of cells). The maximum amount of erythrokaryocyte mitoses in patients during the period of CRS formation reached 33 %. In the control group the number of mitoses was 7–19 %, which is consistent with the literature data (Sokolov and Gribova 1972; Ilyin 1985). Increase in proliferative activity of erythrokaryocytes in persons with CRS was mainly determined by an increase in the division rate of basophilic (E3) and polychromatophilic (E4) normocytes.
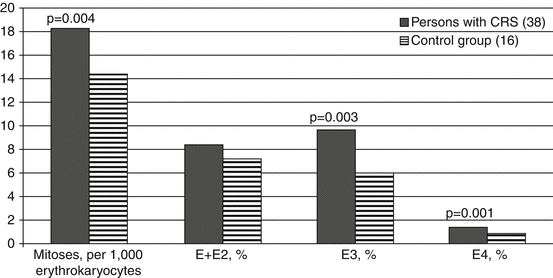

Fig. 6.7
Proliferative activity (M ± m) of erythrokaryocytes in persons with CRS in 1954–1956
Erythrokaryocyte differentiation in the initial period of CRS formation also had some peculiar features in comparison to unexposed people (Fig. 6.8). The majority of persons with CRS showed a relative increase in the number of oxyphilic normocytes (E5) against the decline in the amount of erythroblasts (E1) and polychromatophilic normocytes (E4). Erythroblast maturation index (EMI) in persons with CRS did not differ from that in the control group (0.84 ± 0.01 and 0.82 ± 0.01, respectively).
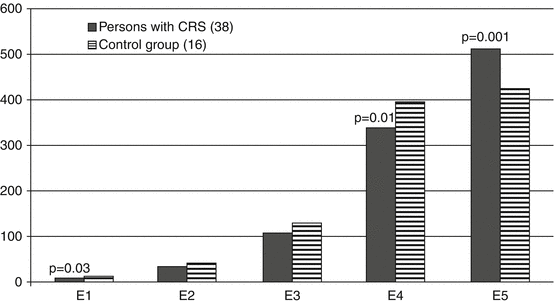

Fig. 6.8
Number (%) of erythrokaryocytes of varying degrees of differentiation in patients during the CRS formation period (1954–1956)
According to the partial myelogram data in five persons with CRS, an increase in the total amount of erythrokaryocytes was observed (>26.5 %), indicating the hyperplasia of RB erythroid lineage. Thus, during the CRS formation period, both increase in proliferative activity and accelerated maturation of cells were observed in the erythroid RBM lineage.
The character of changes in the RBM was compared to that in the peripheral blood of the same patients in the period of CRS formation; the results testified to their consistency. Changes in RBM and in the blood primarily affected granulopoiesis. In this period they demonstrated decrease in leukocyte count (p = 0.06) down to 5.3 ± 0.2 · 109/l on the average (minimum value reached 2.7 · 109/l), in neutrophils (p = 0.025) to 2.5 ± 0.1 · 109/l (minimally to 1.1 · 109/l). The relative amount of segmented neutrophils decreased to 36.8 ± 1.6 % on the average, and in certain individuals down to 15.5 %, which significantly (p = 0.02) differed from the data of the control group. Erythrocyte count in all the patients was within the limits of physiological norm. It is possible to assume that the stability of the erythrocyte count in blood during the initial period of CRS formation was provided by sufficiently effective compensatory shifts, such as increased rate of proliferation and differentiation of erythroid cells in the RBM. Quite often even erythroid hyperplasia was observed. The mechanisms of the reduction in hemoglobin level and in erythrocyte count in patients are not completely clear. Alimentary factor can be considered as the leading factor in reducing the hemoglobin level in persons with CRS which in this period was exacerbated by frequent hypoacidic state of the stomach. Manifestations of hypochromic anemia were the most pronounced in women because of physiological menstrual blood loss. As it has already been noted in Chap. 5, women with CRS menstrual disorders such as polymenorrhea and hypermenorrhea were registered more often.
One reason for the segmented neutrophils reduction in the peripheral blood may be delayed neutrophilic granulocyte maturation in the RBM, which was observed in persons with CRS in the early period. Granulocyte count at the terminal stage of differentiation in the RBM of persons with CRS did not significantly decrease, whereas mean neutrophilic granulocyte count (including segmented neutrophils) in the peripheral blood was reduced. In this regard, one can think of functional deficiency of mature granulocytes in persons with CRS. Analysis of hematopoiesis in some patients showed that the segmented neutrophil count in the RBM and peripheral blood, in spite of the increased proliferation of progenitor cells, remained decreased. One can assume that the compensatory mechanisms in the system of granulocytopoiesis during the disease formation period were not sufficiently effective for the mature granulocyte repopulation in the peripheral blood.
6.1.2.2 Myelokaryocyte Abnormalities in the Period of CRS Formation (1954–1956)
On the basis of the partial myelogram analysis in persons with CRS at the early stage of the syndrome formation, aberrant cells were registered. In the process of cell division, primarily three types of abnormalities were observed: “clumped mitosis” or chromosome clumping, interchromosomal bridges, and chromosome fragments. According to limited and controversial literature data, chromosome clumping is a form of anaphase chromosome aberrations and can be induced by disorders mitotic apparatus (Fliedner et al. 1961). As a result, the chromosomes do not align along the equator of the cell as if “sticking” to each other (“chromosomal stickiness”), which subsequently leads to nonuniform arrangement into daughter cells. This abnormality is not considered potentially lethal to the cells but its significance for the future of the cells is not known. Chromosome fragments, according to TM Fliedner, appear during late metaphase or telophase when chromosomes are not attached to the spindle and are identified in the cytoplasm as free chromosomes. Experimental studies have shown that such chromosome fragments are still able to synthesize DNA. Such chromosomal fragments in interphase cells have acquired the name of karyomere. Interchromosomal bridges were identified when one chromosome stretched to the other chromosome in one of the newly formed nuclei.
The patients in the CRS formation period had an increased (p < 0.001) level of “clumped mitoses” in granulocytic and erythroid cells of the RBM as compared to unexposed individuals (Fig. 6.9). At the same time in persons with CRS, the frequency of clumped mitoses in erythroid cells was significantly higher than that in neutrophilic granulocytes.
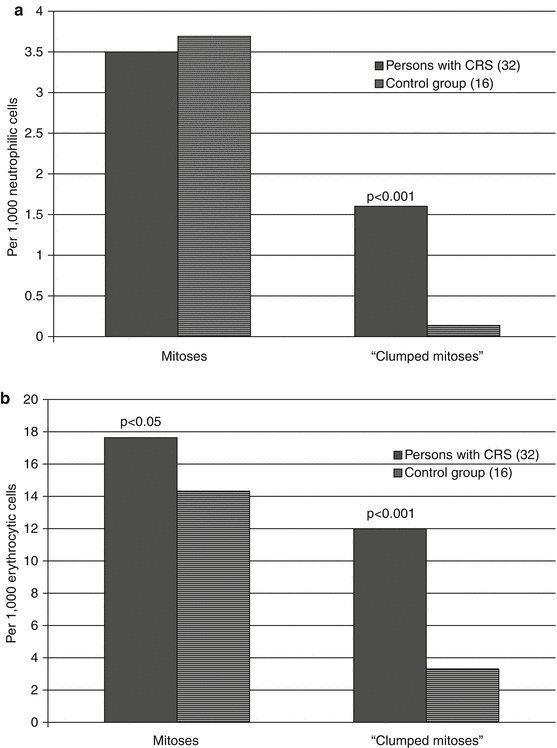

Fig. 6.9
The level of “clumped mitoses” in the RBM cells of persons with CRS in 1954–1956. (a) Granulocytopoietic lineage, (b) erythroid lineage (statistically significant differences as compared to the control group are provided)
Interchromosomal bridges as opposed to “clumped mitoses” result from severe chromosome damage and can cause reproductive cell death, i.e., are potentially lethal abnormalities. They were registered quite rarely and only in persons with CRS during the disease formation period. Interchromosomal bridges have been detected in RBM erythroid cells in five persons with CRS who had doses to RBM exceeding 1.0 Gy.
In interphase cells of persons with CRS during the syndrome formation period, several types of chromosome aberrations were identified. The frequency of RBM granulocytic and erythroid cells with abnormalities at the interphase stage in persons with CRS was significantly higher than that in unexposed individuals (Tables 6.8 and 6.9).
Table 6.8
Frequency (M ± m) of interphase abnormalities of RBM neutrophilic granulocytes in CRS formation period (1954–1956)
Abnormalities/1,000 RBM neutrophils | Persons with CRS (32) | Control group (16) |
|---|---|---|
Binuclear cells | 0.3 ± 0.11 | 0.2 ± 0.10 |
Giant cells | 0.5 ± 0.26 | 0.1 ± 0.06 |
Fragmentosis of the nucleus | 2.1 ± 0.64 p < 0.01 | 0.2 ± 0.19 |
Karyolysis | 0.3 ± 0.29 | 0 |
Potentially lethal abnormalities | 3.4 ± 0.72 p < 0.001 | 0.5 ± 0.2 |
Pycnosis of the nucleus | 6.4 ± 2.01 p < 0.01 | 0.4 ± 0.26 |
Total | 9.8 ± 2.30 p < 0.001 | 0.9 ± 0.29 |
Table 6.9
Frequency (M ± m) of interphase abnormalities in RBM erythroid cells in CRS formation period (1954–1956)
Abnormalities/1,000 RBM erythroid cells | Persons with CRS (32) | Control group (16) |
|---|---|---|
Interchromosomal bridges | 0.2 ± 0.08 | 0 |
Binucleated cells | 5.9 ± 0.66 | 4.7 ± 0.63 |
Karyomere | 2.6 ± 0.41 p < 0.001 | 0.8 ± 0.21 |
Potentially lethal abnormalities | 8.5 ± 0.82 p < 0.01 | 5.5 ± 0.66 |
Cytoplasmic bridges | 20.3 ± 2.29 p < 0.001 | 3.8 ± 0.75 |
Pycnosis of the nucleus | 0.13 ± 0.09 | 0 |
Total | 30.0 ± 2.29 p < 0.001 | 9.1 ± 0.86 |
The spectrum of abnormalities detected at the interphase stage in neutrophilic granulocytes and erythroid cells of the RBM was a little different. In neutrophilic granulocytes in persons with CRS karyolysis, binuclear and giant cells were observed, which are potentially lethal for the cell. In erythroid cells of the RBM in persons with CRS, such potentially lethal abnormalities as interchromosomal bridges, binuclear cells, and presence of karyomere were most frequently registered. Nonlethal abnormalities, detected in the RBM cells of persons with CRS during the period of maximum radiation exposure, include cytoplasmic bridges and pycnosis of the nucleus. Pycnosis of nucleus is a characteristic of early and reversible stage of cell apoptosis associated with chromatin condensation, whereas karyolysis indicates irreversible degradation of the cells.
The other types of interphase abnormalities were presented by binuclear and multinucleated cells. They were registered both in erythrokaryocytes and granulocytes of the RBM in persons with CRS. Giant cells were most often detected among granulocytes, when segmented granulocyte with two and more sets of nuclei was identified. These cells appear as the result of impairment of the mitotic process and subsequent cell maturation. There were also observed erythroblasts reaching the size of proerythroblasts or macroblasts but with cytoplasm at the polychromatophilic or orthochromatophilic stage of maturation. This type of abnormality, also associated with mitosis, resembles “giant cells.”
As it has been already mentioned, karyomere represents a micronucleus in the cytoplasm which is able to synthesize DNA. It is formed by the chromosomes that exit the mitotic process and then function as micronucleus in the cytoplasm.
As the results presented in Table 6.8 show in patients in the period of CRS formation not only the total number of aberrant neutrophilic cells (p < 0.001), but the level of cells with fragmentosis of the nucleus, which is considered to be a lethal event for the cell, was significantly increased (p < 0.01). Most often in persons with CRS cells with fragmentosis and pycnosis of the nucleus were observed, and cells with karyolysis of the nucleus were generally detected only in persons with CRS.
The total frequency of all and potentially lethal interphase abnormalities, especially cells with karyomere in erythroid cells of the RBM in persons with CRS, was also increased as compared to the control group (Table 6.9). Of all the erythroid cell abnormalities (p < 0.001), cells interconnected by cytoplasmic bridges were most often registered (Fig. 6.10). Persons with CRS also demonstrated an increased level of erythroid cells with micronuclei. It is important to note that cells with interchromosomal bridges and pycnosis of the nucleus were not observed in the RBM of unexposed persons.
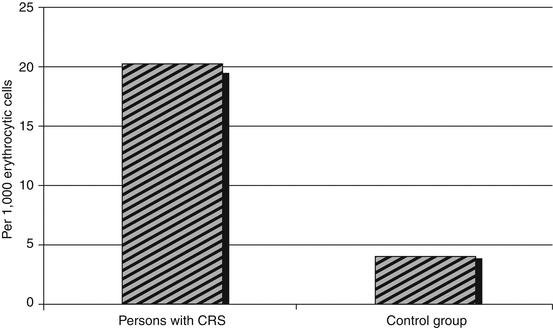

Fig. 6.10
The level of erythroid cells connected by cytoplasmic bridges in persons with CRS (1954–1956)
The comparison of the mitotic cell activity of erythroid and granulocytopoietic lineages and the number of cells with potentially lethal aberrations presents great interest as their ratio testifies to the effectiveness of cell repopulation in patients at the initial stage of CRS. As it can be seen from Fig. 6.11, the proliferative activity of the RBM neutrophilic granulocytes in persons with CRS did not differ from that in the control group, whereas the mean number of cells with lethal aberrations was significantly higher than that in the control group and was comparable with the mean number of normal mitoses. Thus, granulocytopenia in the peripheral blood during the CRS formation period could also be due to the delayed differentiation of RBM granulocyte at the stage of myelocyte, by a significant increase in the frequency of lethal damage and abnormal mitoses without a significant increase in the proliferative activity of granulocytes.
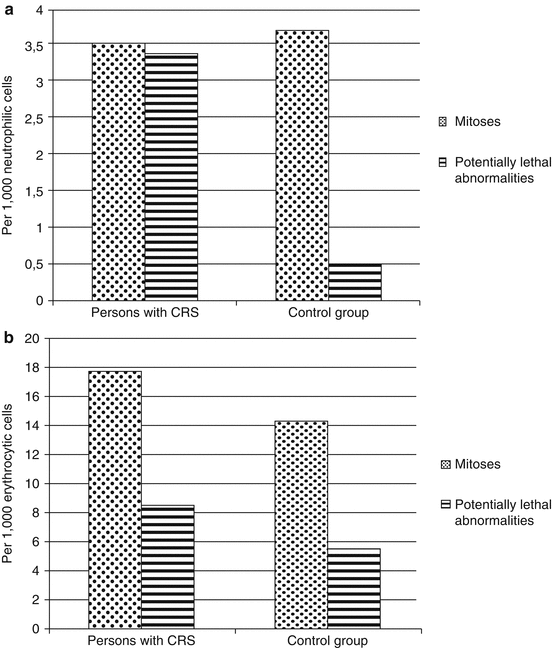

Fig. 6.11
Proliferative activity and the level of cells with potentially lethal abnormalities in persons with CRS (1954–1956). (a) Neutrophilic granulocytes, (b) erythroid cells (statistically significant differences as compared to the control group are presented)
As it is seen in Fig. 6.11, although in persons with CRS mean number of cells with potentially lethal abnormalities in erythroid lineage of the RBM was increasing relative to the control group, their mitotic activity also increased; hence the overall balance between cell alteration and repopulation in persons with CRS was preserved, which allowed maintaining sufficient level of erythrocytes in the peripheral blood.
Thus, a comparative analysis of the RBM hematopoiesis state in persons with CRS during the formation period (1954–1956) and in patients with the exposure dose not exceeding 5 mGy/year made it possible to note the following peculiarities:
In patients at the early stages of CRS, no cases of marked RBM hematopoiesis inhibition were observed.
Major changes in the RBM were detected in granulocytic and erythroid lineage of the RBM.
Distinct acceleration of the erythroid cell maturation accompanied by the increase in their proliferative activity was noted. The comparison of the RBM hematopoiesis and peripheral blood data indicates the adaptive nature of these changes aimed at maintaining the normal level of the erythrocytes in the peripheral blood.
During the CRS formation period, delayed maturation of the cells at the early stages of differentiation was observed in the granulocytic lineage. Proliferative activity of the neutrophilic granulocytes was not significantly changed. At the same period a decrease in the absolute neutrophil count due to reduction of mature segmented granulocytes was observed in the peripheral blood.
Increased levels of aberrant neutrophilic and erythroid cells in the RBM both at the stage of mitosis and at the interphase were registered. It is assumed that the compensatory proliferation of the RBM granulocytes is insufficient to compensate for the damage and delayed maturation of RBM granulocytes. Granulocytopenia in persons with CRS at the early stages when there is no significant reduction of mature granulocytes in the RBM may indicate functional impairment and reduced life expectancy of the mature segmented neutrophils.
6.2 Dynamics of Hematopoiesis Recovery in Persons with CRS
6.2.1 Peripheral Blood Cell Composition
During the period from 1957 to 2001, cellular composition of the peripheral blood was evaluated in 934 people who were initially diagnosed with CRS (Akleyev and Varfolomeyeva 2007a, b


Stay updated, free articles. Join our Telegram channel

Full access? Get Clinical Tree


