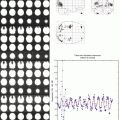
Fig. 1
EEG-fMRI analysis stream in epilepsy. Panel (a) shows on the left side the artifact-corrected in-scanner EEG of a 19-year old patient with suspected left mesial temporal lobe epilepsy (MTLE). Shaded areas show to occurrences of sharp waves. The right side shows the corresponding scalp topography with a peak negativity on the left fronto-temporal side. Panel (b) shows the construction of statistical predictors, either using temporal independent component analysis (tICA, red) or by generating manual events (blue) that indicate the time-point of sharp waves. After convolution with a hemodynamic response function (HRF), the expected brain responses can be modeled (blue and red traces running from 0 to 1020 seconds in this example). Panel (d) shows the design matrix of a general linear model built using either of the predictors from panel (c). The model also incorporates predictors from movement parameters and their derivatives, and noise signals from white matter and cerebrospinal fluid. Each column of the matrix represents one predictors, each row one time-point (i.e., BOLD image). Panel (e) shows the positive (hot colors) or negative (cool colors) BOLD-correlates of the tICA-predictor projected onto the patients anatomy. Strong signal increases are seen in the left hippocampus and temporal pole, concordant with the patients suspected MTLE
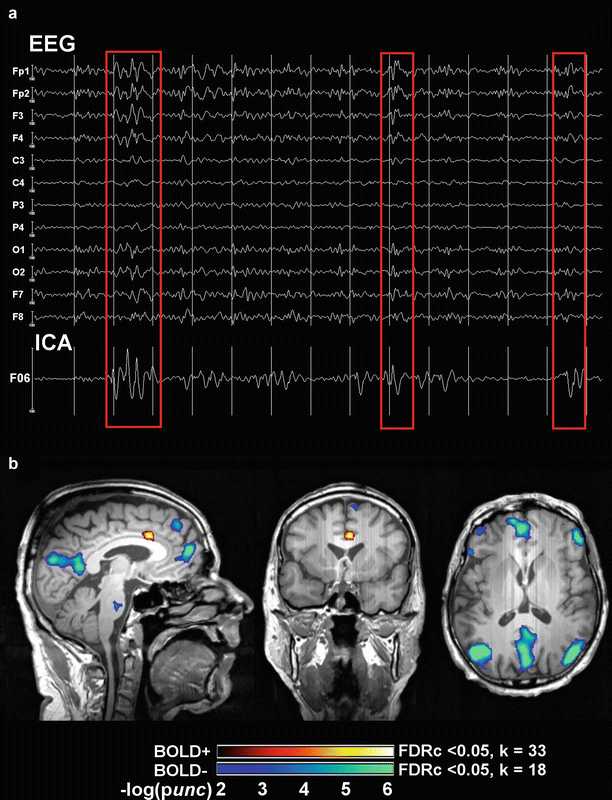
Fig. 2
Example of EEG-fMRI analysis and BOLD correlates of spike-wave discharges in a patient with IGE. Panel (a) shows 14 s of artifact-corrected in-scanner electroencephalogram (EEG) and its associated independent component analysis (ICA) factor that codes for generalized spike wave (GSW) discharges (F06). Red squares mark three time points (seconds 3, 9, and 13) that contain frontally predominant (Fp1, Fp2) GSW discharges. Note the corresponding amplitude oscillations in F06. Panel (b) shows the statistical parametric maps (SPMs) of functional activations (BOLD+) and deactivations (BOLD−) linearly correlated to F06 (and therefore GSW), overlaid on an anatomical scan (neurological convention). Significant signal increases are seen in the anterior cingulate cortex (hot colors), and widespread decreases in the precuneus, medial prefrontal cortex, inferior parietal, and dorsolateral prefrontal cortices bilaterally (cool colors). SPMs have an uncorrected (unc) peak-level threshold at p < 0.001 (= −log(2)) and a corrected false-discovery rate cluster-level (FDRc) threshold at p < 0.05 (k, critical cluster size)
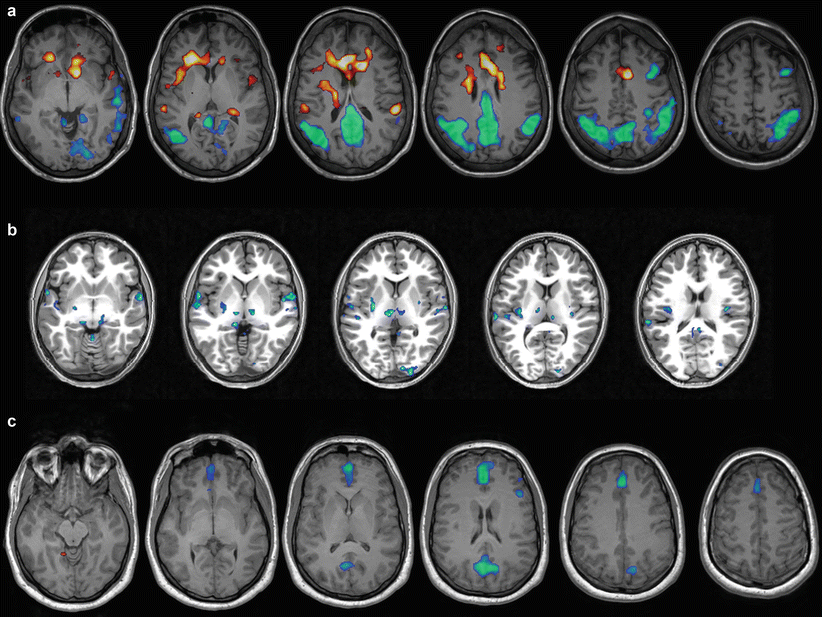
Fig. 3
Examples of the interindividual variability in BOLD correlates of generalized spike-wave discharges in patients with IGE. Hot colors indicate BOLD-signal increase cool colors BOLD-signal decrease. All images are in neurological convention (left hemisphere is on the left side of the image). Panel (a) 29-year old patient with generalized seizures. Strong signal increases are seen in the anterior cingulate cortex, decreases in the precuneus and parietal lobes bilaterally. Panel (b) 15 year old patient with brief visual symptoms followed by generalized seizures. Bilateral BOLD-signal decreases are seen in the thalamus, and unilateral decrease in the right occipital pole. Panel (c) 23-year old patient with generalized seizures. BOLD-signal decreases localize onto the anterior cingulate cortex and precuneus bilaterally
Besides these more observational case series, there have been only a few controlled experimental studies in patients with absence seizures (AS) simultaneously comparing GSW on EEG, fMRI, and behavioral changes. These studies aimed at the second goal mentioned above, i.e., correlating attentional states with GSW discharges and their metabolic correlates. Berman et al. investigated these changes in attention in a group of children suffering from AS using simultaneous EEG-fMRI and to types of tasks, a continuous performance task (CPT) that required sustained attention to deviant letter stimuli, and a simple repetitive motor task (Berman et al. 2010). CPT performance dropped significantly more than performance on the motor task during AS (as recorded with the in-scanner EEG), and this behavioral impairment was associated with the core corticothalamic BOLD network found in the studies mentioned above and seen in our examples. This study was the first to establish a link between behavior and simultaneous EEG-fMRI, thus indicating that all areas visualized in observational studies with IGE patients (see above) are not a innocuous epiphenomenon but might have important effects on cognitive functioning (although this must not always be the case, e.g., Moeller et al. (2010b)).
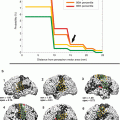
A concomitant study by the same group analyzed the temporal dynamics of the BOLD response to IGE by shifting the HRF from 16 s before to 24 s after the onset of AS in a large cohort (n = 88) of AE patients (Bai et al. 2010). They found bilateral BOLD increases in medial and orbital frontal areas as early as 14 s before AS onset, followed by a late increase in the thalamus (10 s after AS onset) that was paralleled by widespread BOLD decreases in the DMN and bilateral frontoparietal networks that outlasted the AS for more than 20 s. Moreover, they found that HRF in selected regions (e.g., the thalamus or medial and orbital frontal cortex) was highly variable and did not necessarily conform to a “canonical” HRF. As discussed by Bai et al., these results suggest that not all events accompanying AS are captured by scalp EEG and that there might be additional intra- and intersubject variability in the neurovascular coupling between electrical and metabolic activity in IGE that is still poorly understood and cannot be captured with conventional HRF modeling (Bai et al. 2010). Benuzzi et al. analyzed the intersubject variability of BOLD dynamics from 15 before to 9 s after the GSW discharges in a mixed group of 15 adolescents and adults with different IGE syndromes (Benuzzi et al. 2012). At the group level, DMN regions (precuneus, bilateral inferior parietal cortex) as well as the bilateral dorsolateral prefrontal cortex showed transient BOLD increases between 12 and 6 s before GSW discharges, and then an immediate BOLD decrease from GSW starts to ~6 s afterward. The thalamus (together with cerebellum and anterior cingulate cortex) was most active at GSW initiation for a short window of time (roughly 3 s in their analysis). Of note, the individual patterns of the temporal evolution of these changes were highly variable, with some cases showing either very early or very late decreases in the DMN, either short or prolonged increases in the thalamus and different degree of overlap between activated and deactivated areas (Benuzzi et al. 2012). Figure 3 shows an analysis of the temporal evolution of the BOLD response in IGE.
Finally, two recent reports have analyzed the effective connectivity within the thalamocortical BOLD-GSW network, i.e., the dynamic couplings and influences of brain regions on each other (Friston 2011). This is accomplished by using dynamic causal modeling, an advanced biophysical modeling framework that allows to infer (hidden) neural activity based on (observed) BOLD responses (Friston et al. 2003). In one study, Vaudano et al. have found that the precuneus has a “permissive” or “gate-keeper” role in GSW generation within the thalamocortical network (Vaudano et al. 2009), which harks back to the idea that a cortical contribution is indeed necessary (see above). Deaunizeau et al took this observation one step further and could show that spotaneous BOLD-signal fluctuations modulate different frequency bands of the EEG, as proposed theoretically by Kilner et al. (2005). This indicates a future area of research, where not only the spatial profiles but also the temporal dynamics of EEG and fMRI events could be used to analyze epileptiform activity.
Box 1
Key Results of Combined EEG-fMRI in Idiopathic Generalized Epilepsies
Typical pattern of medio–dorsal thalamic activation and DMN deactivation (bilateral precuneus, inferior parietal cortices, and medial prefrontal cortices) correlated with ictal and interictal GSW discharges across multiple syndromes.
Complex temporal dynamics: early DMN activation, late persisting DMN deactivation, and mostly short, fast thalamic activation
High interindividual spatial variability: multifocal versus symmetric cortical involvement and differential activation of dorsal prefrontal cortices
High interindividual temporal variability: temporally separated versus overlapping DMN activation changes, often “non-canonical” hemodynamic responses
Involvement of multiple cortico–subcortical areas outside the DMN-thalamus axis: bilateral frontal, sensorimotor, and striato-thalamic networks
Clinical significance: GSW-correlated BOLD changes associated with simultaneous impairment of attention in IGE patients
In sum, simultaneous EEG-fMRI has produced a rich set of novel findings on the functional correlates in IGE. A common theme is the involvement of thalamocortical functional networks in ictal and interictal GSW and a still incompletely understood intersubject variability in the spatial patterns and temporal dynamics of these networks. This variability is not only due to the different and sometimes heterogeneous populations used, since it was also found in more tightly defined subgroups, e.g., children with AS (Bertram 1997; Moeller et al. 2008a; Bai et al. 2010). Therefore, it seems reasonable to assume that it might be biologically meaningful, indicating that GSW, although relatively stereotypical on scalp EEG, might not reflect a unitary phenomenon but a complex set of brain network interactions. Simultaneous EEG-fMRI could thus possibly serve as biomarker for different IGE subtypes (even within syndromes that have been thought to be rather homogeneous on clinical grounds). Much work is needed in this regard.
3.2 Simultaneous EEG-fMRI in the Presurgical Workup of Pharmacoresistant Focal Epilepsies
Simultaneous EEG-fMRI can assist with the presurgical evaluation of patients that suffer from a (potentially) surgically remediable syndrome. This is clinically important, as roughly 30 % of epilepsy patients have or develop pharmacoresistant disease (Kwan and Brodie 2000), i.e., seizures that cannot be controlled after adequate treatment with two antiseizure medications (as defined by the current consensus definition of the International League Against Epilepsy (Kwan et al. 2010). As mentioned in the introduction, epilepsy surgery can be very effective in this group. The first randomized controlled trial on epilepsy surgery has shown that for a carefully selected cohort of adult mesial temporal lobe epilepsy (MTLE) patients, the number needed to treat (NNT) to render one patient free of seizures that impair awareness at 1 year after surgery is two, and the NNT to render one patient free of any seizures is three (Wiebe et al. 2001). To use an illustrative example provided by Wiebe (2004), compare these results to carotid endarterectomy, the widely used standard for symptomatic carotid stenosis, with an NNT of 15 to avoid one disabling ischemic stroke or death in patients with severe stenosis over a follow-up of 2–6 years (Cina et al. 2000). No surgical complications occurred in the randomized controlled trial, whereas others have reported that surgical complications occur in 11 % of patients and that 3 % of patients sustain new, permanent neurological deficits (Engel et al. 2003). This is out-weighted by the fact that successful surgery can reduce the risk of premature death roughly twofold (Bell et al. 2010) and, according to some reports, even lead to low mortality rates that do not differ from the general population (Vickrey et al. 1995; Sperling et al. 1999). A recent study by De Tisi et al. followed 615 adult epilepsy surgery patients over a median follow-up of 8 years and found that a favorable long-term outcome was achieved in about 65 % of cases, where 51 % of patients showed immediate and sustained seizure freedom and an additional 14 % achieved seizure freedom after a complex process of remission and relapse (de Tisi et al. 2011). Some 25 % can be weaned of medication and can be considered as cured, but 40 % of operated epilepsy patients still require antiseizure drugs (ASD) to maintain seizure freedom (Schmidt et al. 2004; Tellez-Zenteno et al. 2005). However, large-scale retrospective studies in MTLE patients (n = 376, 18 years of follow-up) have shown that even if ASD are continued, roughly 19 % of patients in this category can safely switch from poly- to monotherapy or reduce preoperative monotherapy dosages (Wieser and Hane 2003, 2004). Plausibly owing to seizure freedom and decreased ASD side effects, quality of life improves significantly in operated patients, even if they suffer from postoperative memory decline (Langfitt et al. 2007b). As a consequence, utilization of health-care resources and health-care costs drop in the first 2 years after surgery (Langfitt et al. 2007a), and long-term comparisons of medical and surgical costs between operated and non-operated pharmacoresistant epilepsy patients indicate that epilepsy surgery becomes cost-effective in as little as 7–8 years (King et al. 1997; Langfitt 1997), although this estimate can be as long as 35 years, depending on the precise implementation of the analysis (Platt and Sperling 2002). Overall, these findings indicate that epilepsy surgery can be highly beneficial in terms of providing relief from individual suffering, prevent further disability, and reduce the health-care costs of society as a whole (Begley et al. 2000). Pharmacoresistant patients should therefore be identified and treated with surgery as early as possible (Kwan and Brodie 2000; Engel et al. 2012). There is still a delay of 18–23 years between development of pharmacoresistance and referral to presurgical evaluation, although recent data also suggest that the trend might be slowly (but modestly) reversing (Haneef et al. 2010).
For epilepsy surgery to be successful, the tissue to be resected and its spatial relationship to functionally relevant (eloquent) cortex have to be identified with precision. This goal requires a synthesis of data from multiple clinical and paraclinical sources of information, i.e., patient history, seizure semiology, neuropsychological examination, ictal and interictal scalp and/or intracranial EEG, and functional and structural neuroimaging (Rosenow and Luders 2001). Whereas standard fMRI with motor, sensory, or cognitive paradigms is used to map eloquent cortex, simultaneous EEG-fMRI is used as an additional tool to assist in mapping the epileptogenic zone (EZ), i.e., “the minimum amount of cortex that must be resected (inactivated or completely disconnected) to produce seizure freedom” (Luders et al. 2006). As mentioned in the introduction to this chapter, the EZ is thought to overlap with the seizure onset zone (SOZ) and the irritative zone (IZ) that generate seizures and IED, respectively. The IZ can thus serve as a proxy of the SOZ and the EZ for clinical purposes, although the different zones must not necessarily be concordant (Luders et al. 2006). Every neuroimaging technique used in epileptology has its strengths and weaknesses when trying to map and disentangle this complex topography. Scalp EEG, for instance, has a very high temporal resolution but is relative insensitive to deep sources of epileptiform activity within the EZ. PET and SPECT require invasive application of radioactive tracers. Structural MRI has a high spatial resolution and can indentify even subtle cortical epileptogenic lesions, but these must not overlap with either the IZ or SOZ. Simultaneous EEG-fMRI seems advantageous in this regard, as it can show the metabolic correlates of deep-lying IZs (via IED on scalp EEG) and depict the relationship between IED focus and epileptogenic lesion (via coregistration with high-resolution anatomical images). This might be especially important in those cases where mapping of the different zones is complicated or equivocal, e.g., in patients with the SOZ outside the temporal lobes, in those with multifocal lesions, and in those where no epileptogenic lesion can be identified by standard MRI protocols (Tellez-Zenteno et al. 2005; Jeha et al. 2007; Bien et al. 2009). A few studies have acquired simultaneous EEG-fMRI during the (fortuitous) occurrence of focal seizures (Sierra-Marcos et al. 2013), but safety concerns, movement artifacts, and the unpredictable nature of seizures limit the clinical applicability of this technique in our view.
There are now a number of clinical observational studies that indicate that local BOLD responses, as mapped with simultaneous EEG-fMRI, co-localize with the SOZ at the lobar level. Krakow et al. investigated 10patients with focal pharmacoresistant epilepsies (Krakow et al. 1999). BOLD correlates to IED could be found in 6, and in all of them the BOLD correlate was close to the SW maximum in the EEG. The largest study to date includes 63 consecutive patients (59) investigated with frequent IED (Salek-Haddadi et al. 2006). Concordant or approximately concordant BOLD correlates could be found in 23 patients (37 %); 25 had no IED and 11 no BOLD correlates, despite the presence of IED. This low yield might have had technical reasons since the study was performed at 1.5 T with spike triggering, and higher field strengths (Federico et al. 2005) as well as continuous imaging (Al-Asmi et al. 2003) lead to better results. Despite this shortcomings, this study revealed a few interesting results. For instance, there was a pattern of precuneal deactivation in seven patients, reminiscent of the patterns found in IGE (see above). Also, the authors found that BOLD activations showed in general a better concordance with the presumed SW focus than BOLD deactivations (the reason of which is still unknown). Finally, they found that most HRF had physiological waveforms, indicating that “standard” modeling approaches might be sufficient for clinical purposes. Kobayashi et al. investigated 35 patients with temporal lobe epilepsy and found concordant responses in 83 % (Kobayashi et al. 2006). Deactivations were again identified in roughly 50 % of cases. Interestingly, these authors found 16 patients with neocortical BOLD correlates of which 12 had concordant bilateral temporal lobe clusters, indicating that simultaneous EEG-fMRI does not only reveal EZ but can depict parts of the complete epileptogenic network. In a follow-up study, these authors found that this network extended not only to bilateral mesial temporal structures but also to interconnected areas such as the basal ganglia, inferior insula, and lateral temporal gyri (Kobayashi et al. 2009). Of note, contralateral temporal lobe BOLD activity peaked later in comparison to the ipsilateral activity. Thus, these results demonstrate that simultaneous EEG-fMRI, despite the low temporal resolution of the latter, might also show aspects of the temporal dynamics of SW-associated functional networks.
One important question as to the clinical utility of simultaneous EEG-fMRI is how closely it matches with two important gold-standard measures: results from intracranial EEG and postsurgical outcome (Zhang et al. 2012). This question has yet to be addressed prospectively, but there are several reports that provided interesting data on this subject. Seeck et al. provided an early case study of a patient in which simultaneous EEG-fMRI activity was concordant with scalp EEG source analysis and electrocorticography (ECoG) (Seeck et al. 1998). In the abovementioned case series by Krakow et al. in which six patients showed BOLD correlates of focal SW, 1 localization was also confirmed by ECoG (Krakow et al. 1999). Laufs et al. also found excellent concordance of simultaneous EEG-fMRI in one patient with a right frontocentral SOZ (Laufs et al. 2006). Interestingly, this patient did not show clear IED during the combined recording, and a focal abnormality of the EEG (localized delta activity) was used to derive the fMRI regressor. However, mixed results were reported in two of the largest studies to date by Bagshaw et al. (n = 4) and Benar et al. (n = 5) (Bagshaw et al. 2004; Benar et al. 2006). Both validated the findings of simultaneous EEG-fMRI against stereotaxic intracerebral EEG and found concordant BOLD activations to focal SW in 3/4 and 4/5, respectively, but also discordant BOLD correlates in one case per study.
To further clarify these issues, three recent studies have specifically asked whether simultaneous EEG-fMRI can add clinically useful information to the presurgical workup (Zijlmans et al. 2007; Moeller et al. 2009). Ziljmans et al. reviewed 29 patients with simultaneous recordings that had been rejected from surgery due to insufficient certainty in focus localization or multifocality. In their study, new prospects for presurgical reevaluation could be opened in 4, and two underwent intracranial studies that confirmed EEG-fMRI results. Moeller et al. studied another difficult group, patients with non-lesional frontal lobe epilepsy. They found BOLD correlates in 8/9. In two patients that were operated, subtle cortical abnormalities just adjacent to the EEG-fMRI correlates could be identified. A recent study by An et al. in 35 consecutive patients undergoing resective surgery investigated whether the peak of the BOLD response in the preoperative EEG-fMRI study matched the resected volume or not. Postsurgical seizure control was best in those patients were the EEG-related BOLD response was fully concordant with the resected area, whereas in patients with fully discordant BOLD responses, only 1 of 11 reached seizure freedom. This translated into a positive predictive value of the maximal EEG-fMRI response of 70 % and a negative predictive value of 90.9 %. This indicates that EEG-fMRI might be able to better identify those cases where surgery might not be successful.
In sum, the studies reviewed above testify to the complexity of results that can be obtained with simultaneous EEG-fMRI. The number of promising results predominates, and the fact that simultaneous recordings might be beneficial especially in difficult cases is encouraging. However, the fact that mapping epileptogenic tissue with simultaneous EEG-fMRI still mainly depends on the detection of IED is an important limitation. Also, adding to the complexity already afforded by the different overlapping zones (or rather networks and network components), the predictive value of IED to localize the SOZ is not always easy to determine and seems to depend on the neuroanatomical localization of the EZ and the pathophysiology of the underlying disease. For temporal lobe epilepsies, data indicate that IED on scalp EEG indeed predicts the SOZ correctly in ~90 % of cases (Blume et al. 1993, 2001), but for extratemporal sites, e.g., the frontal or parietal lobes, the predictive power of IED is lower, as only ~20 % of patients exhibits unilateral, clearly focal IED (Holmes et al. 2000). Thus, techniques that allow to map the EZ even without spikes are an important current focus of further research in EEG-fMRI (Rodionov et al. 2007; Grouiller et al. 2011). This could lead to an important new goal for simultaneous EEG-fMRI, i.e., guiding the placement of intracranial electrodes in patients with non-lesional or multifocal epilepsies (Zijlmans et al. 2007). Figure 4 shows one example that combines IED-related hemodynamic responses, post-operative imaging and intracranial EEG signals.
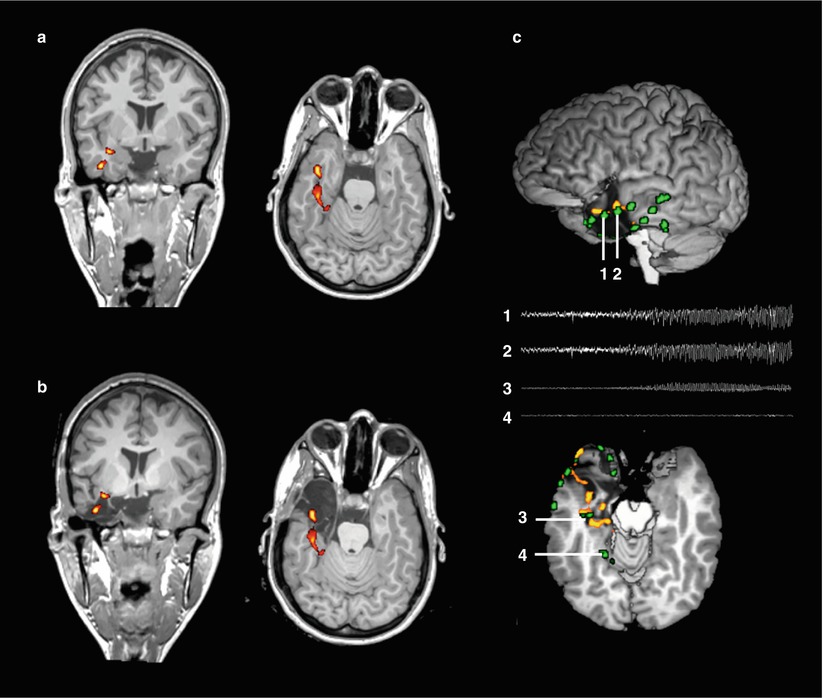

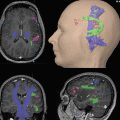
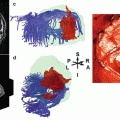
Fig. 4
Presurgical mapping of epileptogenic areas using simultaneous EEG-fMRI. Panel (a) shows a coronal and axial slice of a patient with non-lesional left-sided mesial temporal lobe epilepsy (same patient as in figure 1, neurological convention). Color maps indicate clusters of blood-oxygen level dependent (BOLD) signal increases significantly correlated with interictal epileptiform discharges (p<0.05, corrected for multiple comparisons). Panel (b) shows the same clusters projected onto a postoperative anatomical MRI. The peak BOLD cluster is included in the resected area. Panel (c) shows the correspondence between IED-related BOLD clusters and intracranial EEG signals. The upper image shows a lateral view of the 3D-rendered brain after resection. Green clusters represent intracranial electrode positions, derived from CT-MRI fusion. The lower image shows an axial cut through the upper border of the resection. Traces show the first 10 seconds of seizure evolution in the temporal pole (electrodes 1 and 2) and the hippocampus (3). Note their proximity to the hemodynamic IED-correlates. In contrast, a distant electrode (4) does not show epileptiform activity
Box 2
Key Points of Combined EEG-fMRI in the Presurgical Workup of Pharmacoresistant Epilepsies
Clinical
Noninvasive, safe, radiation–free method that can assist decision-making during the workup for epilepsy surgery, a highly effective therapy in carefully selected pharmacoresistant patients.
Satisfactory concordance of BOLD activations with other modalities such as scalp and intracerebral EEG, PET, and SPECT.
Added value in complex cases: localizing value in patients with non-lesional or multifocal epilepsies.
Methodical
Artifact reduction is crucial: optimal recording setup essential, advanced (operator-independent) post-processing techniques can minimize impact noise from various physiological and non-physiological sources.
Results are highly dependent on modeling choices: “non-canonical” hemodynamic models might be advantageous (but cave false positives), motion has to be carefully accounted for.
Interpretation is highly dependent on statistical thresholding: optimal tradeoff between sensitivity and specificity has to be determined and carefully selected on a case-by-case basis.
Challenges
The significance of local and distant BOLD deactivations is not fully understood.
Prospective validation studies are lacking.
4 Future Directions
Epilepsy is a prototypical dynamic disease that includes a large-scale network and not only a circumscribed area of seizure generation. Normal brain function requires complex interactions between different, highly dynamic neural systems that rely on the integrity of structural and functional networks. Thus, a comprehensive evaluation of epilepsy necessitates not only the identification of the epiletogenic zone but the understanding of the functional embedding and interaction of this epiletogenic zone within an epileptic network. There is now emerging evidence that this view of epilepsy as a network disorder is more appropriate on anatomical, neurophysiological, and cognitive levels. Specific cortical and subcortical networks are increasingly recognized as fundamental elements that contribute to the generation and spread of focal onset seizures throughout the human brain. Network theory enables the interpretation of complex neural systems as an assembly of “nodes” and “edges,” representing functional and structural elements (brain areas) of a specific network and their structural and functional relationship. Functional network characteristics of the brain can be assessed by EEG and resting state BOLD fMRI either in combination or separately. While functional connectivity is considered as the physiologic process of “communication” between the brain areas within a network, structural network characteristics as measured by diffusion tensor or diffusion spectrum imaging “…can be considered as the “supporting hardwire” (van Diessen et al. 2013). Neurophysiologic studies have frequently reported increases in functional connectivity along large-scale networks in the brain and within the affected lobe that harbors the epileptic lesion (Bartolomei et al. 2006; Horstmann et al. 2010). This is in opposite to fMRI-based connectivity studies that reported widespread decreases in functional connectivity (Liao et al. 2010). These differences indicate differences in spatial and temporal resolution between neurophysiologic and fMRI studies. Simultaneous EEG and fMRI studies offer the potential to disentangle the relationship between neurophysiologic and BOLD-associated connectivity (van Dellen et al. 2009; van Wijk et al. 2010). A future goal of MR imaging would be also to measure changes of electromagnetic fields directly without the need of perfusion imaging or BOLD fMRI (Petridou et al. 2006). This technique, called neuronal current imaging, makes use of changes in ionic currents associated with synaptic and suprathreshold activity in the order of nanoamperes. While it has not reached its way into clinical practice, it would certainly lead to further insights into human brain functional organization (Bodurka and Bandettini 2002) and offer a new window for simultaneous recordings of EEG and MRI.
5 Conclusions
Simultaneous EEG-fMRI is a methodically challenging technique with some important practical pitfalls to consider. However, the capacity of simultaneous EEG-fMRI to provide detailed three-dimensional whole-brain maps of epileptiform activity is unparalleled by other methods, making it an attractive tool for clinical and experimental investigations. Artifact rejection algorithms, statistical analysis techniques, and biophysical models for multimodal data fusion are evolving rapidly, and so is the range of applications. This is an exciting area of imaging neuroscience that could have, given proper validation, a direct impact on our understanding and management of epilepsy patients.
References
Aghakhani Y, Bagshaw AP, Benar CG, Hawco C, Andermann F, Dubeau F, Gotman J (2004) fMRI activation during spike and wave discharges in idiopathic generalized epilepsy. Brain 127:1127–1144PubMed
Aguirre GK, Zarahn E, D’Esposito M (1998) The variability of human, BOLD hemodynamic responses. Neuroimage 8:360–369PubMed
Al-Asmi A, Benar CG, Gross DW, Khani YA, Andermann F, Pike B, Dubeau F, Gotman J (2003) fMRI activation in continuous and spike-triggered EEG-fMRI studies of epileptic spikes. Epilepsia 44:1328–1339PubMed
Allen PJ, Polizzi G, Krakow K, Fish DR, Lemieux L (1998) Identification of EEG events in the MR scanner: the problem of pulse artifact and a method for its subtraction. Neuroimage 8:229–239PubMed
Allen PJ, Josephs O, Turner R (2000) A method for removing imaging artifact from continuous EEG recorded during functional MRI. Neuroimage 12:230–239PubMed
Archer JS, Abbott DF, Waites AB, Jackson GD (2003a) fMRI “deactivation” of the posterior cingulate during generalized spike and wave. Neuroimage 20:1915–1922PubMed
Stay updated, free articles. Join our Telegram channel

Full access? Get Clinical Tree


