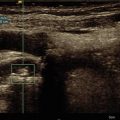
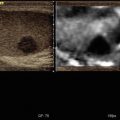
Fig. 5.1
Ultrasound images of a 57-year-old woman. B-mode sonography indicates an ovoid to round hypoechoic lesion with a maximum diameter of 0.6 cm. The diagnosis was a focal fatty tissue area of the breast

Fig. 5.2
Colour Doppler sonography does not indicate an increased vascularity of the lesion

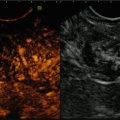
Fig. 5.3
VTIQ velocity colour overlay displayed relative shear wave velocities according to the adjacent colour spectrum, red areas corresponding to higher values and blue areas corresponding to lower values. Increased shear wave speed relates to increased tissue stiffness. Shear wave velocity was measured in the lesion v = 1.67 m/s and in the surrounding tissue level between v = 1.87–2.14 m/s

Fig. 5.4
Same lesion as Fig. 5.3. The VTIQ quality map is used to confirm that shear wave formation was adequate and to identify regions where shear wave velocity measurements may be artificially low due to poor shear wave signal quality. Here the VTIQ quality map shows all of the breast tissue and the lesion coloured green, an indicator of reliable shear wave velocity measurement


Fig. 5.6
In VTI elastography mode, the lesion appears grey, indicating an intermediate stiffness of the lesion

Fig. 5.7
Strain elastography shows a mixture of green and blue, indicating a lesion of intermediate stiffness in comparison with the surrounding tissue

Fig. 5.8
Ultrasound images of a 43-year-old woman. B-mode sonography indicates a hypoechoic mass with angular margins. The histological diagnosis proven by core needle biopsy was of an invasive ductal carcinoma

Fig. 5.9
Colour Doppler sonography indicates an increased vascularity of the lesion

Fig. 5.10
VTIQ velocity colour overlay displayed relative shear wave velocities according to the adjacent colour spectrum, red areas corresponding to higher values and blue areas corresponding to lower values. Shear wave velocity was measured in the lesion v = 6.79–7.03 m/s and in the surrounding tissue level between v = 1.90–2.24 m/s

Fig. 5.11
Same lesion as Fig. 5.10. Using the VTIQ quality map, all of the breast tissue and the lesion are coloured in green, indicating the high quality of generated shear wave velocity measurements


Fig. 5.13
In VTI elastography mode, the lesion appears black and is much larger in comparison to the lesion size seen on B-mode, indicative of a very stiff lesion

Fig. 5.14
In VTQ mode, the shear wave speed velocity was measured in the lesion with a velocity of v = 5.40 m/s

Fig. 5.15
In strain elastography, the lesion appears black and is larger in comparison to the B-mode, indicative of a very stiff lesion

Fig. 5.16
Ultrasound images of a 65-year-old woman. B-mode sonography shows a round hypoechoic lesion with a maximum diameter of 1.1 cm. The histological diagnosis proven by core needle biopsy was of ductal carcinoma in situ (DCIS)

Fig. 5.17
Colour Doppler sonography indicates moderate vascularity of the lesion

Fig. 5.18
VTIQ velocity colour overlay displayed relative shear wave velocities according to the adjacent colour spectrum, red areas corresponding to higher values and blue areas corresponding to lower values. Shear wave velocity was measured in the lesion v = 3.67–7.10 m/s and in the surrounding tissue level between v = 1.93–2.31 m/s

Fig. 5.19
Same lesion as Fig. 5.18. Using the VTIQ quality map, most of the breast tissue and the lesion are coloured green with some parts of the lesion coloured yellow, indicating a good quality of generated shear waves


Fig. 5.21
In VTI elastography mode, the lesion appears as black and is much larger in VTI-mode in comparison to the B-mode, indicative of a very stiff lesion

Fig. 5.22
In VTQ mode, the shear wave measurement in the centre of the lesion is displayed as X.XX m/s. This result is likely caused by the heterogeneity of the lesion (as indicated in Fig. 5.18), making a large single point measurement unobtainable. VTIQ is recommended in these cases where a measurement cannot reliably be made with VTQ

Fig. 5.23
In VTQ mode, the shear wave speed was measured in the surrounding tissue with a velocity of v = 2.13 m/s

Fig. 5.24
In the strain elastogram, the lesion appears black and is larger in comparison to the B-mode, indicative of a very stiff lesion

Fig. 5.25
Ultrasound images of a 55-year-old woman. B-mode sonography indicates a hypoechoic lesion with angular margins and significant posterior shadowing measuring a maximum diameter of 2.1 cm. The histological diagnosis proven by core needle biopsy was invasive ductal carcinoma

Fig. 5.26
Colour Doppler sonography does not display increased vascularity of the lesion

Fig. 5.27
VTIQ velocity colour overlay displayed relative shear wave velocities according to the adjacent colour spectrum, red areas corresponding to higher values and blue areas corresponding to lower values. Shear wave velocity was measured in the surrounding tissue v = 1.18–2.36 m/s. This is a classic example of the “red ring” appearance of cancer VTIQ colour map shown as black in the centre of the lesion with no obtainable shear wave velocity. This corresponds to the significant absorption seen in the B-mode image (Fig. 5.25) and is where the VTIQ information has dropped out due to the shear wave signal-to-noise ratio (SNR) being too low for a measurement to be made. Also see quality map in Fig. 5.28

Fig. 5.28
Same lesion as Fig. 5.27. Using the VTIQ quality map, most of the breast lesion is coloured yellow and red which indicates that the shear wave velocity estimates in these areas may be unreliable or not possible. The surrounding breast tissue is coloured green indicating a high-quality generated shear waves and is the most reliable area to make the shear wave velocity measurements

Fig. 5.29


Same lesion as Figs. 5.27 and 5.28. VTIQ displacement mode shows the central part of the lesion displayed as black which in this case indicates that the shear wave signal was not detected (as indicated in Figs. 5.27 and 5.28), whereas the tissue adjacent to the lesion is displayed as dark blue through to light blue as you get further from the lesion indicating moderate to good tissue displacement in the surrounding breast parenchyma
Related posts:
Stay updated, free articles. Join our Telegram channel
Full access? Get Clinical Tree
