Introduction
The 12-lead electrocardiogram (ECG) is still the most frequently used diagnostic method in patients with suspected ischemic heart disease (IHD). Practically all patients presenting at the emergency room with chest pain have an ECG recorded to exclude or confirm unstable IHD and ongoing myocardial ischemia. In many regions, ECG is recorded in ambulances on patients with typical or atypical chest pain, dizziness, fainting, irregular heartbeat, and other clinical symptoms or signs. Furthermore, inducible ECG changes found during an exercise or pharmacologic stress test are frequently used to diagnose significant coronary artery stenosis in the situation of stable IHD. The frequent use of ECG as a diagnostic method in suspected IHD worldwide is due to several factors. First, the ECG provides a unique perspective of the condition of the myocardium by exploring its electrical activity, which is not depicted by other imaging modalities of the heart. Second, it is an inexpensive examination that is not associated with any risk for the patient, and it can be performed within a few minutes. Third, the technique is widely available, even in the developing parts of the world. Finally, the medical community has a long experience with the method because it has been around for more than 100 years.
Currently, the standard clinical ECG is displayed in 12 leads, 6 limb leads, and 6 precordial leads. This results in 12 views of the electrical activity of the myocardium. Body surface potential mapping (BSPM) is a method that provides additional views of the body surface potential distribution by performing recordings at multiple sites (24-240 sites) on the body surface. BSPM has evolved from the so-called classical forward and inverse problems of ECG. The former focuses on how the electrical activity from electrical sources present in the heart is propagated to the epicardium (near-field problem) or to the body surface (far-field problem).1 The latter focuses on how the electrical activity recorded at the body surface can be used to derive details about the electrical activity in the heart (ie, epicardial potentials).2 Both problems require high spatial resolution information from the body surface, which can be obtained through BSPM. Thus, BSPM has previously been shown to be useful for detecting myocardial infarction.3-6 BSPM will not be discussed further in this chapter.
Although there are clear advantages to using additional leads in certain circumstances, problems may occur even when using only the 10 electrodes of the standard 12-lead ECG. Multiple electrodes and wires interfere with auscultation, echocardiograms, resuscitation efforts, and chest x-rays. Noise levels due to limb movement detected by multiple leads make interpretation difficult, and the discomfort to patients caused by so many electrodes tends to be high. Additionally, rapid and accurate electrode placement can be difficult in emergency situations. Fewer electrodes placed at more easily accessed locations could facilitate ECG acquisition for both patients and staff. An example of a reduced lead set is the EASI lead system, which uses five torso electrodes, four recording and one ground. The EASI lead system has been shown to emulate the 12-lead ECG reasonably well,7-13 which can be advantageous in the emergency situation.14 Reduced-lead systems will not be discussed further in this chapter.
In vectorcardiography, the sum of the heart’s electrical activity in three-dimensional space throughout the cardiac cycle is traced by using only three orthogonal leads, Vx, Vy, and Vz. Vectorcardiography has been shown to have substantial potential for monitoring patients with acute myocardial infarction15,16 and may help in identifying candidates for emergency coronary angiography.16 It has also been shown to correlate with enzymatically estimated infarct size.17 The use of vectorcardiography in IHD will be discussed further in subsequent parts of this chapter.
ECG Aspects of Myocardial Ischemia
Myocardial ischemia is defined as an insufficient oxygen supply of the myocardium in relation to its oxygen demand. To put acute ischemia-related ECG changes into perspective of the serial events occurring in the myocardium in the situation of acute coronary occlusion, the following section will discuss the so-called ischemic cascade.18
Before discussing the consequences of myocardial ischemia, it is important to understand the cause of it. Blood flow to the myocardium can be partially reduced due to a coronary stenosis or completely absent due to coronary occlusion. The major pathophysiologic basis of coronary stenosis and occlusion is the formation of an atherosclerotic plaque in the coronary vessel wall. The severity of a coronary stenosis depends on the degree at which the stenosis obstructs the arterial lumen. If the atherosclerotic plaque becomes unstable and ruptures, the formation of a thrombus in situ starts, which results in occlusion of the coronary artery. Coronary occlusion can also result from embolization19 or spasm20,21 of the coronary artery.
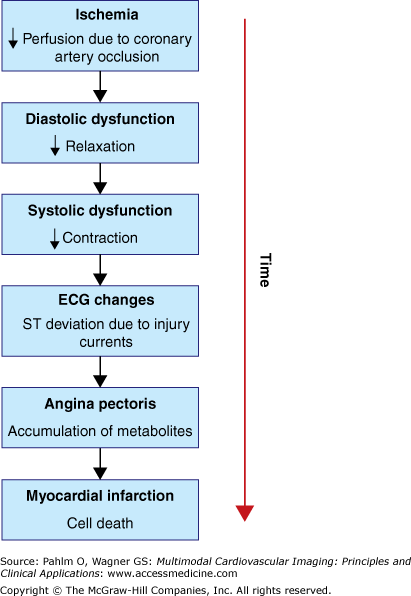
A sudden coronary occlusion, in the absence of a significant coronary collateral flow, results in transmural myocardial ischemia, which is the initial step of the ischemic cascade (Fig. 7–1). The steps of the ischemic cascade caused by sudden loss of coronary blood flow can be described as follows:
Myocardial ischemia: As the coronary artery is occluded, the perfusion to the part of the myocardium supplied by the occluded vessel is terminated, and this part of the myocardium becomes ischemic.
Diastolic dysfunction: Soon after the coronary vessel has been occluded, diastolic dysfunction can be observed in the myocardium supplied by the occluded vessel. The diastolic dysfunction is due to impaired myocardial relaxation. The relaxation is the first to be affected by the ischemia because it is the most energy-demanding process of the cardiac cycle. Normally, the myocytes relax by pumping cytosolic Ca2+ into the sarcoplasmatic reticulum or out of the cell. This process requires adenosine triphosphate (ATP). As the coronary artery becomes occluded, the oxygen supply to the myocardium distal to the occlusion is interrupted. The lack of oxygen results in a shift of the aerobic metabolism to anaerobic glycolysis within seconds.22 The high-energy phosphate reserve, available predominantly as creatine phosphate, is almost completely exhausted after 30 seconds of ischemia. Thus, there is an imbalance between ATP production and consumption.23 The latter exceeds the former, and the earliest result is dysfunctional myocyte relaxation.
Systolic dysfunction: As the ischemia persists, Ca2+ accumulates in the cytosol, which becomes acidotic and exhibits an increase in phosphate concentration.24,25 This eventually causes impairment of myocyte contractility and systolic dysfunction, which is the next step in the ischemic cascade.
ECG changes: The earliest and most consistent ECG alterations due to acute transmural ischemia are increased T wave amplitude and ST-segment elevation in ECG leads above the ischemic zone. These ECG changes occur due to injury currents induced in the border zone between ischemic and nonischemic myocardium.26-28 These ST-segment changes are discussed in detail later.
Angina pectoris: Eventually the accumulation of metabolites in the ischemic myocardium causes development of chest pain, so-called angina pectoris.29 The chest pain is often experienced in conjunction with pain radiating to the arms, neck, jaw, shoulders, or back. The accumulated metabolites (including adenosine) stimulate afferent cardiac nerves that fuse with afferent nerves from the organs mentioned earlier, explaining why myocardial ischemia can be experienced as extrathoracic pain.
Myocardial infarction: If the ischemia is severe enough and persists long enough without restoration of blood flow, the ultimate fate of the myocytes supplied by the occluded vessel is irreversible injury (cell death). If ischemia persists, the myocardial infarction will evolve from the endocardial border and progress toward the epicardium in a wave-front manner.30 If there is no restoration of blood flow, the infarction will ultimately involve the full thickness of the myocardial muscle wall, transmural myocardial infarction. Thus, the duration of ischemia is a major determinant of the transmural extent of infarction.31
The ST-segment coincides with and is the result of the plateau phase of the ventricular transmembrane action potential. Under normal conditions, the ST segment is isoelectric because the transmembrane voltage remains at approximately the same levels in all ventricular myocytes during that time. Ischemia can reduce the resting membrane potential, shorten the duration of the action potential, and reduce the amplitude of the action potential plateau phase. These alterations of the electrical properties in ischemic myocardium result in abnormal voltage gradients between normal and ischemic myocardium. This voltage gradient induces an injury current, seen as deviation of the ST segment on the body surface ECG. As mentioned earlier, these injury currents arise in the border zones between normal and ischemic myocardium.26-28
There are two types of injury currents, a diastolic injury current and a systolic injury current. In the situation of transmural ischemia, the diastolic injury current causes a negative displacement (depression) of the diastolic TQ baseline due to a reduced resting membrane potential. This can partly be explained by increased extracellular K+ in the ischemic zone.32 As a result, a lead overlying the ischemic myocardium will detect a negative deflection during electrical diastole.
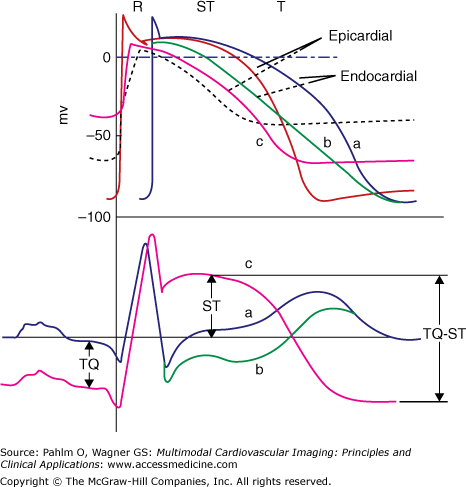
There is evidence suggesting that ST-segment elevation partly originates from a true elevation of ST segment caused by systolic injury currents. The shortening of the action potential and the decrease in its amplitude cause injury current to flow during electrical systole and cause ST-segment elevation and hyperacute tall T waves.33 Thus, ST-segment elevation can be explained by baseline depression or true ST-segment elevation or both,34-37 which is illustrated in Fig. 7–2. ST-segment elevation is measured at the J point, the time where the QRS complex ends and the ST segment starts.
Figure 7–2.
Typical myocardial cell action potentials (upper curves) and body surface electrocardiograms (lower curves) that represent various degrees of ischemia (b), injury (c), and cell death (necrosis). Curves labeled “a” represent the normal pattern. Reproduced with permission from Selvester et al.46
If the ischemic injury is transmural, the overall ST vector is directed toward an overlying lead that then exhibits ST-segment elevation. Hence, transmural ischemia can be seen as ST-segment depression in leads in which the lead axis is opposite to the leads with ST-segment elevation. This can be seen, for example, when the posterolateral left ventricular (LV) wall is subject to transmural ischemic injury, when the typical change in the standard 12-lead ECG is ST-segment depression in leads V1 and V2.38 This is because the ST vector is directed away from the exploring V1 and V2 electrodes. Thus, in this situation, ST-segment depression should be considered indicative of transmural ischemic injury.
According to current guidelines,39 the predetermined threshold for ST-segment elevation (age, sex, and ECG lead dependent)40-42 should be exceeded in two or more anatomically contiguous ECG leads in order to be indicative of acute transmural myocardial ischemia. The currently recommended threshold values of ST-segment changes are listed in Table 7–1.
| ST-Segment Elevation | ST-Segment Depression |
|---|---|
| For men 40 years of age and older, the threshold value for abnormal J-point elevation should be 0.2 mV (2 mm) in leads V2 and V3 and 0.1 mV (1 mm) in all other leads. | For men and women of all ages, the threshold value for abnormal J-point depression should be −0.05 mV (−0.5 mm) in leads V2 and V3 and −0.1 mV (−1 mm) in all other leads. |
| For men less than 40 years of age, the threshold values for abnormal J-point elevation in leads V2 and V3 should be 0.25 mV (2.5 mm). | |
| For women, the threshold value for abnormal J-point elevation should be 0.15 mV (1.5 mm) in leads V2 and V3 and greater than 0.1 mV (1 mm) in all other leads. | |
| For men and women, the threshold for abnormal J-point elevation in V3R and V4R should be 0.05 mV (0.5 mm), except for males less than 30 years of age, for whom 0.1 mV (1 mm) is more appropriate. | |
| For men and women, the threshold value for abnormal J-point elevation in V7 through V9 should be 0.05 mV (0.5 mm). |
ST-segment elevation can also occur in the absence of myocardial ischemia. In the situation of early repolarization, ST-segment elevation is characterized by J-point elevation and rapid upslope or normal ST segment, which is considered a normal variant. ST-segment elevation can also be associated with pericarditis, elevated serum potassium, acute myocarditis, Osborne waves (caused by hypothermia), and certain cardiac tumors. Thus, it can be a clinical challenge to differentiate acute transmural ischemia from other causes of ST-segment elevation. However, criteria have been suggested that can be applied to differentiate ST-segment elevation caused by acute myocardial ischemia from that resulting from other causes.43
The ECG is still the most important diagnostic method in the situation of suspected acute coronary occlusion. All patients who present at the emergency department with symptoms associated with myocardial ischemia should undergo an ECG examination. If ST-segment elevation above the predetermined thresholds (see Table 7–1) is seen in two or more anatomically contiguous body surface ECG leads in the situation of suspected acute coronary syndrome, the patient is likely to suffer from transmural ischemia due to a coronary occlusion and is in need of acute reperfusion therapy. Development of infarction after such an event is clinically referred to as ST-segment elevation myocardial infarction (STEMI). Patients who develop infarction with ST-segment elevation below the predetermined thresholds or without ST-segment elevation are clinically diagnosed as having non–ST-segment elevation myocardial infarction (NSTEMI).
ECG Aspects of Myocardial Infarction
The definition of myocardial infarction is, as discussed earlier, cell death due to prolonged myocardial ischemia. Cell death can be identified pathologically by identification of specific histologic patterns such as coagulation or contraction-band necrosis. By pathology, the infarction can be localized and quantified, as well as classified, according to the timing of the infarction (acute, healing, or healed) by description of the ultrastructure of the infarction and the presence of polymorphonuclear leukocytes.
The clinical diagnosis of acute myocardial infarction is defined by a rise of cardiac biomarkers such as creatine kinase isoenzyme MB (CK-MB) and cardiac troponin T or I (cTnT or cTnI) together with evidence of myocardial ischemia with at least one of the following: (1) symptoms of ischemia; (2) ECG changes indicative of acute ischemia/infarction; (3) imaging evidence of new loss of viable myocardium or new regional wall motion abnormality.44
The final stage of the ischemic cascade is, as previously discussed, myocardial infarction. Because the acute injury currents have subsided, the remaining ECG abnormalities are due to the resulting infarction. The infarction will affect the local activation sources of the myocardium seen as changes primarily in the QRS complex. The infarction might also cause persistent alteration of the repolarization, resulting in remaining T wave alterations.45 The magnitude and extent of infarct-related QRS complex changes in different leads depend on the location and extent of infarction.
The myocardial activation (depolarization) vector is the result of all parts of the myocardium that are being depolarized at a given time point. The result of the time-resolved propagation of the depolarization vector during the cardiac cycle is what causes the deflections of the QRS complex seen in different leads. The degree to which the normal depolarization vector changes after an acute myocardial infarction depends on the characteristics of the infarction such as the location, size, endocardial extent, and transmural extent.
If the initial depolarization forces are directed away from an exploring lead, the initial QRS deflection in that lead is negative and results in a Q wave. Presence of Q waves in leads that normally do not exhibit initial negative depolarization forces can be a sign of myocardial infarction in the underlying myocardium. Myocardial infarction can, however, result in other changes in the QRS complex depending on its location. If the infarction is isolated to the posterolateral LV wall, the alteration in the QRS complex is not the appearance of Q waves, but rather prominent R waves in leads V1 and V2. In fact, 10% of all infarcts are limited to the basal parts of the LV and do not produce Q waves.46 Still, the terms Q wave myocardial infarction (QWMI) and non–Q wave myocardial infarction (non-QWMI) are well-established clinical entities, although the differences in infarct characteristics between QWMI and non-QWMI are not completely understood. Furthermore, the prognostic impact of Q wave development is still controversial.47 Historically, the development of pathologic Q waves after acute coronary occlusion has been associated with transmural myocardial infarction. Based on animal studies, Prinzmetal et al48 stated that transmural myocardial infarction was required for pathologic Q waves to appear. More recently, however, histopathology49-51 studies have shown that Q waves in the ECG are not as closely related to transmural myocardial infarction as previously reported. In the past, however, it has been difficult to establish the pathologic basis for Q waves in humans due to lack of accurate in vivo methodology. Recent advances of different imaging modalities have enabled studies of the pathophysiologic basis of infarct-related ECG changes. Such studies are discussed in the last section of this chapter.
The resting standard 12-lead ECG is often used clinically to report on the presence of myocardial infarction based on infarct-related QRS and T wave changes. A newly detected pathologic Q wave is a common cause for outpatients to be referred to a cardiologist in order to rule out or confirm coronary artery disease. Thus, it is important to understand the ability and limitations of the standard 12-lead to detect and quantify myocardial infarction.
Quantitative Assessment of Myocardial Ischemia and Infarction Using the 12-Lead ECG
Figure 7–3 is an illustration and mathematical characterization of solid angle theory by Holland and Arnsdorf52 in the 1970s, produced at a time when many investigators were using epicardial and precordial ST-segment mapping to determine the size and severity of ischemia.53,54 Holland et al55 performed a series of experiments in pigs and showed that the amount of ST-segment elevation is affected by the size and shape of the ischemic zone in relation to the anatomic location of the ECG lead.
Figure 7–3.
Mathematical and pictorial characterization of solid angle theory. The amount of observed ST-segment elevation is proportional to the solid angle (Ω), defined as the area of spherical surface cut off a unit sphere (inscribed about the recording electrode) by a cone formed by drawing lines from the recording electrode to every point along the ischemic boundary. The ischemic boundary is a source of electrical current flow established by differences in the transmembrane potentials of the normal (VN) and ischemic (VI) cells during electrical systole and diastole. Thus, the amount of observed ST-segment elevation is determined by the size and shape of the ischemic zone, along with the difference in potential between ischemic and normal cells, and a term (K) to correct for differences in conductivity between the intra- and extracellular spaces. Reprinted from Holland RP, Arnsdorf MF. Solid angle theory and the electrocardiogram: physiologic and quantitative interpretations. Prog Cardiovasc Dis. 1977;19:431-457, Copyright 1977, with permission from Elsevier.
In the 1980s, as thrombolytic therapy moved into widespread use, investigators sought to use the 12-lead ECG to quantify the size of ischemia. In 1988, Aldrich et al56 developed an ST-segment deviation score for use in acute anterior and inferior myocardial infarction, and later, a score was developed for posterolateral myocardial infarction.57 The scores were developed by assessing the relationship between the predischarge ECG QRS score estimation of final infarct size and the number of leads with and the amount of ST-segment deviation on the presenting ECG. Because the patients did not receive reperfusion therapy, it was assumed that the entire region of ischemic myocardium at risk would infarct. The Aldrich score has been used in multiple studies to estimate myocardium at risk.58,59 However, it did not have a strong correlation with myocardial perfusion single photon emission computed tomography (SPECT) measurements of ischemia size.60 Simplified ECG approaches to estimate myocardium at risk are confounded by differences in distance between each LV wall and individual electrodes and by the fact that the magnitude of the ischemic vector is proportional to 1/distance2.
In contrast to the 12-lead ECG, where the amount of ST-segment elevation in each lead is affected by the distance and location of the individual lead according to the solid angle theorem,52 a single vector from a vectorcardiography might better correlate with the size of ischemic myocardium. Prior studies have used continuous monitoring of vectorcardiography changes to quantify myocardial ischemia and infarction.61-65 In addition, the Frank vectorcardiography lead system66 has been used to compare ST-vector magnitude changes to myocardial perfusion SPECT estimates of the size and severity of ischemia.67-69 A recent study used the inverse Dower transformation to convert the 12-lead ECG to a vectorcardiogram and projected the vector to a model of the LV to localize ischemia. In addition, the ST-vector magnitude was shown to correlate with ischemia size by myocardial perfusion SPECT.70
The Sclarovsky-Birnbaum ischemia grading system was introduced in 1990 and is now considered to be a method for estimating the severity of ischemia.71,72 It is based on assessment of changes in the terminal part of the QRS complex and in the ST segment. The ischemia grading system consists of three grades representing increasing severity: grade I is characterized by tall upright T waves without ST-segment elevation, grade II is characterized by ST-segment elevation in at least two adjacent leads without terminal QRS distortion, and grade III is characterized by ST-segment elevation with terminal QRS distortion in two or more adjacent leads. Observational studies have shown that patients with grade III ischemia have worse prognosis, larger myocardial infarction size, and less benefit from reperfusion therapy.73-75
The Anderson-Wilkins score for estimating the acuteness of ischemia was introduced in 1995.76,77 It describes a continuous scale from 4.0 (hyperacute) to 1.0 (subacute) based on the comparative hyperacute T waves versus abnormal Q waves in each of the leads with ST-segment elevation or tall T waves. The Anderson-Wilkins score considers each standard lead (except aVR) with at least 0.1-mV ST-segment elevation or tall T waves based on the criteria of Gambill et al.78
Stay updated, free articles. Join our Telegram channel

Full access? Get Clinical Tree


