Introduction
The purpose of cardiovascular electrophysiologic mapping is to define the anatomic sequence of myocardial activation, both at baseline and/or with arrhythmia. There have been tremendous technologic advances in this area1 that have created fertile ground for the integration of multiple imaging modalities. High-level integration begins with preprocedural assessment of electrophysiologic properties revealed by the 12-lead surface electrocardiogram (ECG) viewed in the context of patient demographics and history.2,3 Further information is added during invasive electrophysiologic mapping with assessment of intracardiac electrograms viewed in the context of cardiac anatomy.4,5 The fusion of functional electrophysiologic data with anatomic data in the electrophysiology laboratory facilitates catheter navigation, data annotation, and direct visualization of target sites for therapy. Following an invasive electrophysiologic mapping procedure, there are likewise multiple imaging modalities useful for assessing response to therapy, excluding complications, and directing future diagnostic and therapeutic decisions.6
Preprocedural Evaluation
The efficiency and effectiveness of an invasive electrophysiologic mapping procedure are dependent on the preprocedure evaluation. Patient demographics, history, and 12-lead surface ECG both at baseline and with arrhythmia help determine what diagnoses are possible and, among the possible, which are most likely. The 12-lead ECG is among the oldest and most useful imaging modalities for localizing arrhythmia origin and characterizing arrhythmia mechanism. The 12-lead ECG provides imaging by display of vectorial information contained in the body surface voltage pattern viewed from different leads, each viewing the heart from a different perspective or “angle.” Tachycardia occurring in a female in her forties with a superior P wave axis, short RP interval, with a narrow QRS complex is most likely atrioventricular nodal re-entrant tachycardia.7 A younger male with tachypalpitations originally presenting in adolescence may have an ECG that looks similar; however, based on demographics, atrioventricular re-entrant tachycardia via an accessory pathway may be more likely8 (Fig. 8–1). A patient with a history of right atriotomy might have findings of typical right atrial flutter (ie, negative “sawtooth-shaped” flutter waves in the inferior leads and positive flutter waves in the anterior precordial leads) on the 12-lead ECG; however, the patient might also have right lateral wall atrial flutter encircling the atriotomy scar. These arrhythmias may present simultaneously or sequentially (Fig. 8–2). The probability of directing one’s attention to the appropriate substrate is favored by a thoughtful preprocedure analysis.
Figure 8–1.
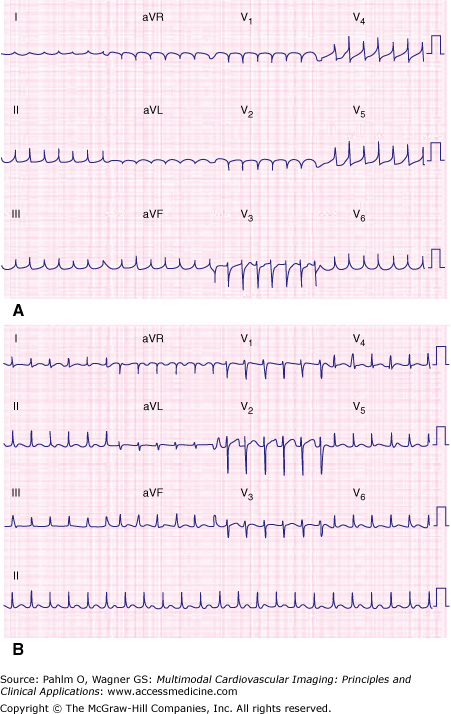
Narrow complex tachycardias with similar-appearing 12-lead electrocardiograms. Combining demographic information with RP interval assists with determining tachycardia mechanism. A. A 42-year-old woman with atrioventricular nodal reentrant tachycardia. B. A 22-year-old man with orthodromic atrioventricular reentrant tachycardia.
Figure 8–2.
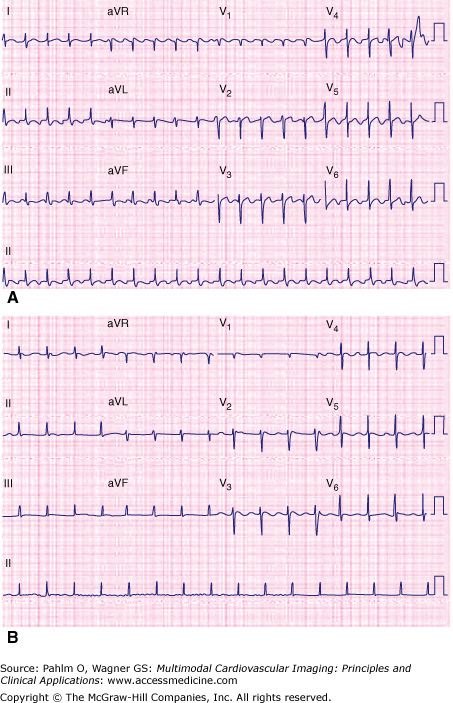
Substrate for more than one macro–reentrant right atrial flutter. The patient is a 53-year-old woman with previous atrial septal defect repair via a right atriotomy. A. Typical cavotricuspid isthmus–dependent right atrial flutter. B. Non–cavotricuspid isthmus–dependant flutter (encircling the right atriotomy scar) emerging during ablation across the cavotricuspid isthmus. Note the change in atrial flutter cycle length and flutter-wave morphology.
In addition to viewing the 12-lead ECG in arrhythmia in the context of patient history, it is likewise valuable to compare the 12-lead ECG in arrhythmia with the 12-lead ECG at baseline. Findings present on one but not the other can be helpful in elucidating arrhythmia mechanism. The presence of ventricular pre-excitation on a baseline ECG makes a narrow complex tachycardia most likely to be secondary to atrioventricular re-entrant tachycardia (orthodromic).9 The presence of a small retrograde P wave buried in the tail of the QRS in tachycardia that is absent at baseline would be suggestive of typical atrioventricular nodal re-entrant tachycardia. The presence of a “bump” in the T wave during tachycardia that is absent at baseline or a change in the P wave morphology with tachycardia may be suggestive of atrial depolarization with a focal atrial tachycardia. The P wave axis and duration give clues to the source of the tachycardia. Narrow complex arrhythmias originating from atria that have been incised or undergone extensive linear ablation will be more likely macro–re-entrant. Atria that are not scarred (with the exception of cavotricuspid isthmus–dependent right atrial flutter) will more often be focal, usually emerging from one of many known regions of increased arrhythmogenicity (crista terminalis, superior vena cava, tricuspid valve annulus, fossa ovalis, atrial septum, coronary sinus os/body, right atrial appendage, left atrial appendage, pulmonary veins, ligament of Marshall, mitral valve annulus, noncoronary cusp)10 (Fig. 8–3). Knowing prior to invasive electrophysiologic mapping whether a focal tachycardia is likely to be originating from the right atrium or left atrium assists in preprocedural planning from a technical, equipment planning standpoint, as well as in assessing risks and benefits of the mapping procedure for review with the patient undergoing the procedure. Likewise, analysis of baseline P wave characteristics, including P wave duration and axis, provides information about how electrical activity is initiated and propagated through the atria, adding information about atrial structure and function that may be relevant to arrhythmia mechanism.11
Figure 8–3.
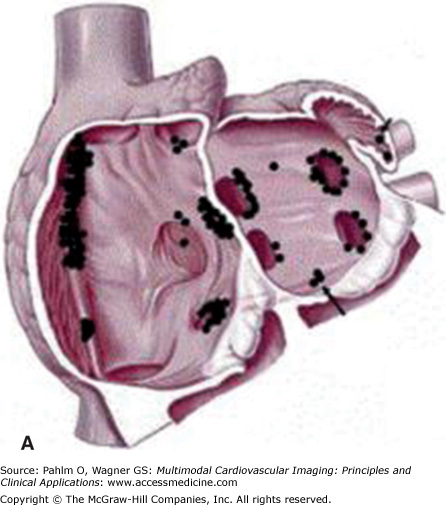
Anatomic distribution of focal atrial tachycardias. A. An oblique cut away of the atria displaying atrial tachycardia origins posterior to the atrioventricular valves. B. Sites of focal atrial tachycardia originating on the atrioventricular valve annuli. AV, aortic valve; CS, coronary sinus; HBE, His bundle; MV, mitral valve; TV, tricuspid valve. Reprinted from Journal of the American College of Cardiology, 48(5), Kistler PM, Roberts-Thomson KC, Haqqani HM, et al, P-Wave morphology in focal atrial tachycardia: development of an algorithm to predict the anatomic site of origin, Copyright 2006, with permission from Elsevier.
A history of tachycardia termination with maneuvers that slow conduction through the atrioventricular node (ie, vagal maneuvers, carotid massage, adenosine, β-blockers, calcium channel blockers) suggests that the atrioventricular node may be a part of the tachycardia circuit. Assessment of the PR interval and QRS duration at baseline provides a noninvasive measure of conduction through the atrioventricular node and His-Purkinje system.12 The presence of baseline pathologic Q waves may be indicative of ischemic heart disease,13 making a wide complex tachycardia more likely to be a “scar-related” ventricular arrhythmia. Another finding suggestive of the presence of structural heart disease (making ventricular tachycardia more likely) is the presence of low limb lead voltage with preserved (or increased) precordial voltage on the baseline ECG. This finding is frequently seen with dilated cardiomyopathy secondary to a greater proportion of the thoracic cavity being occupied by myocardium and blood pool, thus producing a smaller voltage difference in the bipolar limb leads, but maintaining the voltage measured in the unipolar precordial leads.14,15 A prolonged QT interval (long QT syndrome), upward coved ST-segment elevation with T wave inversion in the anterior precordial leads (Brugada syndrome), epsilon waves (brief upward deflection at the J point) with T wave inversions across the anterior precordial leads (arrhythmogenic right ventricular cardiomyopathy), unexplained high voltage (hypertrophic cardiomyopathy), and frequent premature ventricular contractions with the same morphology as the clinical tachycardia (such as with an automatic or triggered ventricular tachycardia) are some of the many clues that may be seen on the baseline ECG and correlated with the ECG in tachycardia to help define the arrhythmia mechanism.
When there is lack of clarity as to whether an arrhythmia is atrial or ventricular, evidence of ventricular pre-excitation at baseline (particularly if multiple accessory pathways are present) makes an atrioventricular reciprocating mechanism more likely. The absence of an anterograde conducting accessory pathway combined with notation of a typical bundle branch block appearance with or without presence of a “long-short” (Ashman) phenomenon prior to the onset of a wide QRS tachycardia (right bundle branch block occurring more frequently than left bundle branch block) may indicate aberrant conduction. If the wide QRS complex is not a typical bundle branch block pattern and particularly if diagnostic features such as atrioventricular dissociation or fusion/capture beats can be identified, then attention can be focused on the ventricular chambers. The presence of a left bundle branch block pattern and inferior axis in a patient without history of structural heart disease suggests a right ventricular outflow tract origin. However, if the precordial transition occurs at V3 or earlier, then the right coronary cusp or left ventricular outflow tract is also a possible site of origin. If a right bundle branch block morphology with inferior axis is present in the absence of structural heart disease, then the left coronary cusp, left ventricular outflow tract, aortic-mitral continuity, or superior mitral valve annulus is a likely site of origin. Left coronary cusp ventricular tachycardias often have an “M-shape” QRS complex in V1, whereas the aortic-mitral continuity frequently demonstrates qR in V1; are negative in V2; and then are positive in V3. Ventricular arrhythmias from the mitral valve annulus should have positive concordance across all precordial leads. As the site of origin moves away from the center of the heart, the QRS width should increase because it will take longer to complete ventricular depolarization moving from one side of the heart to the other rather than starting in the middle and traveling both to the left and the right simultaneously (similar to the finding of P waves in atrioventricular nodal re-entrant tachycardia being narrower than in sinus rhythm secondary to the shorter time required to activate both atria from the center of the heart).
Beyond clues provided by the history and surface ECG, transthoracic echocardiography is a useful tool to evaluate cardiac structure and function. Two-dimensional and three-dimensional echocardiography is capable of assessing chamber size, myocardial function, and valve function. Additional information relevant to electrophysiologic mapping is the ability of the transthoracic echocardiogram to exclude the presence of left ventricular thrombus as a relative contraindication to left ventricular endocardial mapping (Fig. 8–4). Transthoracic echocardiography with Doppler can also be used to estimate right ventricular systolic pressures. The presence of significant pulmonary hypertension may predict poor tolerance of sustained tachycardia and therefore may modify plans for the electrophysiologic mapping approach. Two-dimensional echocardiography findings of unexpected wall motion abnormalities or worse than expected valvular heart disease may also raise points requiring further investigation prior to consideration of electrophysiologic mapping. Electrophysiologic mapping may require the use of isoproterenol and/or rapid burst pacing for arrhythmia induction. Exclusion of significant obstructive coronary artery disease may be important prior to performance of an electrophysiologic mapping procedure to avoid inducing a significant amount of ischemia with attempts at arrhythmia induction. Presence of a previously unrecognized atrial septal defect or patent foramen ovale may also be important to recognize in order to minimize risks for paradoxical embolus with right-sided procedures that would otherwise not be present with an intact atrial septum.
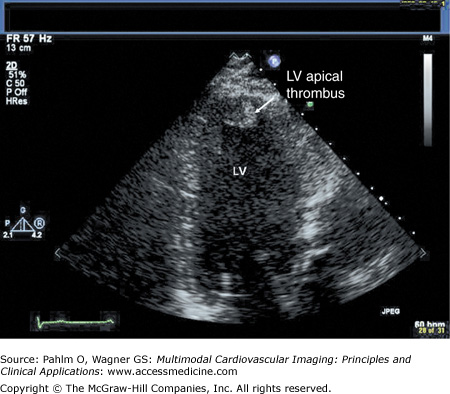
Left ventricular apical thrombus on 2D transthoracic echocardiogram.
Play Video
Although transthoracic echocardiography is useful for the analysis of many cardiac structures, patients with rhythms of atrial flutter or atrial fibrillation require transesophageal echocardiography for exclusion of left atrial appendage thrombus. In the case of right atrial flutter, arrhythmia duration <48 hours or therapeutic anticoagulation (ie, warfarin with international normalized ratio ≥2.0) for ≥4 weeks is usually adequate prior to right atrial mapping and ablation. However, for patients with atrial fibrillation who require mapping catheter instrumentation of the left atrium, a more thorough investigation with transesophageal echocardiogram may be warranted to exclude the presence of left atrial appendage thrombus16 (Fig. 8–5).
Figure 8–5.
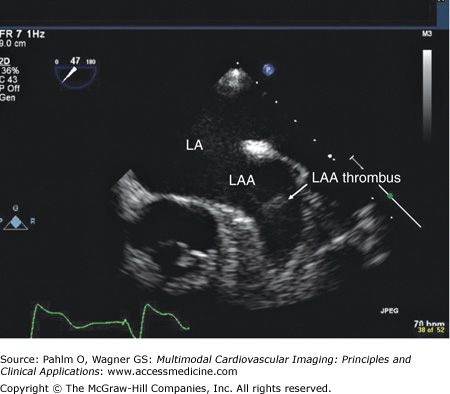
Transesophageal echocardiography revealing left atrial appendage thrombus despite therapeutic anticoagulation for more than 4 weeks. LA, left atrium; LAA, left atrial appendage. Image provided with permission from Patrick Hranitzky, MD, Duke University Medical Center. See Moving Image 8–5.
TEE revealing left atrial appendage thrombus despite therapeutic anticoagulation for greater than four weeks.
Play Video
Regarding left atrial mapping specifically, there may be much to be gained from preprocedural imaging of the left atrium and surrounding structures by either magnetic resonance imaging (MRI)17 or computed tomography (CT).18 Preprocedural left atrial imaging provides a road map of pulmonary vein anatomy (normal and variant) and identifies esophageal position (Fig. 8–6). Other potential left atrial structures of interest that may be imaged with these techniques include left atrial diverticula or accessory left atrial appendices.19 These structures have the potential to be arrhythmogenic and to be sites of increased perforation risk. MRI has the benefit of image acquisition without the use of ionizing radiation or the use of iodinated contrast. The former is of particular interest to younger patients and women. The latter is of particular interest to those with a history of iodine/contrast/shellfish allergy or renal insufficiency. In either case, both CT and MRI are able to create data sets that accurately depict left atrial anatomy in a way that can facilitate left atrial electrophysiologic mapping.
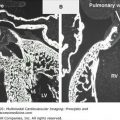
Figure 8–6.
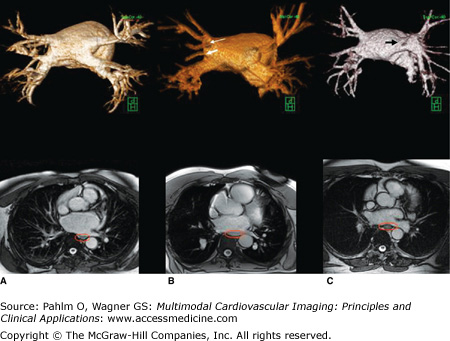
Cardiac magnetic resonance angiography demonstrating normal and normal variant pulmonary vein anatomy (green cube for orientation; H, head; P, posterior). A. All four pulmonary veins (right upper, right lower, left upper, and left lower) emerging from the left atrium in a normal fashion. B. Variant right pulmonary vein anatomy with a separate right middle pulmonary vein (thick white arrow) and early posterior branch off the right lower pulmonary vein (thin white arrow). C. Left pulmonary veins (left upper and left lower) emerging as a common trunk (black arrow). Below each left atrial image is the corresponding axial bright blood image displaying esophageal position (red ellipse around the esophagus). See Moving Images 8–6A to C.
All four pulmonary veins emerging from the left atrium in a normal fashion.
Play Video
Variant right pulmonary vein anatomy with a separate right middle pulmonary vein and early posterior branch off the right lower pulmonary vein.
Play Video
Left pulmonary veins emerging as a common trunk.
Play Video
In addition to left atrial anatomy, cardiac MRI is also able to evaluate left ventricular myocardial function and obtain data regarding tissue characteristics in this region (Fig. 8–7). Although history, ECG, and echocardiogram detect the majority of patients with structural heart disease, there are patients who have myocardial abnormalities that may not be identified by techniques other than MRI,20 particularly when the underlying disease process is in its early stages. Examples of this can be found in patients with previously unrecognized myocarditis (acute, chronic, or resolved) (Fig. 8–8), sarcoidosis,21 hypertrophic cardiomyopathy,22 hemochromatosis,23 amyloidosis,24 arrhythmogenic right ventricular cardiomyopathy,25 or Chagas disease.26
Figure 8–7.
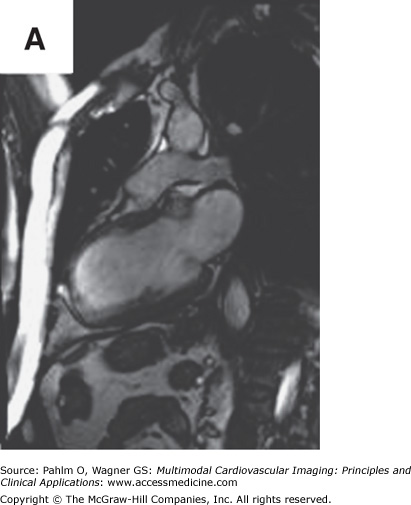
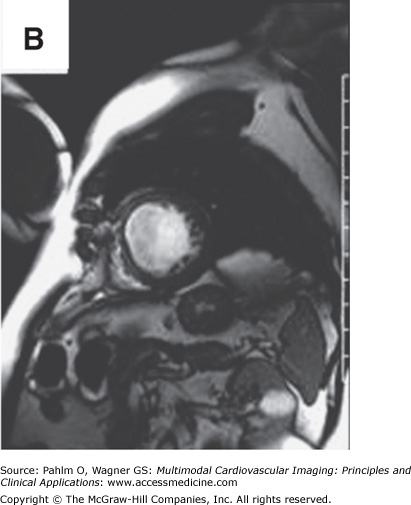
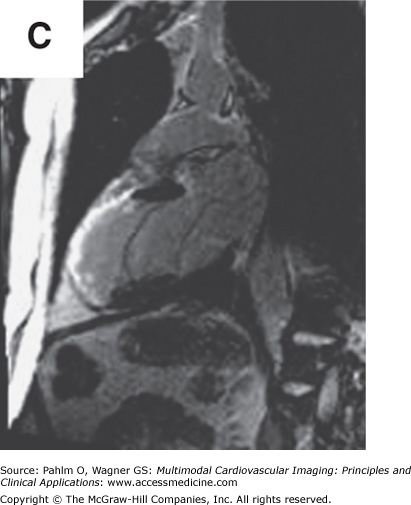
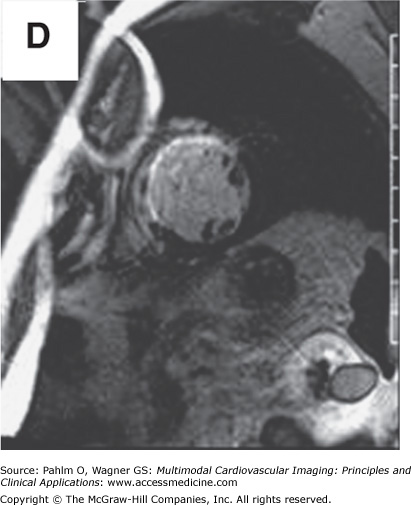
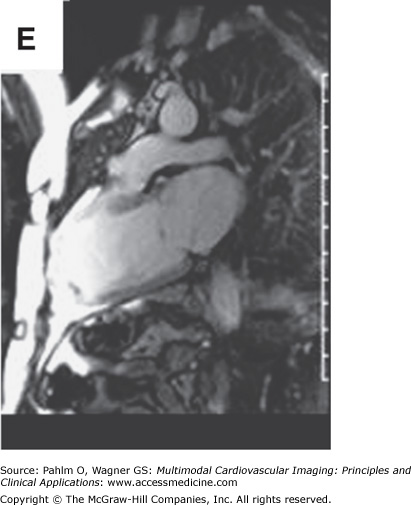
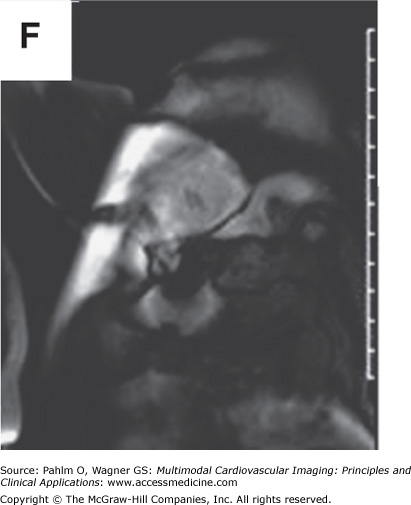
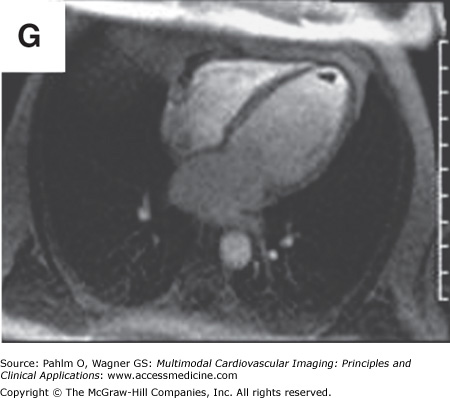
Cardiac magnetic resonance imaging in a patient with previous myocardial infarction and left ventricular apical thrombus. A. and B. Two-chamber and short axis cine views demonstrating focal wall thinning and hypokinesis. C. and D. Corresponding delayed-enhancement images revealing myocardial scarring/infarct. E. and F. Two-chamber and short axis, high inversion time images demonstrating thrombus in the left ventricular apex. G. Further confirmation of thrombus magnetic resonance angiography in a four-chamber view. See Moving Images 8–7A, B, and G.
Two chamber view demonstrating focal wall thinning and hypokinesis.
Play Video
Short axis cine view demonstrating focal wall thinning and hypokinesis.
Play Video
Further confirmation of thrombus magnetic resonance angiography in a four chamber view.
Play Video
Figure 8–8.
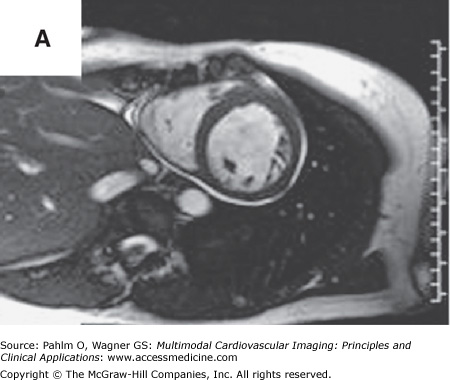
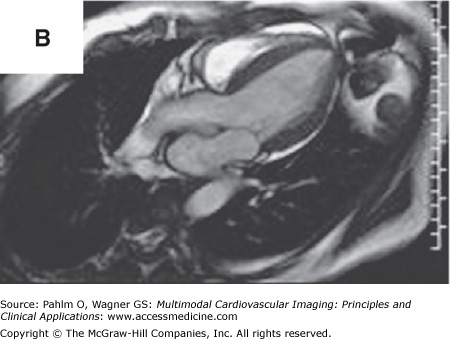
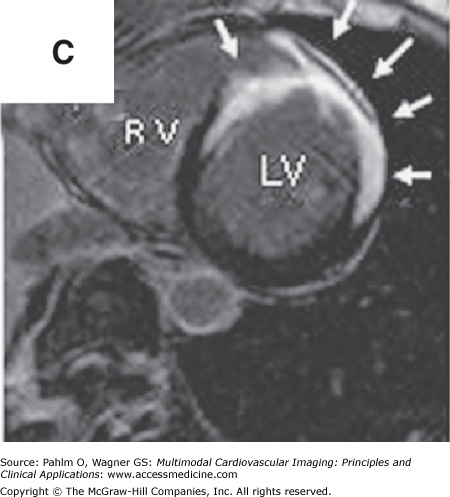
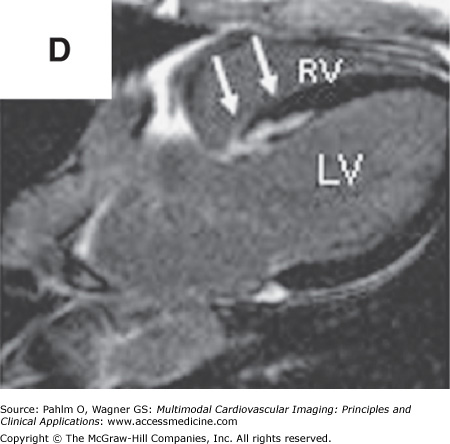
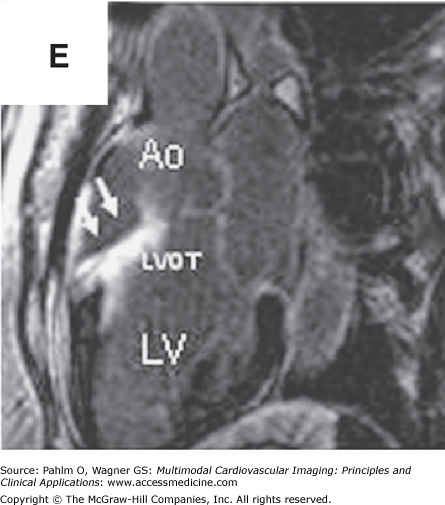
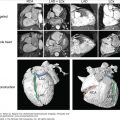
Cardiac magnetic resonance imaging with delayed-enhancement images revealing nonischemic myocardial scarring in a patient with outflow tract ventricular tachycardia. A. and B. Magnetic resonance cine images in short axis and three-chamber views with absence of dramatic wall motion abnormalities. C–E. Delayed-enhancement images revealing nonischemic extensive anterobasal myocardial scarring extending up toward the outflow tract of the left ventricle (arrows). Ao, aorta; LV, left ventricle; LVOT, left ventricular outflow tract; RV, right ventricle. See Moving Images 8–8A and B.
Three dimensional magnetic resonance imaging of the heart and proximal central vasculature.
Play Video
Bright blood magnetic resonance imaging in oblique views to visualize the region of anomalous pulmonary vein connection to the superior right atrium / superior vena cava.
Play Video
In addition to anatomic and functional data, cardiac MRI is also able to obtain physiologic data including stress perfusion imaging and flow-velocity data. Both MRI and CT angiography can be useful for assessment of proximal coronary arterial anatomy, assessing systemic and pulmonary arterial and venous connections, although the ability of MRI to acquire data in a multiplanar fashion can be particularly useful in patients with complex anatomy such as patients with some forms of congenital heart disease (Fig. 8–9). The MRI information obtained in this patient population can be useful not only for roadmapping anatomic regions of interest, but also for treatment planning (ie, exclusion of need for interventions such as baffle stenting or surgical repair that might affect the plan for electrophysiologic mapping and arrhythmia treatment).
Figure 8–9.
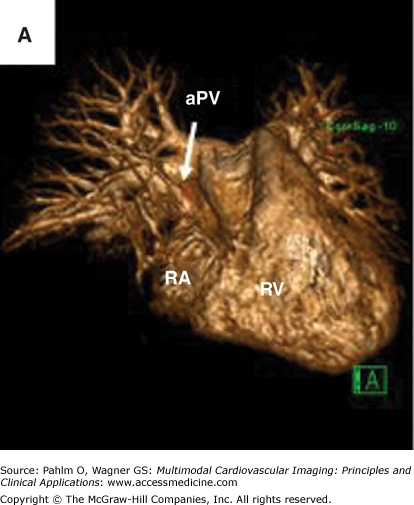
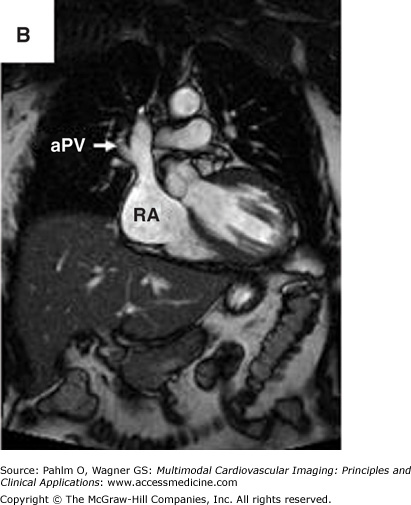
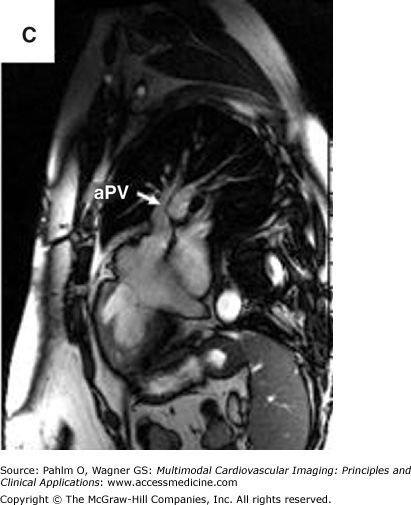
Magnetic resonance imaging of an anomalous pulmonary vein entering at the superior right atrium/superior vena cava. A. Three-dimensional magnetic resonance imaging of the heart and proximal central vasculature (green cube for orientation; A, anterior). B. and C. Bright blood magnetic resonance imaging in oblique views to visualize the region of anomalous pulmonary vein connection to the superior right atrium/superior vena cava. aPV, anomalous pulmonary vein; RA, right atrium; RV, right ventricle. See Moving Images 8–9A to C.
Magnetic resonance cine images in short axis view with absence of dramatic wall motion abnormalities.
Play Video
Magnetic resonance cine images in three chamber view with absence of dramatic wall motion abnormalities.
Play Video
Bright blood magnetic resonance imaging in double oblique views to visualize the region of anomalous pulmonary vein connection to the superior right atrium / superior vena cava.
Play Video
Cardiac MRI is useful for identifying the myocardial scar that is the substrate for ischemic ventricular tachycardia. However, most ischemic ventricular tachycardia mapping procedures are done in patients with implantable cardioverter defibrillators. The absence of a completely MRI-compatible implantable cardioverter defibrillator (or the presence of other contraindication to MRI) is a significant barrier to the routine use of cardiac MRI in this setting. This barrier, however, does not completely exclude the possibility of performing cardiac MRI with a defibrillator in situ. MRI protocols for some implanted cardiac devices have been published with documentation of points of concern as well as statements that MRIs can be obtained without prohibitive image compromise and without adverse effects to the patient or the device (devices implanted on or after the year 2000).27 In the study by Nazarian and Halperin,27 emphasis was placed on the preprocedural review of the chest x-ray to assess all used and abandoned hardware. Lead length and loops were noted to increase current and therefore create heat. A specific absorption rate (SAR) of ≤2.0 W/kg was recommended with the noted caveat that the SAR-to-heat correlation is not consistent among different MRI scanners. Recommendations were also made for the use of the largest acceptable field of view, longest repetition time, minimal flip angle, and minimal acquisition bandwidth. There was notation that magnetic fields can flip reed switches, which may affect the function of certain devices. A full device interrogation was recommended before MRI scanning (checking battery voltage, sensing, impedance, pacing threshold, and programmed parameters) and after MRI scanning to assure stability. Tachycardia detection and tachycardia therapy were programmed off prior to MRI to prevent filling tachycardia counters with noise and to prevent inappropriate tachycardia therapies for electromechanical interference associated with performance of the cardiac MRI. For pacemakers, pacing parameters were programmed to an asynchronous mode (if pacemaker dependent) or VVI/DDI (if underlying rhythm was stable) to avoid inhibition of pacing or tracking of noise, respectively (MRI scanning was not recommended for implantable cardioverter-defibrillator patients if pacemaker dependent). All magnet response features were disabled. Recommendations were made for blood pressure, ECG, oxygen saturation, and symptom monitoring with physicians and advanced cardiac life support equipment present. Imaging planes perpendicular to the device generator with shortened echo time and use of spin-echo and fast spin-echo spoiled gradient recall echo cine were used to reduce qualitative device artifacts. Implantable loop recorders are MRI safe; however, the data recorded on these devices must be downloaded prior to MRI and the memory must be cleared after MRI to avoid overwriting previous useful electrogram data with electromechanical interference and to avoid maintaining arrhythmia logs filled with electromechanical interference, respectively. Temporary pacing wires, abandoned leads, and epicardial leads are not MRI safe. MRI should not be performed within the first 6 weeks after device implant. Although the total number of patients in this study was relatively small, the combination of imaging success and absence of adverse outcomes is encouraging. Underreporting of adverse consequences, however, remains a concern; therefore, prior to attempting MRI with a pacemaker or defibrillator in situ, consideration must be given to the risk-benefit analysis of this endeavor. For further investigation of questions regarding MRI compatibility, useful information can be obtained from the following Website: http://www.mrisafety.com/.
Incorporation of cardiac MRI–defined ventricular scar-specific data into a three-dimensional electroanatomic map has been described.28 Although Desjardins et al28 showed a good correlation between MRI scar data and information obtained electroanatomically, the transfer of scar data from the MRI to the electroanatomic map was somewhat laborious, and when imported into the electroanatomic mapping system, the ventricular scar was not able to be represented with the level of detail achievable on the original MRIs. Nevertheless, this basic concept shows great potential. Most of the technology required to bring these MRIs into the electrophysiologic mapping laboratory is available. When defibrillators become fully MRI compatible to ease the safety concerns and logistic challenges of performing cardiac MRI in patients with implantable cardioverter-defibrillators, it is likely that preprocedural scar imaging data will make a rapid leap into the electrophysiologic laboratory. Bringing these multiple imaging modalities together in a three-dimensional, merged/fused fashion will likely facilitate efficiency, safety, and efficacy in the treatment of ischemic ventricular tachycardia.
In addition to cardiac MRI and CT, cardiac positron emission tomography (PET) may hold promise for the assessment of metabolic abnormalities relevant to arrhythmogenesis.29 Evaluating abnormalities of metabolism, such as those that occur with inflammation, may provide insight into the status of myocardium not measurable by other techniques. The ability to visualize these abnormalities may be particularly useful in the investigation of cardiac sarcoidosis or myocarditis. In these disease processes, systemic markers of disease activity may be variably present and may not accurately represent disease activity in the myocardium. Identification of cardiac-specific metabolic abnormalities may be one area where cardiac PET can provide useful information (Fig. 8–10). At times of active myocardial inflammation, treatments targeting the suppression of inflammation30 (or consequences of inflammation) may be more effective for improving long-term outcomes than using mapping and catheter-based therapies on a dynamic substrate.
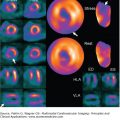
Figure 8–10.
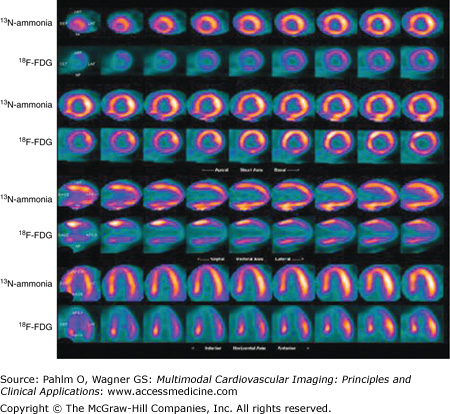
Cardiac positron emission tomography (cPET). A clinical picture of myocarditis accompanied by ventricular tachycardia and complete heart block was investigated by cPET following a 16-hour period of fasting. In this unusual case, a heterogeneous pattern of glucose uptake is present with increased 18F-FDG uptake in the mid to basal left ventricle compared with relatively little uptake in the apical left ventricle. It is conceivable that these findings represent local metabolic abnormalities relevant to myocardial disease activity and arrhythmogenesis. 13N-ammonia, nitrogen-13 ammonia.
Multimodal Imaging in the Electrophysiology Laboratory
Electrophysiologic mapping of complex arrhythmias requires integration of multiple imaging techniques to achieve the best possible safety and efficacy profile. Multiple techniques for assessing static and real-time representations of cardiac anatomy and myocardial electrical activity are displayed simultaneously, in digital, two-dimensional, three-dimensional, and merged formats to provide well-validated information about target anatomy and target electrophysiology.
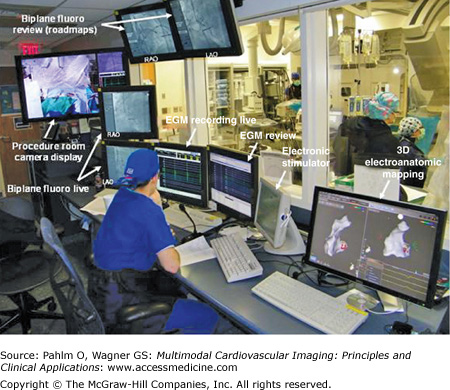
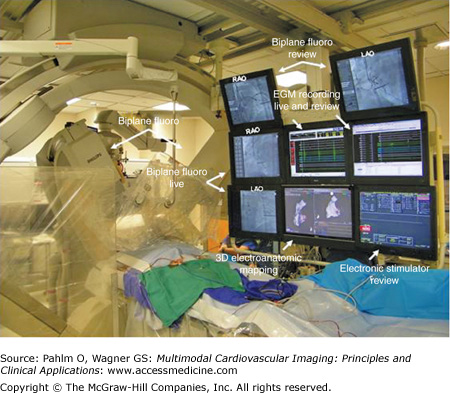
A typical electrophysiologic laboratory is divided into two rooms, the control room and the patient room. The control room contains displays for real-time electrograms (EGMs), a review screen for assessment of static EGMs, fluoroscopy displays, an electronic stimulator display, three-dimensional electroanatomic mapping display, and additional monitor screens as needed for viewing real-time echocardiography, preprocedure studies, and/or a procedure room camera display. Lead glass and a doorway separate the control room from the patient room. The patient room is equipped with multiple monitor booms to display the multiple imaging modalities needed for guiding catheter manipulation during the electrophysiologic mapping procedure (Figs. 8–11 and 8–12).
Within the electrophysiologic laboratory, the EGM recording system measures and displays electrical signals from both surface leads and intracardiac catheters. The timing and morphology of surface ECG leads provide the starting point for EGM interpretation and arrhythmia analysis. Three or four surface ECG leads are displayed at the top of the live EGM recording screen. The leads selected are most frequently orthogonal in the frontal plane (ie, leads I and aVF) with one or two precordial leads, usually including V1 (V1 is particularly useful to differentiate right bundle branch block and left bundle branch block QRS morphologies). Displayed below the surface ECG leads are the intracardiac EGMs (Fig. 8–13). Intracardiac EGMs are amplified and filtered to produce sharp deflections used to indicate timing of local electrical activity. The presentation of these EGMs on the live screen scrolls from left to right at an adjustable speed depending on operator preference (eg, 100 mm/s or 200 mm/s). There is also an audible beep that can be programmed to sound for ventricular sensed events that changes in tone for paced events in order to alert all in the electrophysiologic laboratory to the heart rate without looking at the EGM screen. Next to the live EGM screen is most frequently a review screen. When a pacing train is complete, the EGM screen shot at the end of the train is directed to the review screen for analysis. If there is a spontaneous event of interest, a single-button stroke can transmit the EGMs from the live screen to the review screen for analysis. The EGM recording screens (live and review) are displayed in the control room, as well as at the bedside in the patient room to allow for EGM analysis during catheter manipulation.
Figure 8–13.
Electrogram recording system demonstrating surface electrocardiogram leads at the top of the screen with intracardiac electrograms (EGMs) below. Coronary sinus (CS) and His catheters have proximity to both the atrium and the ventricular and therefore detect both atrial and ventricular signals. A, atrial EGM; d, distal; HRA, high right atrium; p, proximal; RA, right atrium; RV, right ventricle; V, ventricular EGM.
Related posts:
 Optical Mapping of Electrical Activity
 Phonocardiography
 Ischemic Heart Disease
 Development of the Heart, with Particular Reference to the Cardiac Conduction Tissues
 Myocardial Perfusion Single Photon Emission Computed Tomography and Positron Emission Tomography
 Cardiac Magnetic Resonance Imaging in Ischemic Heart Disease
Stay updated, free articles. Join our Telegram channel

Full access? Get Clinical Tree


