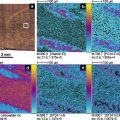
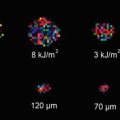
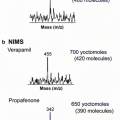
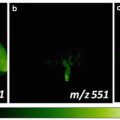
Fig. 1
(a) Graphic representation of the ELDI setup. The sample deposited on the stainless steel plate was positioned on the mobile sample stage and irradiated with a pulsed laser beam, where the laser beam was set behind the plane of the figure at an incident angle of 45°. The laser-ablated material was ionized in an electrospray solvent plume delivered through an electrospray capillary, where the resulting ions entered the mass spectrometer through the MS inlet tube. The distance between the ESI tip and the MS inlet tube was set as 8 mm, while the distance between the electrospray capillary and sample surface was set as 3 mm; the optimum location of the laser spot on the sample surface was positioned approximately 1 mm below the tip of the ESI capillary. (b) Schematic representation of the imaging experiment conducted using ELDI/MS. Each scan line on the sample resulted in a unique spectrum
3.2 Preparation of Tissue Sections
1.
The dry plant was cut into 2–5-mm-thick slices using a razor blade at room temperature. For Oldham Elaeagnus, the sample was sliced into thin sections of approximately 50 × 60 × 5 mm (L × W × H) (see Note 8 ).
3.
Dry tissue sections can be stored in the freezer for a few months
3.3 ELDI Imaging Experiments
1.
The plant slice set on the sample plate was positioned on a homemade automated XY stage in front of the sampling capillary of a Bruker Esquire 3000 Plus ion trap mass spectrometer. For small-molecule analysis, the acquisition mass range was set from 50 to 250 m/z.
2.
Use the IMS_Control software to set the moving speed of the stage and define the scanning area, and line scan number on the automatic XY stage software controller (see Note 10 ). For example, the sample stage is moved according to the laser beam at the speed of 200 μm/s along the x-axis within a defined area of 57 × 10 mm (L × W), each time at an increment of 250 μm in the transverse direction (Y) (see Note 11 ).
3.4 Data Acquisition
1.
Create a sample list in the mass spectrometer acquisition software (Bruker EsquireControl 5.2). The total number of samples in the list is equal to the number of lines in the image. The last two characters of the file name should index the sequence of files (e.g., OE_01.yep, OE_02.yep, OE_03.yep, …, and OE_40.yep).
2.
Make sure that the acquisition method contains the correct acquisition time for each line, e.g., 40 lines with an acquisition time of 285 s for each experiment.
3.
Start the acquisition
3.5 Data Analysis
1.
Before data analysis, convert the Bruker EsquireControl 5.2 mass spectra files (.yep extensions) into format files (.ascii) using Bruker DataAnalysis software, in which the ascii files are required by home-developed ImagAnalysis v2.1 software, which is available upon request.
2.
The following instructions describe how to generate chemical images of Oldham Elaeagnus via ImagAnalysis v2.1 software. (a) Open ImagAnalysis v2.1; (b) click on the LOAD DATA menu bar to load the converted file (.ascii extensions); (c) select the rainbow-colored scale and adjust the contrast of the image by selecting minimum and maximum values on the slide bars; (d) key in the m/z value (i.e., m/z 60.7, m/z 86.5, m/z 97.5, m/z 111.4, and m/z 137.5) displayed in the mass spectrum window; (e) click on the CREATE IMAGE menu bar to see an image of the distribution of small organic compounds from Oldham Elaeagnus surface; (f) copy the image and paste onto the organic photo of Oldham Elaeagnus using PowerPoint; and (g) repeat steps and the overlay chemical images from Oldham Elaeagnus surface should be observed (see Note 7 ).
4 Notes
1.
The composition of the electrospray solution can influence the stability of the electrospray generated during ELDI analysis and the ability of the technique to detect particular analytes from the tissue matrix depending on the solubility of the analyte in the solvent system. The solvent composition is usually 50 % MeOH + 0.1 % acetic acid for most cases.
2.
Ensure that the tip of the fused silica capillary is square and not burred or cracked. A burred or cracked tip will result in electrospray instability leading to irreproducible data.
3.
Turn on the syringe pump and the high voltage for the electrospray. Make sure that the syringe contains enough solvent to acquire an image of the desired size. A 2.5 mL syringe filled with ESI solution is suggested and will typically last for 6 h with a flow rate of 150 μL/h. Let the electrospray stabilize for 10 min before starting analysis.
4.
The voltage will depend on the composition of ESI solution, geometry of MS inlet, and the distances between the ESI tip, the MS inlet tube, and the sample plate. The high voltage is typically set from +4 kV to +6 kV for positive ion scan mode.
5.


The laser energy will depend on the sample materials. The laser energy is typically set from 250 μJ to 1 mJ (Warning). Avoid eye or skin exposure to direct or scattered radiation. Safety goggles should be worn when performing ELDI experiments.
Stay updated, free articles. Join our Telegram channel

Full access? Get Clinical Tree


