Fig. 12.1
Advances in CT scanners
Patient Preparation
Image quality is optimised by patient preparation prior to image acquisition. Oral or intravenous beta blockers are administered to reduce heart rate to minimise cardiac motion during scan acquisition. Scan acquisition is routinely performed at heart rates ≤65 beats per minute and during mid to late diastole (75–90 % of the R–R interval) when the coronary arteries are most still. Sublingual nitroglycerin is administered immediately prior to scan acquisition to achieve coronary vasodilatation and has been demonstrated to improve image quality [8].
Radiation Exposure
Retrospectively ECG-gated 64-detector CCTA requires an effective radiation exposure of 7–21 millisieverts (mSv) [4]. Advances in imaging techniques have resulted in a much lower currently required radiation dose. Firstly the use of lower tube potential from the standard 120–100 kV in subjects less than 90 kg has markedly reduced radiation exposure by 30–50 % [9]. Secondly, scan acquisitions are now routinely performed using prospective ECG gating, during which radiation exposure occurs only during late systole or diastole, in preference to retrospective ECG gating, during which scan acquisition occurs throughout the entire R–R interval. This has reduced the effective radiation dose by >50 % [10]. Thirdly the use of new scanner technology including wide-detector array and high pitch dual source spiral “flash” scanning has extensively shortened scan acquisition time to within a single heart beat in the majority of patients. Both technologies require excellent heart rate control to achieve maximal radiation minimisation and has resulted in the ability to perform scans with <1 mSv radiation exposure [11, 12]. Lastly the methods of image reconstruction using CT have also evolved from the conventional process of filtered back projection, a rapidly applicable technique which does not make full use of the information contained in the X-ray data acquired to iterative reconstruction which is computationally more elaborate but makes more effective use of the acquired X-ray information. Currently these methods have been applied not so much to improve the image quality of existing scan protocols but to reduce the noise level of low-dose acquisitions and hence permit CCTA with reduced radiation exposure. Clinical trials thus far have demonstrated the ability to lower the dose using this method by up to 44 % [13].
Coronary Plaque and Stenosis Assessment
Qualitative Assessment
Method
CT coronary images are typically interpreted in axial or multiplanar reformatted planes as well as in curved multiplanar reformats. By visual inspection, atherosclerotic plaques can be identified in each of the 17 coronary segments and classified based on stenosis severity which can be graded as normal, minimal plaque with <25 % diameter lumen stenosis, mild: 25–49 % stenosis, moderate: 50–69 % stenosis, severe: 70–99 % stenosis and occluded [14]. Furthermore plaque can be classified based on its morphology based on the presence and relative amount of calcification: non-calcified plaque in which the entire plaque contains no calcium density; calcified plaque in which the plaque appears completely calcified and mixed plaque in which the plaque contains both calcified and non-calcified plaque (Fig. 12.2). Non-calcified plaque can be further subdivided into low-density and high-density non-calcified plaque, based on different attenuation thresholds.


Fig. 12.2
Different types of coronary plaques based on composition. (a) Non-calcified plaque, (b) mixed plaque, (c) calcified plaque
Accuracy
The diagnostic accuracy of qualitative assessment using CCTA has been compared to invasive angiography in a large number of single and multicentre studies based on visual assessment using a binary approach in classifying lumen stenosis as <50 or ≥50 %. In 2008, three large multicentre studies demonstrated in patients with low to intermediate risk of CAD that 64-detector CCTA identified significant coronary artery stenosis with a sensitivity of 85–99 %, specificity of 64–90 % and a negative predictive value of 83–99 % [4–6]. In a recent meta-analysis including 89 studies comprising 7,516 patients with suspected and known CAD, the per-patient sensitivity and specificity for >16 slice CCTA was 98 % and 89 %, respectively [15]. This demonstrates the robustness and accuracy of CCTA to provide coronary assessment in a manner which most closely resembles invasive angiography among all other non-invasive imaging modalities particularly in patients with low to intermediate risk of CAD. Accordingly current European and the US guidelines advocate the use of CT in this population with a Class IIa and Class IIb indication [16, 17]. In addition, since 2010, the ACC/AHA appropriate use criterion has been recommended that it is appropriate to use CCTA as an upfront investigation in this population [18].
Reproducibility
The reproducibility of qualitative stenosis and plaque assessment is optimised in studies performed on patient subsets identified to have excellent image quality. A significantly increased interobserver variability is found in cases with poor image quality [19]. Rinehart reported in a high quality image cohort of 186 coronary segments, an excellent intraobserver agreement for both stenosis rating (K = 0.96) and plaque classification (K = 0.96) [20]. Furthermore interobserver agreement was excellent both for the degree of stenosis (K = 0.90) and for plaque composition (K = 0.88). Similarly Lehman et al. demonstrated that in a subset of 15 patients (4,057 cross sections) with acute chest pain without acute coronary syndrome (ACS) [21], the intraobserver and interobserver agreement for the detection of any plaque per cross section was excellent (K = 0.95 and K = 0.93, respectively). The corresponding agreement was excellent for detection of calcified plaque (K = 0.96; K = 0.97) and very good for detection of non-calcified plaque (K = 0.76 and K = 0.73).
Quantitative Assessment
Method
Coronary CTA may also provide a quantitative three-dimensional assessment of plaque burden and vessel lumen geometry which had previously only been obtained on IVUS. Using dedicated computed software, geometric parameters including minimal luminal area, minimal luminal diameter, diameter stenosis and area stenosis can be quantified (Fig. 12.3). Furthermore, the total volume of plaque can be determined using a semi-automated method based on software detection of the inner and outer vessel walls over a length of the coronary artery (Fig. 12.4). Plaque volume is defined as the volume between the inner and outer vessel wall within a defined coronary segment. Using this approach, the volume of calcified and non-calcified plaque based on relative CT densities can also be derived and cross-sectional plaque area or burden, defined as [vessel area—lumen area]/vessel area, can be quantified.
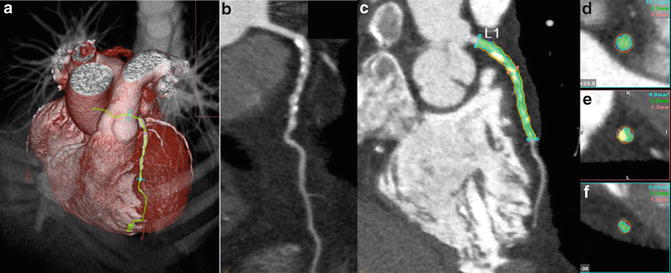
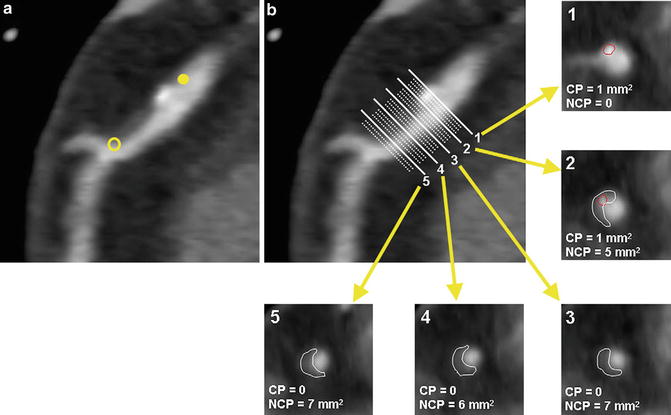

Fig. 12.3
Quantitative plaque assessment using CTA. (a) Volume-rendered image, (b) multiplanar reconstruction showing diffuse severe mixed plaque in left anterior descending artery, (c) quantitative assessment with blue lines indicating proximal and distal reference segment, red line indicating lesion. (d) Cross-sectional image of proximal reference segment, (e) cross-sectional image at lesion, (f) cross-sectional image of distal reference segment

Fig. 12.4
Plaque volume quantification. The length of the plaque is first determined (a). Cross-sectional tracing is then performed at each step increment along the longitudinal axis of the plaque to obtain plaque area (b). Calcified and non-calcified plaques are traced separately. (b1–5) Corresponding plaque volumes are calculated by multiplying sums of plaque areas by the step increment (Adapted from Cheng VY, Nakazato R, Dey D et al. Reproducibility of coronary artery plaque volume and composition quantification by 64-detector row coronary computed tomographic angiography: an intraobserver, interobserver, and interscan variability study. J Cardiovasc Comput Tomogr 2009;3(5):312–20. With permission from Elsevier)
Accuracy
Numerous studies have evaluated the accuracy and reproducibility of quantitative CT assessment using IVUS as reference standard. These studies have typically been performed by expert readers using selected high quality CTA datasets, after exclusion of significantly calcified or non-interpretable segments.
In a recent meta-analysis, Voros et al. identified 33 studies published between 2001 and 2010, including a cohort of 946 patients, in which the accuracy of 64-detector CCTA to qualitatively and quantitatively assess atherosclerotic plaque was compared with IVUS [22]. CCTA was demonstrated to have an excellent sensitivity (94 %) and specificity (92 %) to qualitatively detect atherosclerotic plaque (Fig. 12.5). Notably 22 of the included studies directly compared CT quantified vessel lumen area, plaque area, area stenosis and plaque volume against corresponding IVUS measurements. CCTA was found to slightly overestimate luminal area (0.46 mm2 or by 6.7 %; p = 0.005), while there was no significant differences in plaque area (0.09 mm2; p = 0.88), volume (5.3 mm3; p = 0.21) and percent area stenosis (−1.81 %; p = 0.12) (Fig. 12.6).
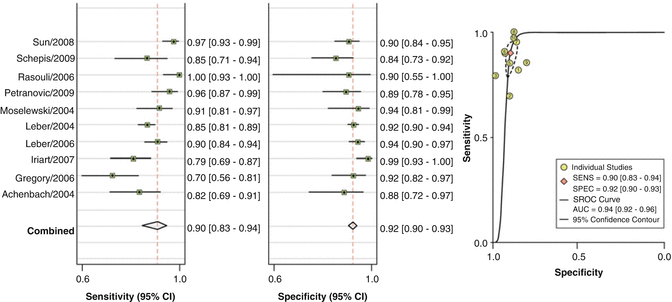
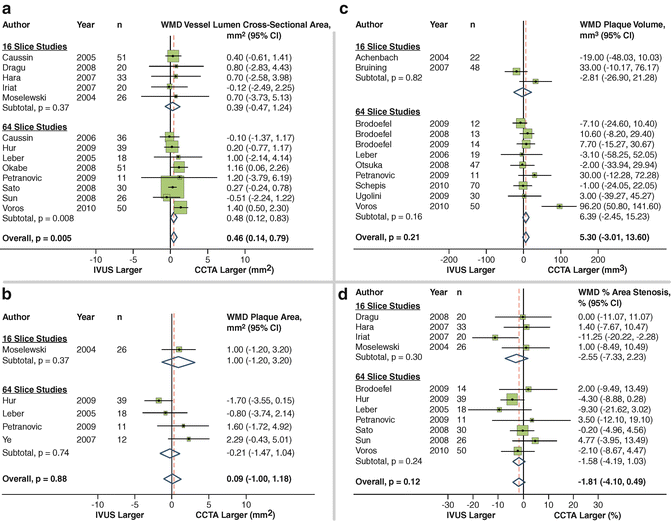

Fig. 12.5
Pooled sensitivity and specificity for coronary CTA vs. IVUS (Adapted from Voros S, Rinehart S, Qian Z et al. Coronary atherosclerosis imaging by coronary CT angiography: current status, correlation with intravascular interrogation and meta-analysis. JACC Cardiovasc Imaging 2011;4:537–48. With permission from Elsevier)

Fig. 12.6
Coronary CTA vs. IVUS to compare vessel lumen area (a), plaque area (b), plaque volume (c) and percent area stenosis (d) (Adapted from Voros S, Rinehart S, Qian Z et al. Coronary atherosclerosis imaging by coronary CT angiography: current status, correlation with intravascular interrogation and meta-analysis. JACC Cardiovasc Imaging 2011;4:537–48. With permission from Elsevier)
A number of studies have specifically evaluated the accuracy of CCTA to quantify the volume of calcified and non-calcified plaque using IVUS as the reference standard. Otsuka et al. demonstrated that in 76 plaques, CCTA marginally and non-significantly overestimated plaque volume in calcified and mixed plaques (p = 0.20) with a relative difference of 3 ± 17 % but significantly underestimated plaque volume in non-calcified plaques (p < 0.01) with a relative difference of 17 ± 19 % [23]. Voros et al. demonstrated in a 60-patient cohort identified to have intermediate stenoses that CTA overestimated plaque volume in calcified plaque with a relative difference of 64 ± 137 %, presumably as a result of blooming artefacts, and underestimated plaque volume in non-calcified plaque with a relative difference of 22 ± 47 % [24].
Reproducibility
The reproducibility of quantitative measurements of geometrical and compositional plaque volume remains an important requirement of any robust method to image atherosclerosis.
Geometric Measurements
Rinehart et al. demonstrated that the mean difference in quantifying minimal luminal diameter and minimal luminal area between two experienced observers were small (0.45 % and 0.43 %, respectively, with corresponding limits of agreement of ±11.8 % and ±18.5 %) [20] (Fig. 12.7). Similarly in a more recent publication, Nakazato et al. reported the mean difference in diameter and area stenosis between two observers were small (−2.6 % and −4.1 %, respectively, with limits of agreement of −25.3 to 20.1 % and −28.9 to 20.7 %, respectively) [25].
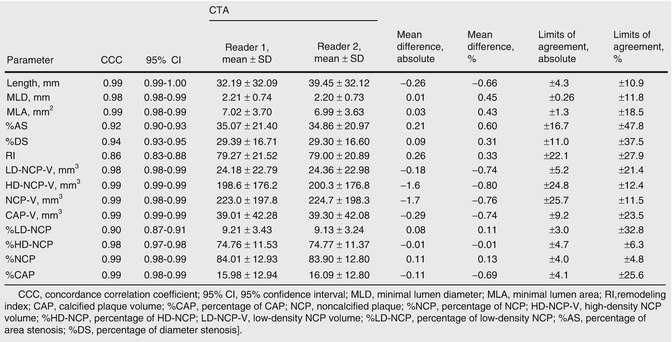

Fig. 12.7
Interobserver agreement for geometric and compositional parameters on a per-coronary segment basis (Adapted from Rinehart S, Vazquez G, Qian Z, Murrieta L, Christian K, Voros S. Quantitative measurements of coronary arterial stenosis, plaque geometry, and composition are highly reproducible with a standardized coronary arterial computed tomographic approach in high-quality CT datasets. J Cardiovasc Comput Tomogr 2011;5:35–43. With permission from Elsevier)
Quantification of Plaque Volume
Cheng et al. examined the interobserver, intraobserver and interscan variability of calcified and non-calcified plaque volume in a subset of 30 consecutive patients who had undergone two coronary CT angiograms within 200 days on two separate CT scanners [26]. The interobserver correlation was excellent with r values ranging between 0.83 and 0.99 although the limits of agreement were wide ranging from 87 to 226 %. Otzuka et al. demonstrated that reproducibility may be optimised using a dataset which excluded images with heavy calcification and image blurring [23]. Upon exclusion, the mean intraobserver and interobserver variability to quantify plaque burden was demonstrated to be 0 ± 16 % and 4 ± 24 %, respectively. Similarly Rinehart demonstrated that upon the use of standardised automated software and meticulous expert reader measurements in selected high quality coronary CTA datasets [22], the reported mean difference in calcified and non-calcified plaque volume was −0.74 % and −0.76 % with corresponding limits of agreement of ±23.5 % and ±11.5 %, respectively (Figs. 12.7 and 12.8).
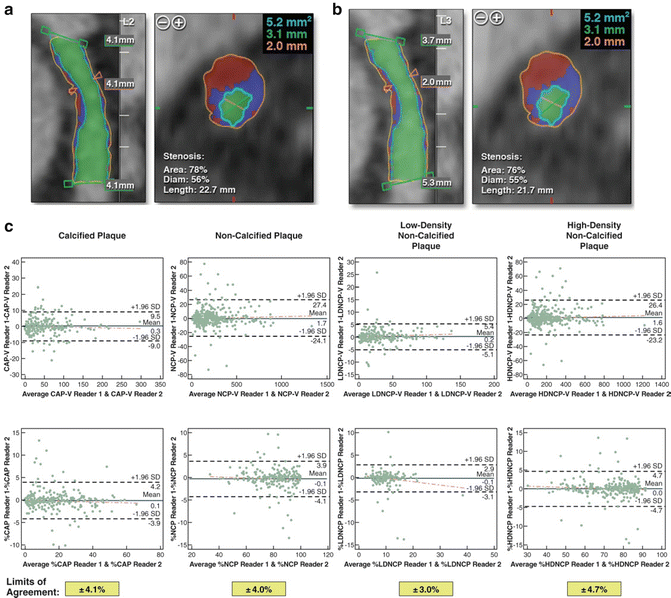

Fig. 12.8
Interobserver variability for calcified, non-calcified, low-density non-calcified and high-density non-calcified plaque (Adapted from Voros S, Rinehart S, Qian Z et al. Coronary atherosclerosis imaging by coronary CT angiography: current status, correlation with intravascular interrogation and meta-analysis. JACC Cardiovasc Imaging 2011;4:537–48. With permission from Elsevier)
Prediction of Clinical Outcomes Using Cardiac CT
In addition to plaque and stenosis assessment, multiple studies have demonstrated that the burden of CAD visualised on CCTA predicts future adverse events. CCTA meets three fundamental criteria as a good prognostic test: (1) it identifies patients at very low risk for events (2) it provides definition of clear gradations of risk based on tests results and (3) it enables the concentration risk in patients with abnormal tests [27].
Presence of Obstructive Disease on CTA Predicts Prognosis
Min et al. demonstrated in a single-centre consecutive cohort of 1,127 symptomatic patients that all-cause mortality was predicted by a number of angiographic features as assessed on CCTA including the presence of moderate (≥50 %) or severe (≥70 %) coronary stenosis in any coronary artery (p = 0.007 and p < 0.001, respectively) (Fig. 12.9), the presence of a severe stenosis in any proximal segment of a major epicardial vessel (p = 0.001) and the presence of obstructive left main or left anterior descending artery stenosis (p = 0.001) [28]. This study also demonstrated that CCTA-derived Duke prognostic CAD index, clinical coronary artery plaque score including a segment stenosis score and segment involvement score were significant predictors of all-cause mortality (p < 0.001) [28].
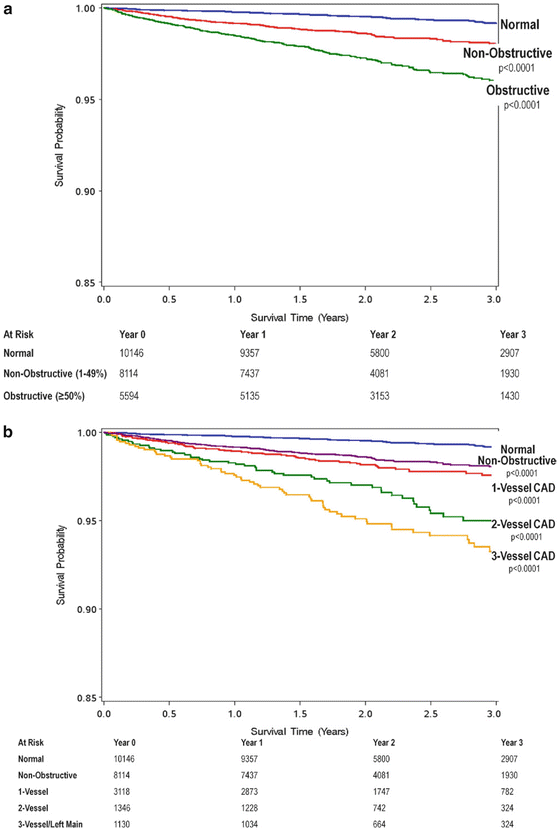

Fig. 12.9
Cumulative survival in patients with severe plaque. (a) 3-year Kaplan Meier Survival by the maximal per-patient presence of none, nonobstructive and obstructive CAD. (b) 3-year Kaplan Meier Survival by the presence, extent and severity of CAD by CCTA (Adapted from Min JK, Dunning A, Lin FY et al. Age- and sex-related differences in all-cause mortality risk based on coronary computed tomography angiography findings results from the International Multicenter CONFIRM (Coronary CT Angiography Evaluation for Clinical Outcomes: An International Multicenter Registry) of 23,854 patients without known coronary artery disease. J Am Coll Cardiol 2011;58:849–60. With permission from Elsevier)
In a pooled analysis of 18 coronary CCTA prognostic studies involving 9,592 symptomatic patients with predominantly suspected CAD [29], Hulten et al. demonstrated that the annual event rates for combined major cardiac events (including death, myocardial infarction and revascularisation) and death in patients with obstructive coronary disease defined as the presence of any lesion with ≥50 % stenosis was 8.8 and 2.2 % (Fig. 12.10), which was significantly higher (p < 0.005) than patients with non-obstructive disease (1.4 and 0.74 %) and normal coronary arteries on CCTA (0.17 and 0.15 %), respectively.
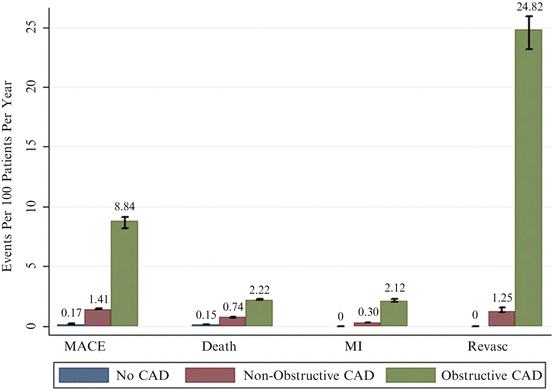

Fig. 12.10
Annual event rates stratified by CTA result (Adapted from Hulten EA, Carbonaro S, Petrillo SP, Mitchell JD, Villines TC. Prognostic value of cardiac computed tomography angiography: a systematic review and meta-analysis. J Am Coll Cardiol 2011;57:1237–47. With permission from Elsevier)
Similar findings were demonstrated using data from a large international multicentre registry (CONFIRM Registry) which included 24,775 patients at a mean follow-up of 2.3 years. It demonstrated that the presence of obstructive disease on CCTA not only risk stratified patients into clinically important risk tertiles [30], but was also a significant predictor of all-cause mortality and provided significant incremental value to LVEF and clinical variables with a net reclassification index of 17.8 % (p < 0.001) [31]. Furthermore using data from the same registry, Hadamitzky described the novel use of an optimised score which accounted for the number of proximal segments with a stenosis >50 % or with mixed or calcified plaque [32]. The use of this CCTA-based scoring system was demonstrated to significantly improve overall risk prediction beyond the National Cholesterol Education Program Expert Panel on Detection, Evaluation and Treatment of High Blood Cholesterol in Adults (ATP III) score [32].
Lastly normal findings on CCTA was found to be associated with very low event rates [28–31] which is comparable to the background event rate among healthy low-risk individuals (<1 %) [33] and is similar to that reported in patients with normal stress testing evaluated on echocardiography or nuclear myocardial perfusion imaging [34].
Presence of Non-obstructive Disease on CCTA Predicts Prognosis
Recently, in a cohort of 2,583 symptomatic patients identified to have non-obstructive coronary artery stenosis (<50 %) on CCTA and mean of 3.1 years follow-up, Lin et al. demonstrated that the presence of non-obstructive plaque was associated with higher mortality (hazard ratio (HR) 1.98, p = 0.03) when compared with normal findings, with the highest risk among patients who had non-obstructive CAD in three epicardial vessels (HR 4.75, p = 0.0002) and ≥5 coronary segments (HR 5.12, p = 0.0002) [35]. Importantly a higher mortality for non-obstructive disease was observed even among patients with low 10-year Framingham risk (3.4 %, p < 0.0001), as well as those with no traditional, medically treatable cardiovascular risk factors including diabetes mellitus, hypertension and dyslipidemia (5.7 %, p < 0.0001).
Predicting Acute Coronary Syndrome
CT Plaque Quantification
Verteylen et al. demonstrated that the use of a semi-automated plaque quantification algorithm may provide additional prognostic value in prediction of future ACS beyond conventional CT assessment of stenosis alone [36]. At a mean 26 ± 10 months, patients with ACS were found to have higher total plaque volume (94 vs. 29 mm3, p < 0.001), non-calcified plaque volume (28 vs. 4 mm3, p < 0.001) and plaque burden (57 % vs. 36 %, p < 0.01). Based on a receiver-operating characteristic model which incorporated semi-automated plaque quantification predicted ACS with an area under the curve of 0.79 which was significantly higher than the use of conventional CCTA reading and Framingham risk scores (0.64, p < 0.05).
CT Plaque Characteristics Predict Future ACS
Retrospective observational studies have identified a number of CT-based coronary plaque characteristics to be associated with culprit lesions for future ACS (Fig. 12.11). These include the higher frequency of non-calcified plaque [37], higher frequency of lipid-rich plaque subtype [38] or low attenuation plaque (LAP) (<30 HU) [39], larger plaque volume [40], positive remodelling [38–41], a pattern of spotty calcification [39, 40] and a napkin ring sign which is characterised by a peripheral rim of contrast surrounding the outskirt of plaque [40, 42]. The ring-like sign is speculated to either represent highly active vasa vasorum neovascularisation in the adventitia which surrounds the rupture prone plaque [42], intramural thrombus [43] or a large central lipid core surrounded by fibrous plaque tissue [43]. Lastly in patients with unstable angina CT features of plaque disruption including plaque ulceration and intraplaque dye penetration have been described to be modestly sensitive (53–81 %) and highly specific (82–95 %) for plaque erosion and or intraplaque haemorrhage as demonstrated on invasive angiography [44] (Fig. 12.12).
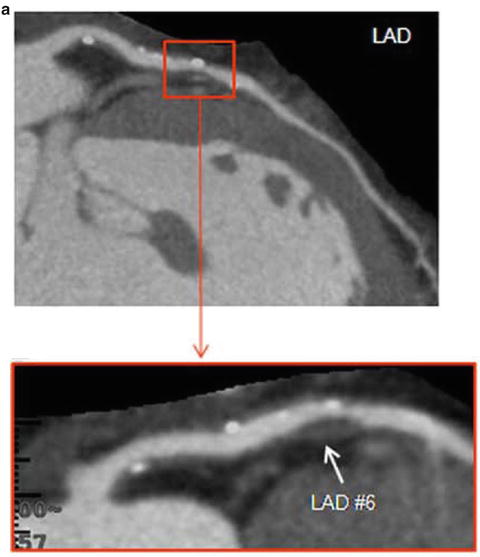
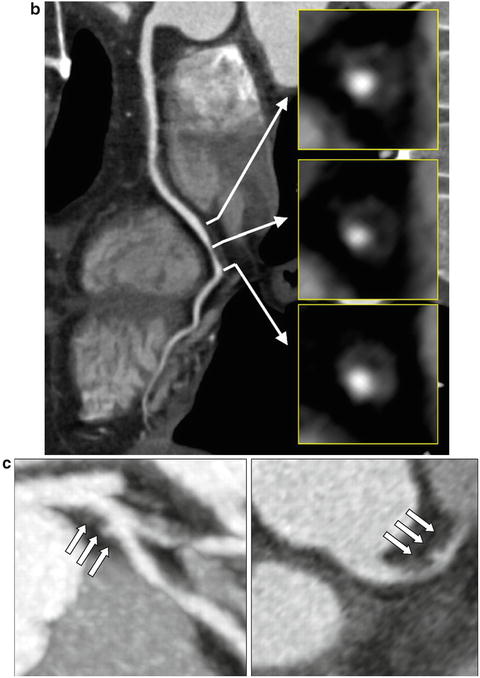
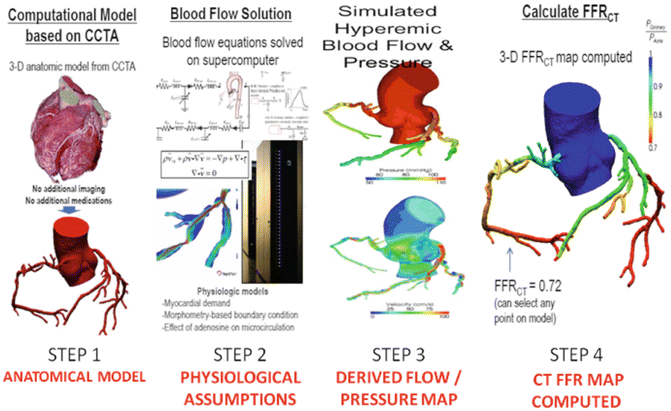


Fig. 12.11
Vulnerable plaque characteristics. Features of vulnerable plaque including the presence of low attenuation plaque, positive remodelling, spotty calcification (a), ring-like sign (b) and plaque ulceration with intraplaque contrast penetration (c). (a) Adapted from Motoyama S, Sarai M, Harigaya H et al. Computed tomographic angiography characteristics of atherosclerotic plaques subsequently resulting in acute coronary syndrome. J Am Coll Cardiol 2009;54: 49–57. With permission from Elsevier. (b) Adapted from Kashiwagi M, Tanaka A, Kitabata H et al. Feasibility of noninvasive assessment of thin-cap fibroatheroma by multidetector computed tomography. JACC Cardiovasc Imaging 2009;2:1412–9. With permission from Elsevier. (c) Adapted from Madder RD, Chinnaiyan KM, Marandici AM, Goldstein JA. Features of disrupted plaques by coronary computed tomographic angiography: correlates with invasively proven complex lesions. Circ Cardiovasc Imaging 2011;4:105–13. With permission from Wolters Kluwer Health

Fig. 12.12
Technique in derivation of CT FFR—Step 1: A three-dimensional model of the aortic root and coronary lumen is constructed using CTA images. Step 2: Assumptions are made regarding the properties of blood, basal total coronary flow, mean aortic pressure and total resistance coronary resistance. Step 3: Using a supercomputer, three dimensional models throughout the cardiac cycle representing the pressure and flow along all points of the arteries are generated during rest and simulated maximal hyperaemic conditions. Step 4: Based on the approximated pressure measurements, a non-invasive FFR based on CT is derived. (Adapted from [59] and [61])
Motoyama et al. demonstrated that in a large prospective study with a cohort of 1,059 patients, two CT angiographic features, LAP and positive remodelling, were associated with subsequent development of acute coronary events [45]. In this study, there were 45 patients who showed these two features, ACS developed in 10 (22 %), compared with 4 (0.5 %) of the 820 patients without positive remodelling or LAP. None of the 167 patients with normal angiograms sustained acute events (p < 0.001). Both features were independent predictors of acute coronary events (hazard ratio = 23, 95 % confidence interval 7–75, p < 0.001). Furthermore analyses of more than 10,000 coronary segments demonstrated significantly greater LAP volume (3.2 ± 0.5 mm3 vs. 0.5 ± 0.2 mm3, p < 0.001) and percent LAP/total plaque area (21.4 ± 3.7 % vs. 7.7 ± 1.5 %, p < 0.001) in eventful plaques compared with those not associated with future ACS. Importantly the plaques associated with early ACS (0–12 months) when compared with late ACS (12–24 months) had larger LAP volume (4.7 ± 0.51 mm3 vs. 2.0 ± 0.6 mm3, p < 0.001) and percent LAP/total plaque area (31.5 ± 4.5 % vs. 8.1 ± 5.2 %, p < 0.001).
Stay updated, free articles. Join our Telegram channel

Full access? Get Clinical Tree


