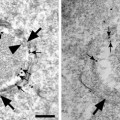
Fig. 1.
ESEM-IGL immunolabeling of anti-galectin-3 on 3T3 Swiss albino mouse fibroblast surface. (a) low magnification image (×6,000); (b) high magnification image (×12,000).
3.4 Image Analysis
Nanoparticle size and number evaluation is performed with XT Image Analysys Software (S.I.S F.E.I Co., The Netherlands). Nanoparticle size is calculated using the “arbitrary distance” measuring option.
Nanoparticle count is performed using the “touch-count” option on the database images, choosing ten randomly selected cell surface areas of 10 μm2 for each experiment (see Note 3). High magnification images (×12,000, working distance 7.5 mm) are used to provide the ability to distinguish label nanoparticles from precipitates, both for size and shape over large sample areas.
4 Notes
1.
To evaluate a specific cell membrane epitope, primary and secondary antibody concentrations must be optimized to minimize background signals. Briefly, to achieve an optimal image absent nonspecific signal, perform preliminary experiments using combinations of primary and secondary antibody concentrations on negative control preparations (cells not expressing the epitope). Select as upper limits the primary and secondary antibody concentrations that yield no signal. Then, use these concentrations for the IGL method on cell samples.
2.
Coverslips for light microscopy can be used as a cell growth substrate. It is important to seed the cells a few days before the experiment (the timing varies depending on cell types used) in order to obtain 70–80% semi-confluence. If the cells require a specific substrate for growth (i.e., collagen, fibronectin, etc.), cover the glass slides with the appropriate substrate prior to seeding the cells.
3.
Grid square area can be selected as a function of cell surface morphology and marking intensity. For example, if the cell surface is rough and/or presents a high degree of marking, it is more appropriate to select a grid with a reduced square area (3 or 5 μm2). In contrast, if the cell surface is flat and/or presents a low degree of marking, select an enhanced surface square area (15 or 20 μm2).
Acknowledgement
This research has been funded through the Ministry of Instruction, University and Research (MIUR), number 200734RMKE: Validation of molecular markers and technology innovation in environmental scanning electron microscopy (ESEM) for the clinical and prognostic setting of clonal proliferative thyroid lesions.
References
1.
Faulk W, Taylor G (1979) An immunocolloid method for the electron microscope. Immunochemistry 8:1081–1083CrossRef
2.
Hoyer LC, Lee JC, Bucana C (1979) Scanning immunoelectron microscopy for the identification and mapping of two or more antigens on cell surfaces. Scan Electron Microsc 3:629–636PubMed
3.
Related posts:
 Histochemical Detection of Lipid Droplets in Cultured Cells
 Colocalization Analysis in Fluorescence Microscopy
High-Pressure Freezing for Scanning Transmission Electron Tomography Analysis of Cellular Organelles
Colocalization Analysis in Fluorescence Microscopy
High-Pressure Freezing for Scanning Transmission Electron Tomography Analysis of Cellular Organelles
 Morphological Analysis of Autophagy
 Environmental Scanning Electron Microscopy in Cell Biology
Stay updated, free articles. Join our Telegram channel

Full access? Get Clinical Tree


