Fig. 1.
A schematic diagram of the environmental scanning electron microscopy (ESEM) graduated pressure column. Pressures range from very high vacuum conditions of 10−7 Torr at the electron gun to 10 Torr in the specimen chamber. Although the Pascal (N/m) is the SI unit for pressure, for the subatmospheric pressures in the ESEM, Torr is a more convenient unit with values typically ranging from 1 to 20 in the specimen chamber. 1 Torr is equivalent to 1 mm of mercury and 133.3 Pa. Atmospheric pressure is 760 Torr.
Ionizing collisions between electrons and the gas molecules in the specimen chamber create positive ions which are attracted onto the sample, neutralizing the specimen charge. It is therefore possible to image insulating samples without the need for metallic coating. The presence of water vapor in the chamber also means that a high relative humidity can be maintained in the microscope chamber such that samples can be imaged in a hydrated state without the need for fixation, dehydration, or critical point drying. Further details of the instrument and its operation can be found in Donald (4) and Stokes (5). In what remains of this section we highlight two aspects of ESEM imaging fundamental to the use of the protocols outlined in the following sections.
Correctly controlling the chamber conditions is critical when attempting to image hydrated specimens as the appropriate relative humidity is necessary to prevent excessive evaporation from, or condensation onto, the sample. The relative humidity at any given temperature can be calculated as the ratio of the pressure of water vapor in the chamber, to the saturated vapor pressure (SVP) at that temperature (empirically derived SVP values are tabulated in, for example (6)). Relative humidity is therefore a strong function of specimen temperature and it is vital that the temperature in the ESEM chamber is carefully controlled. This is done using a cooling stage which relies on the solid state “Peltier effect.”
The relationship between pressure, temperature, and relative humidity can be used to produce a phase diagram, delineating different thermodynamic regimes. The phase diagram for pure water is shown in Fig. 2. At conditions corresponding to points above the 100% relative humidity curve, the vapor is unsaturated and liquid water will evaporate from the specimen. If pressure and temperature conditions fall below this line, the vapor is saturated and water will condense onto the sample. Curves representing lower constant humidities may also be drawn onto such diagrams and can be used to define stable pressure and temperature conditions for specimens in the ESEM chamber. As the samples are not simply composed of pure water, the equilibrium relative humidity will certainly be less that 100%. However the exact value is sample dependent. In general it may be best to proceed cautiously by selecting the lowest temperature that the sample can tolerate, calculating the theoretical pressure corresponding to perhaps 95% relative humidity and then finding, by small adjustments, the pressure at which water begins to visibly condense. It is worth noting that for most systems the temperature set on the cooling stage may not correspond perfectly with the temperature at the surface of the specimen due to thermal transfer effects (7). Furthermore users may observe that condensation onto the sample is associated with an increase in sample temperature; this results from the liberation of latent energy due to the change of state.
Fig. 2.
The phase diagram for pure water. At conditions corresponding to points above the 100% relative humidity line, the vapor is unsaturated and evaporation of any liquid water will occur. If pressure and temperature conditions fall below this line, the vapor is saturated and water will condense out.
Consideration must also be given as to how the desired pressure is achieved. During the pumpdown sequence, the ambient air (pressure of 760 Torr) which is in the sample chamber when the door is closed, must be removed and replaced by water vapor at the appropriate pressure. This is achieved by pumping the chamber down to a certain pressure and then flooding it with water vapor. In this way, the dry air is replaced by water vapor. However, such a pumpdown sequence exposes the sample to both evaporative and condensing conditions which, if uncontrolled, may be damaging. Cameron and Donald (8) described the pumping sequence mathematically and optimized the procedure based on two criteria. Firstly, the sample should finish the sequence at equilibrium with saturated water vapor above it; secondly, evaporation and condensation should be minimized. The protocols described in the following sections adopt these optimized pumpdown procedures unless otherwise stated.
Once the chamber has been pumped down to the desired pressure the sample can be imaged. The electron beam interacts with the specimen producing a variety of signal types which may be collected using the appropriate detector and used to generate an image. In the following sections secondary electrons (SE) (a surface-sensitive signal) are used to image plant tissue and mammalian cells, whereas transmitted primary beam electrons (a signal sensitive to compositional contrast) are used to image bacteria.
The source of the electrons used in imaging is the same as for CSEM. Secondary electrons (SE) are emitted from the sample surface due to the action of the energetic (primary) beam electrons. They provide topographic contrast (5), with peaks emitting more SE and hence appearing bright, whilst troughs appear dark. SE images of the microlandscape therefore make intuitive sense. By convention, SE are classified as electrons with energies less than 50 eV (9) and as such they can only escape from a shallow region of the surface; this means that SE images offer high resolution. The techniques outlined in Subheadings 3.1 and 3.2 use a “needle detector,” developed by Toth and Baker (10) for SE imaging at gas pressures in excess of 15 Torr. A positive bias of 800 V is applied to a needle shaped electrode. The tip of the needle should be positioned at the same height as the final pressure limiting aperture, around 10 mm away from the beam axis. The electric field strength around a sharp edge can be extremely high (11) and this configuration produces an intense ionization cascade in a region to one side of the beam axis, which extracts and amplifies the SE signal despite the presence of gas scatterers. The needle detector and gaseous amplification cascade are represented schematically in Fig. 3.
Fig. 3.
A schematic diagram of the gaseous amplification cascade around the needle detector. Ionizing collisions mean that many electrons are derived from the original one.
By using ESEM in combination with a transmitted electron detector, the ESEM-STEM (scanning transmission electron microscopy) technique, makes it possible to probe beneath the surface of hydrated, unprepared samples. This technique is discussed in Subheading 1.3 with reference to imaging bacterial specimens. In STEM images of unaltered bacteria, contrast arises from differences in mass-thickness, whether natural in origin (e.g., plastic accumulations in Cupriavidus necator (12), hematite crystals in magnetotactic bacteria or the gap between a bacterium’s inner and outer membrane) or artificial (dehydration-induced collapse). For bacteria which have not been metal-coated, an SE and an ESEM–STEM image look similar, with STEM typically being much sharper and having increased contrast (see Figs. 11 and 14).
In what remains of this section, we introduce three basic sample types and the specific examples that feature in the protocols described in Subheadings 2 and 3. Supporting notes can be found in Subheading 4 and the safe handling of live biological material in the microscopy lab is considered in the Appendix.
1.1 ESEM Imaging of Plant Tissue
Plant surface tissues, with their thick cell walls and waxy cuticles, represent relatively robust, dehydration-resistant samples and as such are well suited to ESEM imaging. By studying the changes in water content of Allium cepa (onion) cells held in the ESEM chamber at a range of humidities, Zheng et al. (2) established that without the electron beam, plant cells could be maintained in a hydrated, viable state if the chamber humidity was above 90%. With the electron beam on, viability is dependent on the imaging parameters of the instrument. The protocol for imaging the epidermis of Tradescantia andersonia described in Subheadings 2.1 and 3.1 was developed to allow a sequence of secondary electron images of closing stomatal pores to be produced (see Note 1). As such the sample temperature and pressure are relatively high, and electron doses low, but it should be noted that many variations are possible depending on the sample and the aim of the experiment. Here we describe aspects of the imaging protocol; for details of stomatal closure experiments, consult McGregor and Donald (13).
1.2 ESEM Imaging of Mammalian Cells
To image hydrated samples, it is necessary that surface water is removed by evaporation in order to expose the top surface of the object of interest. In the case of mammalian cells, removing this liquid layer leads to a loss of membrane integrity. This means that ESEM imaging of live mammalian cells is not possible (14). As this precludes imaging dynamic cellular processes, little is lost by fixing these samples. Fixation is known to stabilize cells for imaging, protecting against any damage resulting from the chamber conditions (15). Although the samples are fixed, they are not metal coated or dehydrated, as they would be for CSEM, but rather the water vapor present in the ESEM sample chamber maintains a humid environment and provides an alternative charge neutralization mechanism. The mammalian cells protocol presented in Subheadings 2.2 and 3.2 is based around the authors’ experiences imaging human monocyte-derived macrophages and an oligodendrocyte/dorsal root ganglion (DRG) coculture. These cells were chosen as test subjects as they exhibit many delicate membrane structures vulnerable to preparation damage.
1.3 ESEM–STEM Imaging of Bacteria
It is possible to image bacteria unfixed in the ESEM as they are more resistant to the challenging environment of the chamber, most likely due to their thick cell walls which confer better resilience to osmotic shock than the finer cell membrane of the mammalian cell. However, there are a number of factors which can damage bacterial cells during imaging, so conditions must be carefully controlled. It should be noted that although samples can be imaged live, it may be challenging to observe dynamic processes in these samples for two reasons: (1) at the low temperatures necessarily used to maintain humidity, it is likely many biological process will be very slow, and (2) bacteria are imaged in pure water with no oxygen or carbon dioxide, so they will be both starved and lacking essential gases. The protocol described in Subheadings 2.3 and 3.3 focuses on ESEM–STEM imaging but SE imaging is also possible (see Note 2).
2 Materials
In the following section the chemicals, equipment, and microscope accessories needed to image each of the three sample types are listed separately.
2.1 ESEM Imaging of Plant Tissue
1.
Needle detector or gaseous secondary electron detector (GSED).
2.
Peltier cooling stage.
3.
A metal plate attachment for the Peltier cooling stage, large enough to accommodate the leaf.
4.
Large adhesive carbon pads.
5.
A sharp razor blade or scalpel.
6.
A suitable plant, ideally located close to the imaging facility to minimize tissue transfer time.
2.2 ESEM imaging of Mammalian Cells
1.
Needle detector or GSED.
2.
Peltier cooling stage and appropriate metal sample mounting stub.
3.
Standard 0.01 M, pH 7.4 phosphate buffered saline (PBS) solution. This can be bought as a 10× concentrated stock solution or in tablet form to which the appropriate amount of distilled water should be added.
4.
4% Glutaraldehyde fixative solution. To produce 100 mL of 4% glutaraldehyde solution, add 8 mL of 50% stock glutaraldehyde (purchased) to 92 mL of PBS.
5.
Distilled water.
6.
Pipette.
7.
Suitably sized glass coverslips or other sample substrate.
2.3 ESEM–STEM Imaging of Bacteria
1.
The work described in this section uses an ESEM–STEM detector manufactured by FEI Company, but a home built version may be assembled from a Peltier stage and a backscattered electron detector—this is described in more detail in ref. (16).
2.
Copper TEM grids (see Note 3) with a rectangular mesh of 300 lines per inch or greater and coated with unbroken carbon film, are needed as substrates for the imaging the sample.
3.
Benchtop centrifuge.
4.
Eppendorf tubes.
5.
Distilled water.
6.
0.1–2.5 μL adjustable pipette with fine-pointed disposable plastic tips. The tips should be of the aerosol barrier type (known as filter tips) to prevent contamination.
7.
70% Ethanol.
8.
Appropriate means for sample handling and waste disposal (see Appendix).
3 Methods
The following sections outline step-by-step instructions for users who wish to use the ESEM technique to image plant tissues, mammalian cells, or bacteria, respectively.
3.1 ESEM Imaging of Plant Tissue
3.1.1 Prepare the Microscope and Cooling Stage
1.
Ensure that the microscope chamber is set up to operate in wet mode and the needle detector or GSED is in place.
3.
Attach an adhesive carbon pad (see Note 5) to the cooling stage and set the desired temperature. For dynamic experiments, a temperature similar to the ambient growth conditions for the plant may be advantageous. A compromise must be struck as at higher temperatures higher pressure of water vapor are necessary to maintain a high relative humidity and this can degrade the image quality. In the stomatal closure experiments from which this protocol is drawn, a temperature of 7°C was used. Stabentheiner et al. (17) work at 5°C degrees and if static morphology is of principle interest there is no reason why the sample may not be cooled further provided that the tissue does not begin to freeze.
3.1.2 Prepare the Tissue
1.
Tradescantia andersonia was used in the experiments described here.
2.
Cut the section of the epidermis that will be imaged, minimizing the area of cut mesophyll that will be exposed to the partial vacuum (see Note 6). Using a sharp blade minimizes structural damage to the tissue.
3.
Transfer the cut tissue as quickly as possible to the adhesive carbon tab on the cooled specimen stage. The setup in the microscope chamber is demonstrated in Fig. 4.
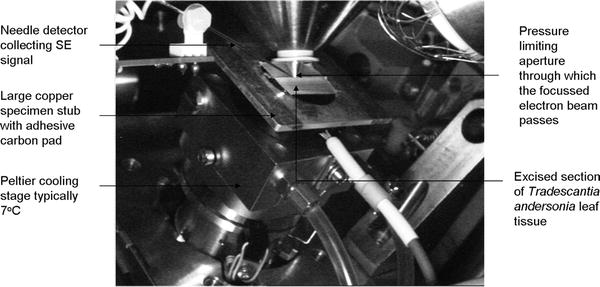
Fig. 4.
Chamber setup. An annotated CCD image of the interior of the ESEM chamber. The stage may be tilted to better expose the topography.
3.1.3 Pumpdown and Final Pressure
1.
2.
Theoretically the optimum pumpdown sequence for our sample at 7°C involves eight cycles between a lower pressure of 7.3 Torr and an upper pressure of 12.6 Torr. A final pressure of 7.3 Torr of water vapor produces a relative humidity of 97% for specimens cooled to 7°C. A variety of final pressure and temperature conditions have been explored by other authors (see Note 7).
3.
As discussed previously, high relative humidity achieved by low temperature and low pressure conditions is likely to be favorable for imaging, particularly at low voltage, whereas high relative humidity generated by higher temperature, higher pressure conditions is potentially more suited to dynamic experiments on active cells, such as imaging stomatal movements. The chamber conditions necessary to maintain a sample in a suitable condition for imaging is highly sample dependent (see Note 8) (17).
3.1.4 Imaging
1.
All the experiments described here were conducted using an FEI XL30 FEG ESEM and involved detecting the secondary electron (SE) signal which provides topographic contrast.
2.
The needle detector, developed by Toth and Baker (10) and capable of imaging at high gas pressures, is used to collect this SE signal.
3.
An accelerating voltage of 3–10 kV is recommended; the beam voltage should be as low as possible, determined by the instrument performance, particularly if sample viability is an important factor (see Note 9). Two example images are presented in Fig. 5 and 6.
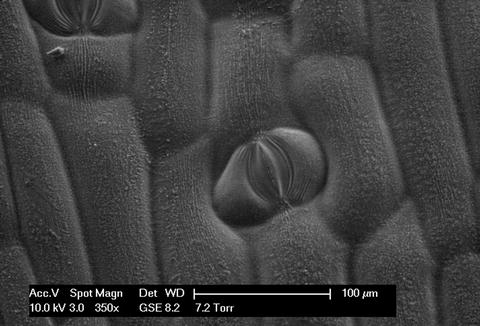
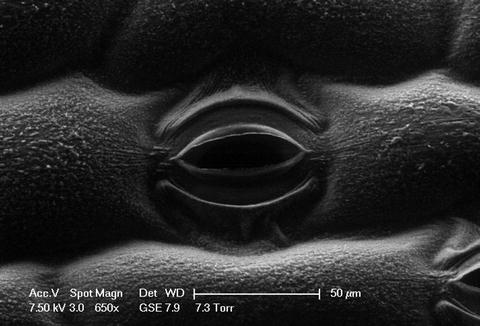
Fig. 5.
A secondary electron image of a closed Tradescantia stomatal pore in a region of elongated epidermal cells close to a vein.
Fig. 6.
A secondary electron image of a single Tradescantia stomatal pore, partially open. The stage is tilted to enhance the topographic contrast.
3.1.5 Beam Damage Considerations
1.
It is important to ensure that the features observed are not artefactual i.e., a result of damage due to the beam or the chamber conditions. It is good practice to compare the final image of the area of interest with the initial images and to image a region of epidermis not previously scanned for comparison.
2.
Beam damage can be minimized by lowering the beam voltage (see Note 10
 Histochemical Detection of Lipid Droplets in Cultured Cells
Environmental Scanning Electron Microscopy Gold Immunolabeling in Cell Biology
Histochemical Detection of Lipid Droplets in Cultured Cells
Environmental Scanning Electron Microscopy Gold Immunolabeling in Cell Biology
 Colocalization Analysis in Fluorescence Microscopy
 Atomic Force Microscopy Functional Imaging on Vascular Endothelial Cells
 Imaging Non-fluorescent Nanoparticles in Living Cells with Wavelength-Dependent Differential Interference Contrast Microscopy and Planar Illumination Microscopy
 Stereology and Morphometry of Lung Tissue


Related posts:
Histochemical Detection of Lipid Droplets in Cultured Cells
Environmental Scanning Electron Microscopy Gold Immunolabeling in Cell Biology
Colocalization Analysis in Fluorescence Microscopy
Atomic Force Microscopy Functional Imaging on Vascular Endothelial Cells
Imaging Non-fluorescent Nanoparticles in Living Cells with Wavelength-Dependent Differential Interference Contrast Microscopy and Planar Illumination Microscopy
Stereology and Morphometry of Lung Tissue
Stay updated, free articles. Join our Telegram channel
Full access? Get Clinical Tree
