(1)
Clinical Department, Urals Research Centre for Radiation Medicine, Chelyabinsk, Russia
Abstract
The previous chapter outlines the basic understanding of CRS, its classification, and its clinical picture, which were described mainly in the 1950s–1960s on the basis of the follow-up of the nuclear reactors personnel affected by γ-exposure at doses significantly exceeding the maximum permissible level. As a result of accidental and scheduled releases of radioactive waste into the Techa River the residents of the riverside settlements were also affected by long-term radiation exposure due to both increased level of radioactive γ-contamination of the floodplains and territories of the settlements, and bodily intake of radionuclides (predominantly 89Sr, 90Sr, 137 Cs) with river water and local foodstuffs (milk, vegetables, potatoes, etc.). A special regular medical follow-up of the exposed population was initiated 2 years after the onset of releases, and it has continued up to present day. Initially, 1159 CRS cases were diagnosed in residents of the Techa and Iset riverside settlements. The subsequent long-term follow-up allowed the verification of CRS diagnosis in 66 patients.
The previous chapter outlines the basic understanding of CRS, its classification, and its clinical picture, which were described mainly in the 1950s–1960s on the basis of the follow-up of the nuclear reactors personnel affected by γ-exposure at doses significantly exceeding the maximum permissible level. The total amount of CRS cases registered among the staff of Mayak PA was 2,326, and 1,997 cases were validated. Almost all the workers with CRS were hired in the period of maximum radiation exposure (1948–1953). The largest number of cases was diagnosed at the radiochemical plant in 1950–1953. The age of the majority of patients at the time of CRS diagnosis was 21–30 years. The mean dose of γ-exposure in men with CRS was 2.02 ± 0.03 Gy and in women 1.72 ± 0.04 Gy. The vast majority of CRS cases (73 %) were registered among men (Azizova et al. 2007).
In contrast to the Mayak PA personnel, represented mainly by apparently healthy young men, the population of the riverside villages was much more heterogeneous in terms of age, sex, initial health status, and other factors that can modify man’s radiosensitivity. Another specific feature of the population is the nature of exposure. It was determined by the dynamics of organ dose formation and distribution of the absorbed dose in the body due to the intake of a significant amount of 90Sr. 90Sr intake led to the exposure of red BM (RBM) and bone tissue to the largest doses. The cumulative radiation dose to RBM was formed over a longer period of time (up to 1960 inclusive) than the dose of γ-exposure (which was predominantly formed in 1950–1952).
2.1 Releases of Radioactive Waste and Radioecological Situation in the Techa River Basin
The Mayak Production Association (Mayak PA) was set up at the South Urals late in the 1940s for the purpose of producing weapon plutonium and processing fission materials. The Mayak PA incorporated the following facilities: uranium–graphite reactor on natural uranium (plant “A”), radiochemical facility for separation of 239Pu from uranium irradiated in the reactor (plant “B”), chemical–metallurgical facility for producing metallic plutonium (plant “C”), and radioactive storage complexes (“D”). Due to a steadily increasing rate of plutonium production at the Mayak PA (six reactors were put on line in 1948–1955), as well as the lack of reliable waste management and waste storage technology, a portion of sewage waters containing radioactive materials was released into the Techa River beginning in 1949 (Akleyev and Kisselyov 2001).
Scheduled and accidental liquid radioactive wastes (LRW) of the radiochemical plant were released into the Techa River. Scheduled releases consisting of a combination of non-technological sewage waters with low and medium specific activity (cooling water of radiochemical plant units, laundry and laboratory waters, water used in deactivation of equipment and premises) and technological solutions with a high specific activity differed in total activity and radionuclide composition in 1949–1956. The major part (~99 %) of the specific activity of short-lived radionuclides with half-lives less than 15 days (131I, 147Nd, 143Pr, 140Ba) and with medium half-life (95Zr, 89Sr, 91Y, 103Ru, 141Ce) entered the river with scheduled releases, predominantly with non-technological LRW (Glagolenko et al. 2008). Along with scheduled discharges into the Techa River, there sometimes occurred accidental releases. For example, in cases when due to corrosion of cooling tubes, radionuclides from storage tanks of high-level waste got into drainage or cooling waters.
According to new estimates, the total discharge of activity into the Techa River (1949–1951) was approximately 4.9 million Ci (including 2.9 million Ci from scheduled and at least 2.0 million Ci from accidental releases). With scheduled releases, virtually all short-lived radionuclides (131I, 140Ba, 147Nd, 147Pm) and the major part (60–80 %) of radionuclides with medium half-life (95Zr, 89Sr, 144Ce, etc.) entered the Techa River. The main part (~70 %) of long-lived uranium fission products (90Sr, 137Cs) was discharged into the Techa River with accidental releases in October 1951 (Fig. 2.1). In the first and second decades of October 1951, unprecedented, in terms of scale, uncontrolled release of LRW into the Techa River with total activity of about 1.23 · 106 Ci occurred. The major part (60 %) of the activity of long-lived fission products with half-lives longer than 1 year (90Sr, 137Cs, 147Pr, 125Sb, 155Eu, etc.) entered the Techa River with this accidental release (Glagolenko et al. 2008).
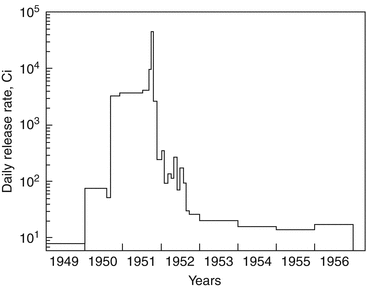

Fig. 2.1
Discharge dynamics of LRW of Mayak PA into the Techa River in 1949–1956 (Glagolenko et al. 2008)
From October 28, 1951, all major technological wastes were routed to Karachay Lake, while the discharges into the Techa River of cooling and drainage waters, as well as of low-activity waters from the laundry and sanitary checks, continued. Detailed information concerning the discharges into the Techa River is presented in a series of special publications (Akleyev and Kisselyov 2001; Shoygu 2002; Mokrov 2002; Glagolenko et al. 2008).
The discharges resulted in a considerable contamination of all the components of the Techa River ecosystem (water, bottom sediments, floodplain, vegetation, biota) and overexposure of the residents of the riverside settlements.
The radionuclide content in water considerably decreased with distance from the release site which was due to radioactive decay, dilution and scatter of the admixture in the water flow, and sedimentation and sorption of radionuclides by bottom sediments and hydrobionts. The highest decrease in radionuclide content in water was observed in the upper reaches of the Techa River (in settling reservoirs), which is primarily due to the processes of sedimentation and sorption prevailing in this part of the river because of a slow current. Approximately 70 % of the total released activity was deposited in storage reservoirs. The most dramatic decrease in the radionuclide content in the river water observed during the period of massive releases (1950 and 1951) was largely due to the absorption of radionuclides by bottom sediments and biomass. In this period, the bottom of the river became a repository for large amounts of radioactive matter, and later on, it became a powerful source of secondary contamination of the river water (Kostyuchenko et al. 2012).
Long-term dynamics of radionuclide content in the river water until the mid-1990s was characterized by steady decrease in the concentration of 90Sr and 137Cs. Radioactive contamination of the Techa River waters was determined by the radionuclide content in floodplain soils and bottom sediments, as well as by their washout from the technical reservoirs located in the upper reaches of the river. Currently, the contamination of the river water is still determined by 90Sr and 137Cs coming from the reservoirs № 10 and № 11 of the Techa River Cascade (Kostyuchenko et al. 2012). The data concerning the plutonium isotopes content in the river water are limited. Thus, in 1990, the specific activity of 238Pu, 239Pu, and 240Pu in the middle reaches of the river (Nadyrov Most, Muslyumovo) made up 0.35–0.52 Bq/m3. In the lower reaches of the river (Zatechenskoe village), the content of 238Pu and 239Pu in water was 0.12 Bq/m3 (Akleyev and Kisselyov 2001).
As it has been noted above, the bottom sediments of the river became a repository for large amounts of radioactive matter, and later on, after decrease in radionuclide content, it became a powerful source of secondary contamination of the river water. The highest radionuclide concentration in bottom sediments occurred in the river parts located in the release site and at the site of the Assanov swamps (30 km). Most of the activity of the bottom sediments was concentrated in the surface layers. Shale and silt accumulated radionuclides more and sandy soils less. It was found out that 137Cs and plutonium isotopes are absorbed extensively by all types of soil. 90Sr is also well absorbed by soils and easily enters exchange reactions, which determines its high migration ability (Akleyev and Kisselyov 2001).
Concentrations of 90Sr and 137Cs were ten to hundred times higher in bottom sediments and floodplain soils than in water. The highest radionuclide concentration was observed in the upper reaches of the river with a gradual decline from the dam of the reservoir № 11 to the village of Muslyumovo.
Spring floods on the Techa River, especially the flood of 1951, were the main factors which caused the extensive radioactive contamination of the riverside area. In the early 1950s, the total area of floodplain soils inundated in the flood period was significantly greater than nowadays because at that time almost every village along the Techa River had small dams for water mills. The biggest change in the width of the river during the flood occurred in the upper reach. In the area of the Assanov swamps, the overflow of the river reached 3,000 m. The width of contaminated floodplain usually did not exceed 150–200 m. Loamy soil, black soil, and swampy meadow floodplain soils rich in turf with slightly decomposed humus contributed to the sorption of radionuclides at floodplain inundation. Natural decrease in the level of contamination of floodplain soils with distance downstream from the release site was noted. Floodplain soil contamination, as a rule, was determined by soil relief.
Until the mid-1990s, major (70–80 %) source of the river water contamination was swampy floodplain near the Assanov swamps. Washout of 90Sr from the floodplain results both from the interaction of the river water with contaminated floodplain soils during the flood and from downsloping and groundwaters that flow out of the floodplain into the riverbed. Nowadays, the major sources of secondary radionuclide contamination are floodplain and bottom sediments of the upper reaches of the Techa River. The state of these river system components determines the current radiation situation, whereas the level of their radioactive contamination in its turn is determined by inflow of radionuclides from the Techa River Cascade. A detailed description of radioecological consequences of the Techa River contamination is presented in a series of monographs (Akleyev and Kisselyov 2001; Akleyev et al. 2001; Akleyev 2006; Shoygu 2002).
2.2 A Brief Socioeconomic Characteristics of the Region and the Population of the Techa Riverside Area
Techa River is one of the small lowland rivers with low open banks. It flows out of the Lake Irtyash and is a component of the Techa–Iset–Tobol–Irtysh–Ob river system belonging to the Kara Sea basin of the Arctic Ocean. Techa River flows in an eastward and northeastward direction and empties into the river Iset (Fig. 2.2). The total length of the riverbed is 243 km. The river network is weak, the tributaries are few and not very long, and most of them dry up by midsummer. The main tributaries are the rivers Mishelyak, Zyuzelka, Baskazyk, and Shutishka. The river width is 5–20 m and depth is 0.5 up to 5 m in the reaches. Techa River flows in a wide (up to 5 km) valley. The banks are low, the bottom of the river is silty, the river course has many turnings, and it is often divided into branches and channels. The floodplain is wide, one-sided, left-bank, 2.0–3.5 km wide, up to 0.1–0.8 km in narrower places, swampy, and covered with mounds. It is flooded every year with the water rising by 0.2–2.0 m, its drop is 145 m, and the mean slope is 0.6 ‰. River channel is moderately meandering and branched. The current velocity is generally slow from 0.1 to 0.4 m/s., sometimes to 0.8 m/s., depending on the season (Akleyev and Kisselyov 2001; Shoygu 2002).
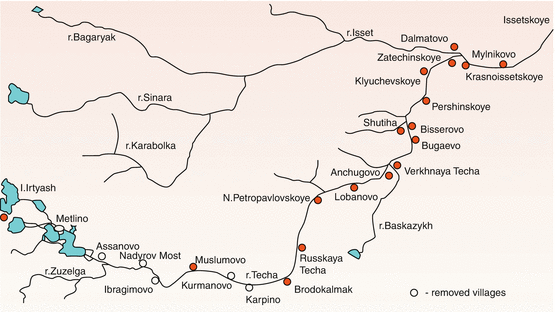

Fig. 2.2
Schematic map of the settlements in the Techa River basin
Watershed area of the river is 7,600 km2. The total forestry area is 32 %; swamps, 8 %; and lake surface, 7 %. The catchment area is full of lakes and swamps. Most of the lakes are without outflow; many of them, being connected to each other, form systems. Techa River gets most of its water supply from melted snow (80 %) and discharges of water from the lakes of the Kasli water system and belongs to the type of rivers characterized by high water in spring and low mean water in summer. Two tributaries in the upper stretches of the river, Mishelyak and Zyuzelka, are rather shallow; Mishelyak dries up almost every year. Upstream of the outfall of the river Mishelyak, there is a wide overgrown marshy floodplain, which serves as a depot for the melted snow, which exerts a considerable influence on the condition of the river. Due to the discharges from the tributaries, the rise in water level during spring floods is distinctly higher downstream of Muslyumovo. Usually, floods occur in April and reach their maximum when the ice starts to thaw (Akleyev and Kisselyov 2001; Shoygu 2002).
The mountainous part of the Techa River basin consists of crystalline shales, granites, and greenstone tuffs. The flat part is loamy. In lofty areas, the topsoils are dark gray and gray and in low areas meadow black, and occasionally, lixiviated soils are found. The mountainous and submountainous parts of the river basin are covered by mixed woods (fir tree, pine tree, birch). In the lower part of the catchment area, as the relief flattens, the country changes into a forest steppe, the natural growth being represented by birch–aspen woods and groves.
As it has already been mentioned, initially Lake Irtyash was considered to be the source of the Techa River with water passing through Lake Kyzyltash. In the 1950–1960s in the upper reaches of the river, Mayak PA created six water storage facilities for storage of medium- and low-level radioactive waste (Fig. 2.3), which acquired the name of Techa River Cascade. To isolate them from the open hydrographic network and to intercept surface runoff, bypass channels 26.7 and 32 km length were laid along the right and left banks of Techa River Cascade, which flow into the Techa River downstream the dam closing Techa River Cascade, thus forming a new source of the river. Downstream the dam of the reservoir № 11, the river retained its natural riverbed.
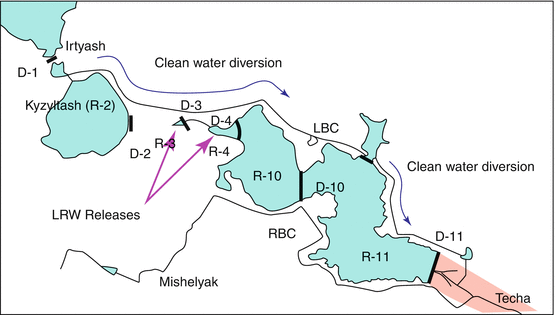

Fig. 2.3
Scheme of the Techa River Cascade (RBC the right-bank channel, LBC the left-bank channel, R-2, R-3, R-4, R-10, R-11 reservoirs of the TRC, D-1, D-2, D-3, D-4, D-10, D-11 the dam of the respective reservoirs)
The Techa River carries its waters to the Iset River, whose water discharge at the confluence is ten times higher. Good gustatory qualities of the river water and the availability of fertile floodplain with a distinct shoreline were the reasons why riverside had been chosen as a place for building settlements and agricultural use. In 1950, there were 41 settlements on the banks of the Techa River. Most of the settlements were small villages and hamlets with the population of less than 500 people, typical of rural areas of Trans-Urals. A specific feature of the layout of the settlements was their location parallel to the Techa River (Akleyev et al. 2001).
Techa River flows through the territory of five administrative rayons of Chelyabinsk oblast (Kaslinsky, Argayashsky, Sosnovsky, Kunashaksky, and Krasnoarmeysky) and two rayons of the Kurgan oblast (Kataysky and Dalmatovsky). At the beginning of 1950, 26 settlements were located on the banks of the river within the Chelyabinsk oblast and 15 settlements within the Kurgan oblast (Fig. 2.2). At the present time, the residence area of the population exposed on the Techa River is 21,594 km2 or 13.5 % of the total area of the Chelyabinsk and Kurgan oblasts. Within the area of the Chelyabinsk oblast, the territory of the above-mentioned five administrative rayons makes up 15,374 km2 or 17.5 % of the total territory of the Chelyabinsk oblast. Within the Kurgan oblast, the total area of the Dalmatovsky and Kataysky rayons is 6,220 km2 or 8.7 % of the total area of the oblast (Akleyev 2006).
At the beginning of 1950, there were approximately 23,500 residents in the riverside villages. Of that number, 58.2 % were women and 41.8 % men. The numerical prevalence of women was the consequence of World War II and was especially manifested in the age range 20–60 years. The Techa riverside population was very heterogeneous in terms of ethnicity. The three most numerous ethnic groups were Russian, Bashkirs, and Tatars. The number of representatives of other ethnic groups (the Mordovians, the Chuvash, the Udmurts, the Kazaks, Germans, Jews, and others) in total did not exceed 5–10 % of the population of any administrative rayon. Four of the seven areas were inhabited predominantly by Slavs (mostly Russians). Argayashsky and Kunashaksky rayons consisted mainly of Tatars and Bashkirs with the prevalence of the former and the latter at different locations. The proportion of Slavs in these rayons is not high (29 and 17 %, respectively). An important characteristic is the homogeneity of the ethnic composition of most small- and medium-size villages in which 95–98 % of the population was represented by one of the ethnic groups (Akleyev et al. 2001).
Inadequate development of the health-care system, typical of rural rayons of the Chelyabinsk and in particular of the Kurgan oblasts, determined the standards of medical assistance and affected the reliability of reports on the morbidity and mortality among the population. According to the data of the medical statistics, the epidemiological situation in the riverside villages prior to radioactive discharges into the river did not differ from that in the neighboring agricultural areas. Of infectious diseases, outbreaks of digestive infections and helminth diseases were commonly observed. The area was endemic for brucellosis.
In terms of economy structure, the Techa riverside in 1950 represented a typically agricultural area. Population was employed in collective farms and state farms and had private household farms. They grew vegetables, potatoes, and cereals and produced meat and dairy products. The key line of production activities pursued in the riverside villages of the Kurgan region was cereal growing, mainly wheat. Garden plots, pastures, and hayfields were mostly situated on the floodplain and river water meadows. Floodplain soils were characterized by a relatively high fertility; grass vegetation was well developed. Residents of the riverside villages intensively used floodplain pastures for cattle grazing. Natural pastures, hayfields, crops of annual and perennial grasses, and other forage crops contributed to the development of dairy and beef cattle breeding. The villages also had facilities processing produced agricultural raw materials and products (meat and milk, flour and cereals, leather, woolen goods, etc.).
For local residents, the river was the major and often the only source of drinking and household water supply. The amount of wells was insufficient; they were used only by part of the population and not for all purposes, as well water in these areas is not as tasty as river water. River water was also used for watering livestock, poultry breeding, watering gardens, fishing, bathing, and other domestic, household, and practical needs.
As a result of radioactive contamination of the river system components (water, bottom sediments, floodplain soils), residents of the riverside settlements were affected by both external exposure due to the increased γ-background along the banks of the river and internal exposure due to significant intakes of a mixture of radionuclides with water and locally produced foodstuffs.
2.3 Exposure Doses Received by Patients with Chronic Radiation Syndrome
As it has been noted above due to a steadily increasing rate of plutonium production at the Mayak PA in 1948–1955 as well as the lack of reliable waste management and waste storage technology, insufficient knowledge about the behavior of radionuclides in environmental media, and their impact on the health status of man, a portion of sewage waters containing radioactive materials was released into the Techa River beginning in 1949. Until July 1951, the releases were virtually uncontrolled. This has led to large-scale radioactive contamination of the Techa riverside areas within the Chelyabinsk and Kurgan oblasts and to exposure of residents of the riverside settlements (Akleyev and Kisselyov 2001).
Radioactive contamination of the Techa River affected the population of the villages located downstream from the discharge point within the Chelyabinsk and Kurgan oblasts (Fig. 2.2), for whom the river was the main and sometimes the only source of drinking and household water supply. Already the first investigations of the radiation situation on the Techa River showed that the population of the riverside villages had been exposed to doses significantly exceeding the permissible limit. The levels of radiation exposure were the highest near the discharge point (7 km upstream of the village Metlino) and decreased with distance downstream. The main sources of external γ-exposure were the bottom sediments and floodplain soil, and some parts of the residential areas contaminated due to household activities (irrigation of kitchen gardens, the transfer of radionuclides with the excrement of farm animals, etc.).
The most extensive radiation exposure of the population was observed in 1950 and 1951. The radionuclide intakes with water for residents of villages located in the upper reaches of the river were 1,000 times higher than those for residents of the villages in lower reaches. The main source of internal exposure was radionuclides intake with river water and locally produced foodstuffs (meat, fish, milk, potatoes, vegetables from irrigated kitchen gardens, etc.). In the first years of the river system contamination, the total β-activity for fish and meat exceeded the temporary maximum permissible levels several thousand times and for other products 10–20 times. In the first years after the onset of discharges, the isotopes that predominated in the composition of rations were 106Ru, 95Zr, and 137Cs. In subsequent years, the input of 90Sr prevailed over the 137Cs contribution.
The ratio of radionuclides entering the body with food and water changed over the years. In 1950, the proportion of intakes with water accounted for 92–96 % and in 1955 only for 33 %. Two years after the start of discharges, the radionuclides intake was determined only by the consumption of the local foodstuffs (vegetables, potatoes, cereals, fish, meat, poultry, eggs). Beginning in 1952, a considerable reduction in the dietary intakes of radionuclides with water was noted especially for residents of villages located in the uppermost reaches of the river which had resulted from the construction of wells and a limited consumption of river water. In 1956, the use of river water for drinking was banned, and the dietary intakes of radionuclides were associated with the consumption of contaminated food. The releases of radionuclides into the river system resulted in contamination of the floodplain vegetation and subsequent absorption of activity in the organism of domestic animals grazing on the floodplain. As a result, cattle-breeding products (meat and milk) became contaminated with a mixture of radionuclides. The irrigation of the kitchen gardens with river water caused radioactive contamination of vegetables and potatoes. The highest total β-activity was registered in fish and poultry (Akleyev et al. 2000).
Already the investigations of the radiation situation on the Techa River, conducted in the early years, showed clearly that the main dose-forming radionuclide was 90Sr accumulated and deposited in the bone tissue for a long period of time. In the first years after the onset of discharge, the highest contribution to the 90Sr intake was made by fish, milk, and potatoes. After the consumption of river fish was banned, 90Sr intake resulted from the consumption of milk, potatoes, vegetables, and poultry products, and in the subsequent years, the main source of 90Sr intake was milk.
The external exposure dose for the residents of the riverside villages was formed due to discharge of γ-emitting radionuclides (137Cs, 95Zr, 95Nb, 106Ru, etc.) that were present in contaminated water, bottom sediments, and floodplain soil along the Techa River, the residential areas, and even houses.
Techa River Dosimetry System (TRDS) 2009, developed in the framework of the Russian–American intergovernmental agreement, was used to calculate the organ doses for residents of the riverside villages. In the course of TRDS-2009 development, the dynamics and radionuclide composition of discharges into the Techa River have been considerably refined (Anspaugh et al. 2006; Glagolenko et al. 2008). Improved estimates of internal dose using a new dosimetry system were achieved by the application of revised 90Sr and 137Cs intake function (Tolstykh et al. 2006a, b), of improved biokinetic model for Sr with allowance for age and gender differences (Shagina et al. 2003), and of new dose calculation algorithms reducing dose uncertainty (Shagina et al. 2006; Degteva et al. 2007). In addition, the new dosimetry system allows estimating the doses received by some persons who were resettled because of the 1957 accident. For individuals who have undergone general medical examination and treatment at URCRM clinic, TRDS-2009 allowed assessment of doses received in the course of X-ray examinations.
Individualized exposure dose to critical organs (RBM and nervous system) was used for the analysis of dose dependence of clinical effects in persons with CRS. Dose to soft tissues1 was used as an equivalent for the dose to the nervous system, lymphoid organs, and peripheral blood cells.
Dynamics of mean values of cumulative dose and dose rate to RBM for persons with CRS, estimated on the basis of TRDS-2009, is shown in Fig. 2.4. It can be seen that the dose to RBM reached maximum values of 1.26 Gy/year in 1951. Mean value of exposure dose rate to RBM in persons with CRS in 1951 was 0.22 ± 0.006 Gy. From 1951 to 1960, there was a sharp decrease in exposure dose rate to RBM, which in subsequent years declined more gradually. After 1952, when the dose rate to RBM in persons with CRS significantly decreased, hematopoiesis and immune system started to recover. Beginning in 1985, mean dose rate to RBM in persons who had CRS in past history did not exceed 1 mGy.
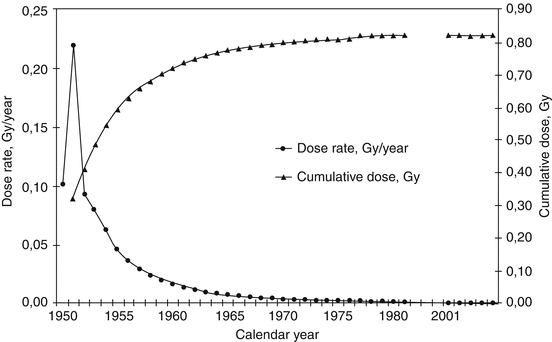

Fig. 2.4
The dynamics of cumulative dose and dose rate to RBM formation in persons with CRS in 1950–2005
As it can be seen from Fig. 2.4, the major portion of absorbed dose to RBM (75–80 % for the entire follow-up period) in persons with CRS was formed by 1961, when almost all CRS cases were diagnosed. The mean value of cumulative exposure dose to RBM in persons with CRS for the entire follow-up period (1950–2005) was 0.82 ± 0.02 Gy. Mean exposure doses to RBM at the time of CRS diagnosis were slightly lower and made up 0.60 ± 0.02 Gy.
Annual exposure dose to RBM in the period of maximum radiation exposure (1951), estimated with the dosimetry system TRDS-2009 (Fig. 2.5), in the majority of persons with CRS (539 cases, 57.3 %), was less than 0.2 Gy/year, and only in 147 patients (15.7 %), it exceeded the threshold dose for the hematopoiesis inhibition under chronic exposure (0.4 Gy/year). It is necessary to emphasize that exposure dose rate to RBM and soft tissues in the period of maximum radiation exposure remained significantly underestimated. As it has already been noted, releases of radioactive waste, occurring on an extraordinary large scale in the first and second decades of October 1951, determined extremely high dose rate of exposure in this relatively short period. With dosimetry system TRDS-2009, it is possible to estimate only mean annual dose value.
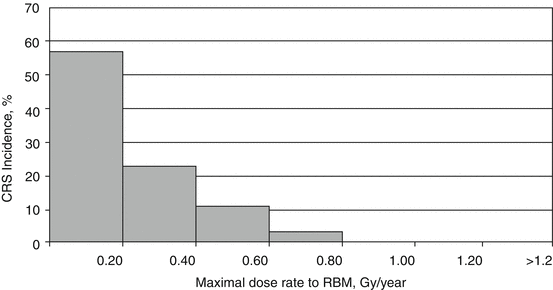

Fig. 2.5
Distribution of persons with CRS by RBM dose rate at the time of maximum discharges (1951)
Distribution of persons with CRS by the absorbed dose to RBM at the time of the disease diagnosis is shown in Fig. 2.6. About 40 % of all the persons with CRS (373 cases) received doses to RBM <0.4 Gy. Approximately in the same number of patients (403 cases), the cumulative dose to RBM was in the range of 0.4–1.0 Gy, and only in 159 patients (about 17 %), the dose was >1.0 Gy. It is clear that in the overwhelming majority of persons with CRS, RBM exposure dose was below the threshold dose values for the CRS formation, which was estimated on the basis of Mayak PA personnel follow-up. Maximum absorbed dose to RBM was 3.61 Gy.
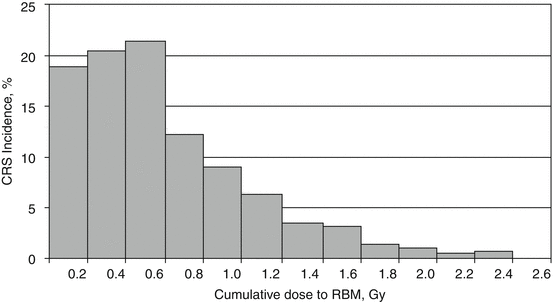

Fig. 2.6
Distribution of persons with CRS by RBM cumulative dose at the time of the syndrome diagnosis
Distribution of persons with CRS by RBM absorbed dose for the entire follow-up period (1950–2005) is shown in Fig. 2.7. It is clear that 676 persons with CRS (71.9 % of the total number of persons with CRS) received RBM exposure dose >0.4 Gy; in 276 persons with CRS (29.4 %), exposure dose was >1.0 Gy; and only 55 persons with CRS (5.9 %) had exposure dose >2 Gy. Maximum individual values of the RBM cumulative dose for persons with CRS over the entire follow-up period reached 3.61 Gy. As previously mentioned, the accumulation of RBM dose in persons with CRS occurred in the syndrome formation period. Over the next 50-year period since 1960 (the period of recovery and long-term effects), when the dose rate significantly decreased, RBM exposure dose amounted only to 20–25 % of the total dose for the entire follow-up period.
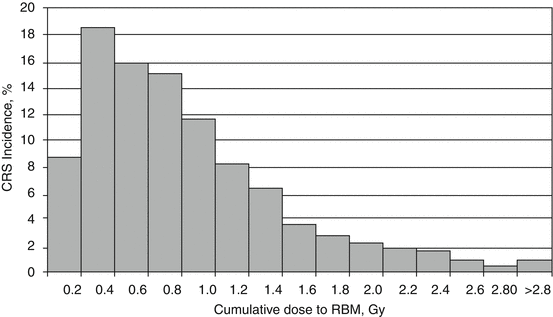

Fig. 2.7
Distribution of persons with CRS by RBM cumulative dose (1950–2005)
The dynamics of exposure dose and dose rate to lymphoid tissue (thymus, spleen, lymph nodes, etc.), peripheral blood cells, and nervous system were similar to those for RBM (Fig. 2.8). However, it is clear that the exposure dose to soft tissues was formed much faster than that to RBM, and basically, by 1955, doses to the above-mentioned organs have already been formed. These differences are associated with a sharp decline in external γ-exposure dose rate, which is the main source of soft tissue exposure, when discharges of radioactive wastes with high specific activity were terminated and protective measures were taken. The maximum dose rate (0.32 Gy) occurred also in 1951, while mean value in this period was 0.04 ± 0.002 Gy.
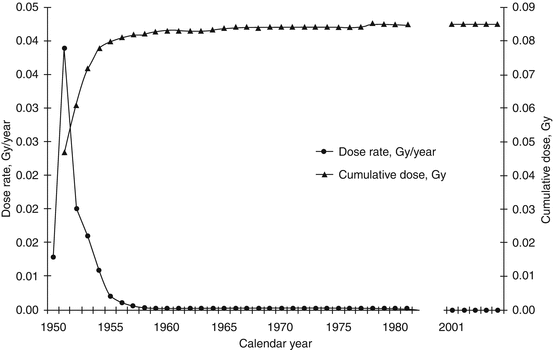

Fig. 2.8
Dynamics of cumulative dose and dose rate to soft tissues formation in persons with CRS in 1950–2005
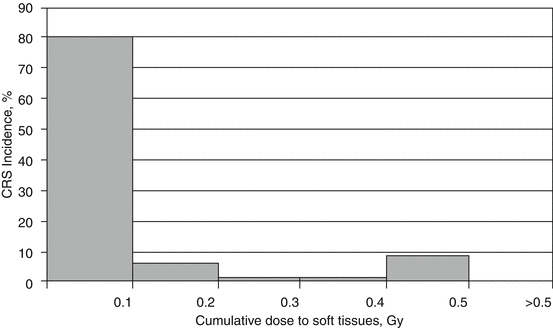
It can be seen that the doses to soft tissues were significantly lower in comparison to RBM doses. The mean value of the absorbed dose to soft tissues at the time of CRS diagnosis was 0.08 ± 0.004 Gy, and the maximum individual values reached 0.61 Gy. Mean value of accumulated dose to soft tissues over the entire follow-up period was somewhat higher and amounted to 0.09 ± 0.004 Gy; maximum individual cumulative doses to soft tissue reached 0.61 Gy. As is evident from Fig. 2.9, in vast majority of persons with CRS (80 %), doses to soft tissues for the entire follow-up period were <0.1 Gy. Only six patients (0.7 % of the total number of CRS cases) had doses >0.5 Gy.

