Key words
atherosclerosis, plaque, intima-media thickness, gray-scale median, ultrasound transducer, plaque ulceration, plaque calcification, echodensity, carotid arteries
Introduction
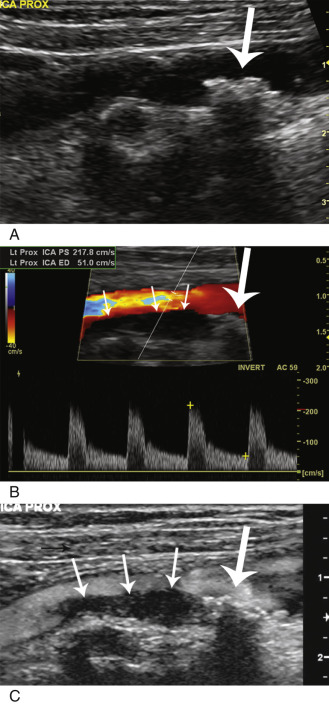
The ultrasound evaluation of carotid artery atherosclerosis has evolved over the years. At the start, B-mode (gray-scale) images were used to evaluate the severity of carotid artery disease in the hope of supplementing traditional arteriography. Unfortunately, it became apparent that at higher degrees of stenosis the diagnostic accuracy of B-mode images was insufficient to estimate fully the severity of carotid artery stenosis. This held true when B-mode images were correlated against arteriographic examinations and pathology specimens. The major problem was the inability to visualize fully the echolucent (hypoechoic or low echo intensity) components of plaque. Continuous wave Doppler and duplex ultrasound were better at estimating high degrees of stenosis severity than B-mode images alone. Since then, technological innovations and the use of higher frequency transducers have improved visualization of the echolucent components of plaque. In addition, color Doppler, power Doppler images, and B-flow images have helped outline the echolucent components of plaques ( Fig. 6.1 ).
While researchers were concentrating on characterizing plaques by ultrasound, another ultrasound manifestation of carotid atherosclerosis was discovered. In 1986, Pignoli et al. reported that a diffuse form of wall thickening, the intima-media thickness (IMT) of the aortic and the common carotid artery walls, was linked to atherosclerosis. With this discovery came the realization that B-mode ultrasound images showed the combined wall layers from the lumen to the external elastic lamina (intima and media) and that a separate measurement of the intima thickness, the site of plaque on pathology specimens, was not being made.
This chapter reviews these two aspects of carotid artery atherosclerosis: (1) carotid artery plaque characterization, and (2) the IMT of the common and internal carotid arteries.
Pathogenesis of Carotid Atherosclerosis
Mechanisms of plaque formation and intima-media thickening
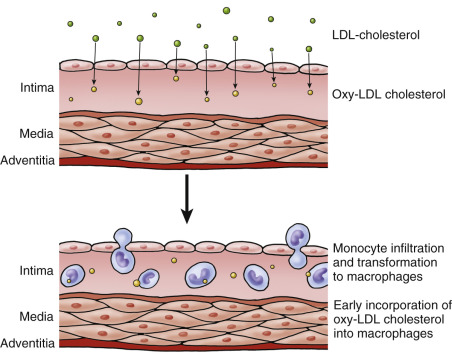
Current theory holds that early atherosclerosis occurs in multiple stages and is driven by inflammatory responses. The process begins with the penetration of lipids, mostly low-density lipoprotein (LDL) cholesterol particles, into the subendothelial lining of the artery wall. LDL cholesterol is then oxidized, promotes an inflammatory response, and attracts monocytes ( Fig. 6.2 ). Penetration of lipid into the artery wall is more likely to occur at artery branch points where slow flow or cyclical flow reversal occurs. A similar process also occurs in straight arterial segments.
In the early stages, the response to the penetrating lipid particles is essentially the same in the common and internal carotid arteries. The lipid material is ingested by macrophages, forming foam cells, so named because of their foamy appearance on microscopic examination ( Fig. 6.3 ). Small pools of extracellular lipid form, and smooth muscle cells proliferate. Here the pathologic processes diverge.

On microscopic examination, foam cells and extracellular lipid pooling are commonly seen in the straight segment of the common carotid. Infrequently, more advanced lesions with confluent areas of extracellular lipid called a lipid core form in the intima.
The formation of a large aggregate of extracellular cholesterol, the lipid core, typically occurs at the carotid bifurcation and in the proximal internal carotid arteries ( Fig. 6.4 ). With time, this is associated with microcalcification that can lead to larger calcium aggregates as the plaque increases in size. The subendothelium thickens to become a fibrous cap of varying thickness covering the lipid core ( Fig. 6.5A ). As this is happening, plaque neovascularization takes place when small arteries of the vasa vasorum extend from the adventitia through the media into the now evolving plaque. The fibrous cap can also be subject to a separate inflammatory response when metalloproteinases, enzymes capable of digesting the fibrous cap, preferentially accumulate at the plaque shoulders and weaken the protective fibrous cap that has developed around the lipid core (see Fig. 6.5B ).


Atherosclerotic plaques that develop in the coronary and carotid arteries have similar morphologies. Their evolution and ultimate fate are different, depending on their location, local flow dynamics, and artery size ( Table 6.1 ). In the coronaries, plaque rupture because of disruption of the fibrous cap will lead to occlusion of the artery and potentially cause an acute coronary syndrome or sudden cardiac death. In the carotids, disruption of the fibrous cap will not typically occlude the artery. It will either be contained and cause a rapid expansion of the plaque or, if it is not contained, lead to embolization of thrombus and plaque material.
| Variable | Carotid Artery | Coronary Artery |
|---|---|---|
| Number of branch points | One | Multiple |
| Blood flow pattern | Higher velocities with flow mostly during systole | Lower velocities with flow mostly during diastole |
| Size | 5 to 6 mm and stays constant | 3 to 4 mm and tapers |
| Shear rates | Complex with reversing eddies at only one branch point | Complex at each of multiple branch points |
| Ulcerated plaque | Common | Uncommon |
| Erosions | Uncommon | Common |
| Acute occlusions | Uncommon | Common |
| Nonocclusive plaque hemorrhage | Common | Common |
| Calcification | Common with high-grade stenosis | Common with high-grade stenosis |
Plaque rupture is not only due to a primary dissolution of the fibrous cap. Plaque rupture can also occur from intraplaque hemorrhage caused by rupturing vessels of the neovascular supply. This can lead to a rapid increase in plaque volume and fibrous cap disruption. Repeated intraplaque hemorrhages can be contained and simply lead to incremental plaque expansion. Such a mechanism was inferred when pathologic specimens of large carotid artery plaques showed pathologic evidence of multiple prior episodes of intraplaque hemorrhage.
Plaque histopathology: limitations
It is well recognized that severity of internal carotid stenosis is the major risk factor for neurologic events. Interventions aimed at preventing strokes such as carotid endarterectomy or stenting therefore target large plaques. What we know of the histopathology of atherosclerotic plaque has relied heavily on endarterectomy specimens from advanced carotid lesions. The histopathology studies of the 1980s emphasized the qualitative detection of intraplaque hemorrhage, not an unexpected finding given what we now know of the evolution of atherosclerotic plaque. Although plaque thrombus and intraplaque hemorrhage are still being studied, for example in the Oxford Plaque Study, recent histopathology studies increasingly use quantitative measurements to focus on associations of plaque contents with future cardiovascular events. This shift in emphasis is typical of plaque specimens used in the atherosclerotic plaque expression (Athero-Express) study.
Vulnerable and unstable plaques
The existence of a vulnerable plaque is based on observations made on coronary artery plaques. Large lipid cores, thin fibrous caps, and markers of inflammation are associated with acute coronary syndromes, whereas fibrous plaques tend to be stable and are associated with chronic angina. The key features of the vulnerable coronary plaque are the development of a necrotic core, the presence of inflammation that leads to a thin fibrous cap, increased enzymatic activity at the shoulders of the plaque, and active neovascularization from the adventitia into the plaque. The carotid artery vulnerable plaque is typically echolucent (lipid cores are mainly echolucent) and large in size. Ultrasound cannot directly grade the level of inflammation but can detect evidence that an active inflammatory process is taking place. Plaque neovascularization, a marker of the vulnerable plaque, can be detected by the presence of intraplaque microbubbles ( Fig. 6.6 ) after ultrasound contrast injection. These vulnerable plaques are unlikely to cause symptoms until they rupture.


The plaques associated with clinical neurologic events are often “active” and have irregular surfaces and a heterogeneous composition. Transcranial Doppler (TCD) ultrasound studies have shown that symptomatic plaques are associated with increased numbers of high-intensity transient signals (HITS), a marker of intracranial embolization. These plaques tend to be large and cause a significant narrowing of at least 50% in the lumen diameter of the artery and frequently greater than 70% stenosis.
The concept of an “unstable” carotid plaque is somewhat broad. It can include an intact homogeneous plaque with a thin cap and large lipid core or a plaque with an irregular surface and mixed histology.
What to expect from imaging
High-grade carotid stenoses are in essence large plaques. These lesions are apt to have a heterogeneous histologic composition and will often have a discontinuous endothelial lining. They are likely the source of cerebral emboli either by being susceptible to rupture or because of the exposed subintimal plaque matrix. Plaque matrix is thrombogenic and serves as the nidus for platelet aggregates and thrombus formation. On ultrasound, these lesions have a heterogeneous composition of echodense and echolucent elements as well as mural irregularities. The ultrasound correlates of echodense areas include fibrous tissue and various levels of calcium deposition that can cause shadowing, whereas echolucent areas represent either areas of recent hemorrhage or lipid deposition. The heterogeneity of these large plaques makes them more susceptible to suffer mechanical damage especially when local inflammation and increased enzymatic activity are present.
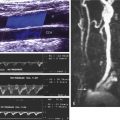
Ultrasound is well suited for the evaluation of plaque compared with other modalities. The geometry of the carotid bifurcation as it turns into the internal carotid artery sinus may mask early plaque formation on traditional angiography. Computed tomographic arteriography and magnetic resonance imaging offer additional capabilities for imaging plaque components but at additional cost. On computed tomography, the echolucent elements tend to be low density within the plaque and the echodense and calcified elements are high density. On magnetic resonance imaging, enhancement of the plaque indicates the presence of hypervascularity, a sign of active inflammation.
- •
The carotid artery responds differently to LDL cholesterol deposition in straight arterial segments from that seen at the bifurcation: diffuse thickening of the wall compared with the creation of a plaque with a lipid core.
- •
Atherosclerosis is a dynamic process. Once early plaque forms, the inflammatory responses within the intima and subendothelium lead to the development of complex histologic structures.
- •
Histopathology studies are limited by selection bias toward high-grade symptomatic carotid artery plaques.
- •
“Vulnerable” plaques tend to be homogeneous with a large lipid core, have a thin fibrous cap, and show evidence of neovascularity.
- •
“Active” plaques are a source of emboli and tend to have irregular surfaces and a heterogeneous appearance.
Imaging Protocol: IMT and Plaque
Distal common carotid artery
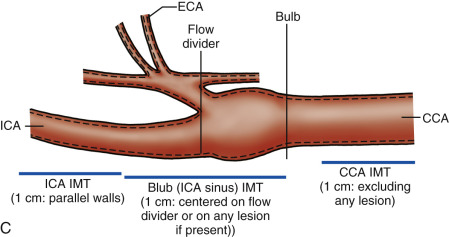
A B-mode image is taken at the distal common carotid artery. The head of the patient is rotated 45 degrees away from the side being imaged and the probe is held parallel to the artery ( Fig. 6.7A ). The probe is kept parallel to the artery so that the double lines of the lumen-intima and media-adventitia interfaces are clearly visible on both near and far walls. The location of the common carotid IMT measurement is always below the bulb extending to the right over a distance of approximately 1 cm (by convention, the patient’s head is to the left of the image and the legs to the right). The point where the measurement is taken is protocol-dependent ( Fig. 6.7B and C ) but it should start at or below the point where the outer wall of the common carotid artery (the adventitia) starts to diverge. Image size, as determined by pixels/cm, should be at least 140 pixels/cm and ideally around 180 pixels/cm. Some protocols exclude plaques (local increase in IMT of 50% or IMT ≥1.5 mm) from the measurement.


Common carotid artery bulb/internal carotid artery
Because plaque is eccentric, full visualization of any carotid plaque will require multiple longitudinal planes to be sampled ( Fig. 6.8 ). We start with a transverse sweep along the carotid artery into the bifurcation and then into the proximal internal carotid artery. We then focus on the flow divider (the junction between the internal and the external carotid artery) from an anterior ( Fig. 6.8B ), lateral ( Fig. 6.8C ), and posterior projection ( Fig. 6.8D ), finding the one projection that best displays the full extent of the plaque ( Fig. 6.8B ). The probe can be placed lower or higher in the neck depending on plaque location. Because of eccentricity, plaques require sampling in multiple projections until the best two-dimensional (2D) B-mode image is selected ( Figs. 6.8 and 6.9 ). On some projections, the plaque looks disconnected from the artery wall ( Fig. 6.10A ), and appears as a “floater” ( Fig. 6.10B and C ). These images are avoided and images where the plaque is anchored to either the near or far wall over a long distance are selected for plaque characterization. Beam steering can be judiciously used to emphasize the blood-plaque (lumen-intima) interface ( Fig. 6.11 ). The imaging plane that best displays a plaque is also used for color Doppler imaging and Doppler waveform analysis. Plaque area measurements can also be performed on the selected image because they have been shown to be predictive of future cardiovascular events.


Plaque Characterization
This section reviews the approach used to subjectively characterize plaques and to correlate the plausible histology with different plaque echodensities. Although most plaque characterization is done in a subjective fashion, quantitative approaches may be used to correlate plaque components to plaque histology. This section covers the basic concept of image normalization because it is the first step for the quantitative evaluation of plaque echodensities.
Plaque definition
How is a plaque defined? A simple definition comes from a consensus statement that includes either a focal increase in the IMT of 50% compared with the surrounding wall thickness or a local IMT value of 1.5 mm or greater. B-mode plaque imaging tends to become unreliable when plaque size reaches more than 3 to 3.5 mm. This is an empiric exclusion criterion used when carotid ultrasound serves as the end point for intervention trials on lipid-lowering medications.
Color Doppler imaging, power Doppler imaging or, on occasion, an encoded B-mode technique called B-flow imaging (General Electric Medical Systems, Waukesha, WI) can assist in delineating the extent of echolucent plaques (see Fig. 6.1 ).
Subjective criteria
The B-mode appearance of plaque is based on classifying the intensity of echoes within the confines of the intima and media. The term echolucent can be used interchangeably with hypoechoic to categorize zones of very low echoes (very dark, similar to blood). Hyperechoic or echodense refers to white or brighter areas on the image with intensities equivalent to that of the adventitia. Echoes that are between the hypoechoic and hyperechoic zones or intermediate in echogenicity appear as areas of gray intensity similar to that of muscle. The latter tends to be grouped in the echodense group. Calcified plaques have shadowing zones and the underlying plaque material cannot be characterized by ultrasound. The point of transition between echolucent and echodense has never been well defined in the literature.
Image normalization
Subjective plaque characterization assumes that the image accurately displays the full range of echo intensities. Plaque characterization can also become quantitative. This requires the image to be normalized.
Obviously, the eye can make adjustments when the image is either too dark or too light. Image normalization is needed if the echo distribution of plaque components is to be quantified. The gray-scale distribution of B-mode images typically ranges from 0 to 255 because the image has 8 bits of digital encoding (i.e., 2 8 –1). The original approach was based on the use of Adobe Photoshop ( Fig. 6.12A ). With image normalization, the intensity of the adventitia is used as a new reference point of 190 ( Fig. 6.12B ). The echodensity of the lumen is typically reset at 4 or 5. Depending on the original image, the changes in pixel intensities can be easily seen, and at other times the processed image appears similar to the original. Setting the adventitial cut-point to a very low level (much less than 190) can overgain the echodensities within the image ( Fig. 6.12C ).


Echolucent (hypoechoic) plaques
Echolucent zones within plaques correspond to two types of tissue elements. The first is that of lipid (fat) aggregates such as the lipid core ( Fig. 6.13A ). Image normalization can help better visualize the plaque interfaces ( Fig. 6.13B ). Homogeneous echolucent plaques are uncommon and come closest to representing the carotid artery equivalent of the vulnerable plaque seen in the coronary arteries. The second histologic correlate of an echolucent zone is the presence of recent hemorrhage or thrombus, typically seen in larger, more complex plaques ( Fig. 6.14 ). These plaques tend to be heterogeneous, and it may be difficult to distinguish areas of thrombus from portions of a lipid core.


Purely echolucent plaque has an average echodensity close to that of blood and less than that of muscle. Color Doppler, power Doppler, and B-flow imaging can improve visualization of the echolucent plaque components adjacent to the lumen of the artery (see Fig. 6.1 ). Mostly echolucent plaques have been shown to be associated with high levels of low-density lipoprotein, plaque ulceration, and increased risk of cerebral ischemic symptoms.
Isoechoic (hyperechoic) plaques
Increased echodensity of a carotid plaque represents increased fibrous tissue, related to increases in collagen and the number of smooth muscle cells. An isoechoic plaque has approximately the same echogenicity as the sternocleidomastoid muscle ( Fig. 6.15 ), but it is also less echogenic than the arterial adventitia. Isoechoic plaques are not believed to be associated with cerebral ischemic symptoms. A hyperechoic plaque has higher echogenicity than the sternocleidomastoid muscle, close to the echodensity of the adventitia, but it is not calcified and does not produce acoustic shadowing ( Fig. 6.16 ). The transition between isoechoic and hyperechoic is poorly understood. There is also overlap between echolucent plaques and isoechoic plaques, explaining why plaque classification shows such high variability.


Calcified plaques
Dystrophic calcification occurs in plaque, and such calcification generates strong reflections, accompanied by distal acoustic shadows. These reflections equal or exceed the brightness of other tissue in the image ( Fig. 6.17A ). High-resolution sonography is extremely sensitive to the presence of calcification, and areas of the order of 1 mm in diameter may be detected ( Fig. 6.17B ). Plaque calcification may be focal or diffuse, and large calcifications may generate acoustic shadows that obscure the arterial lumen, interfering with ultrasound diagnosis ( Fig. 6.17C ). Although it is assumed that calcification is seen in the later stages of plaque growth, an association between plaque calcification and symptomatology has not been established. The calcified areas likely represent prior cellular apoptosis (cell death) transformed into a local calcium deposit. These can be small or large, depending on other aspects of plaque growth. However, coexistent echolucent areas and zones of calcifications in large plaques are associated with neurologic events.


Homogeneous versus heterogeneous
The overall distribution of echoes has classically been characterized as either homogeneous or heterogeneous. This classification harkens back to correlations made between ultrasound images and specimens removed following carotid endarterectomy. Reilly et al. used the term homogeneous for plaques that had mostly medium- or high-intensity echoes and heterogeneous for plaques that had low-, medium-, and high-intensity echoes. Homogeneous plaques tended to have fibrous elements on histologic examination, whereas heterogeneous plaques had areas of hemorrhage. Bluth et al. defined homogeneous plaques as a uniform echo pattern more commonly with low-level echoes, whereas heterogeneous plaques had a complex texture containing focal anechoic areas. As such, these attempts to classify plaques are biased toward large plaques associated with high degrees of stenosis. This makes it very likely that the plaques studied had undergone multiple cycles of intraplaque hemorrhage, rupture, and repair. It is therefore not surprising that most plaques seen in symptomatic patients are heterogeneous. However, in the context of vulnerable plaques, the term homogeneous can be applied to plaques with mostly low-intensity echoes. Homogeneous also applies to plaques with an even distribution of medium to high-level echoes.
A homogeneous plaque has at least 90% (75% according to same authors) of the material of the same echodensity ( Figs. 6.15 and 6.18A ). Distinguishing heterogeneous from homogeneous plaque can be difficult. A plaque with a mixture of different elements is heterogeneous by virtue of containing areas of high and low echodensity ( Fig. 6.18B and C ). Arbitrarily, a plaque containing more than 10% different echodensities can be classified as heterogeneous by some authors, but other authors have used a 25% threshold for this designation. Heterogeneous plaques are more often associated with prior strokes or transient ischemic attacks than homogeneous plaques. One pitfall in characterizing a plaque with a focal area of low echogenicity is the possibility that the focal area might represent an ulcer. The adjunctive use of color Doppler imaging, power Doppler, or B-flow is then needed to help better define the plaque contour. The presence of a dominant focal zone of echolucency or multiple echolucent areas making up more than 50% of the plaque area is believed to indicate an increased risk for future embolic events and neurologic symptoms.


Plaque Classification Schemes
Subjective approaches
Plaque echogenicity/homogeneity has historically been assessed visually. The original classification schemes were based on correlating echolucent areas with plaque hemorrhage: a widely used method for the visual assessment of plaque ( Table 6.2 ) was proposed by Gray-Weale and colleagues and then modified by Geroulakos and co-workers. The latter resembles the classification scheme adopted by the European consensus conference on carotid plaque classification. The classification scheme uses five easily defined plaque categories with the lowest grades representing lesions with mostly echolucent elements (grades 1 and 2). It is believed that the risk for neurologic events is highest for category 1 and 2 plaques. Grades 3 and 4 have mostly echogenic components. The fifth category (grade 5) applies to calcified plaques. Although straightforward, the use of any visual method for plaque assessment only gives fair reproducibility. Sources of variability between visual interpretations include intrinsic instrument differences, variances in instrument settings, and levels of experience of the individuals performing the interpretation. Even the monitor settings and the scale of the image can affect the reliability of plaque characterization. Nevertheless, it has been shown that moderate levels of concordance can be obtained with visual plaque assessment if proper attention is given to image settings, despite the fact that there is marked heterogeneity in the reproducibility of the gold standard histologic classification.
| Gray-Weale et al. | Geroulakos et al. and European Consensus | ||
|---|---|---|---|
| Type | Description | Type | Description |
| 1 | Dominantly echolucent with thin echogenic cap | 1 | Uniformly echolucent; echogenic cap does not need to be present |
| 2 | Substantially echolucent plaque with small areas of echogenicity | 2 | Predominantly echolucent with <50% echogenic material |
| 3 | Dominantly echogenic lesions with small area(s) of echolucency (<25%) | 3 | Predominantly echogenic plaque with <50% echolucent areas |
| 4 | Uniformly echogenic lesions (equivalent to homogeneous) | 4 | Uniformly echogenic |
| 5 | Plaques that could not be classified because of heavy calcification | ||
Related posts:

Stay updated, free articles. Join our Telegram channel

Full access? Get Clinical Tree


