Abstract
Objective
To explore the differences between SonoVue and Sonazoid contrast-enhanced ultrasound (CEUS) in evaluating enhancement features of renal masses and determine the diagnostic value of CEUS in clear cell renal cell carcinoma (ccRCC).
Methods
A total of 57 eligible patients were enrolled and divided into the ccRCC, papillary renal cell carcinoma (pRCC), non-ccRCC and non-pRCC malignancy groups, and benign mass groups based on their postsurgical histopathologic diagnosis. The enhancement features of renal masses following SonoVue and Sonazoid CEUS in each group were analyzed. Diagnostic efficiencies of SonoVue and Sonazoid CEUS for ccRCC and non-ccRCC were determined.
Results
There were no significant differences in the enhancement features of renal masses with SonoVue and Sonazoid imaging in the four groups ( p > .05). Both SonoVue CEUS and Sonazoid CEUS showed good diagnostic performance for the differential diagnosis of ccRCC and non-ccRCC, with sensitivities of 88.6% and 85.7%, specificities of 76.5% and 88.2%, accuracies of 84.6% and 86.5%, positive predictive values of 88.6% and 93.8%, and negative predictive values of 76.5% and 75%, respectively. There were no statistically significant differences in any of the diagnostic performance indices between the two methods ( p > .05).
Conclusion
The CEUS features of SonoVue and Sonazoid in evaluating renal masses were similar in the vascular phase. Both SonoVue and Sonazoid CEUS showed good diagnostic performance for the differential diagnosis of ccRCC and non-ccRCC.
Introduction
Renal cell carcinoma (RCC) is the most fatal genitourinary malignancy worldwide. According to the National Comprehensive Cancer Network (NCCN) Guidelines (Version 3.2022) for Kidney Cancer, RCC comprises approximately 3.8% of all new cancers and approximately 85% of kidney tumors [ ]. With the advancements in cross-sectional imaging technology, many asymptomatic renal tumors have been discovered incidentally during imaging examinations, and the annual incidence of RCC has been rising on average by 0.6% from 2006 to 2015 [ ]. RCC is a complex family of tumors with distinct histological subtypes, each with a different prognosis. The accurate identification of benign and malignant renal masses and tumor subtypes is crucial for clinical diagnosis, treatment planning, and prognosis.
Conventional ultrasonography provides a rapid, safe, and cost-effective method to characterize the basic features of lesions, but cannot be used to identify tumor microvasculature, making it difficult to diagnose pathological subtypes. Contrast-enhanced computed tomography (CECT) and contrast-enhanced magnetic resonance (CEMR) have high diagnostic capabilities for detecting renal tumors. However, their application is limited in some patients because of factors such as radiation, nephrotoxicity, and metal implants. Contrast-enhanced ultrasound (CEUS) is used to determine the microcirculation of tissues by observing the enhancement phase, wash-in patterns, homogeneity, and pseudocapsule of the mass [ ]. Compared to CECT or CEMR, CEUS has a lower cost, does not require ionizing radiation, and provides images in real time. In addition, given that ultrasound contrast agents (UCAs) are safe with a very low incidence of side effects and no nephrotoxicity, CEUS can be used in patients with iodine allergy and renal insufficiency, which may be contraindications to CECT or CEMR [ ].
Recently, CEUS has emerged as a safe and useful tool for diagnosing renal masses. SonoVue is the most widely used UCA in current CEUS studies of renal tumors, and its main components are sulfur hexafluoride microbubbles [ ]. SonoVue CEUS is widely used in the diagnosis of renal tumors and plays an important role in the differential diagnosis of benign and malignant renal masses, with a sensitivity of 80.0%–88.9% and a specificity of 63.6%–87.5% [ , ], which are comparable to enhanced CT and MR [ , ]. Sonazoid is a new second-generation contrast medium, licensed in mainland China in 2019. The main component of Sonazoid is perfluorobutane, an inert fluorocarbon gas with high density, low dispersibility, and low solubility. Compared with sulfur hexafluoride, perfluorobutane has a lower solubility, and the hydrogenated egg phosphatidylserine sodium (HEPSNa) shell encapsulates it, making Sonazoid more stable [ ]. Reports on the use of Sonazoid CEUS for renal masses were rare. Japanese scholars showed that Sonazoid-CEUS could objectively and quantitatively diagnose RCC [ ]; in a prior multicenter study, which we have participated as a center, the research showed that Sonazoid-CEUS, CE-CT, and CE-MRI demonstrate desirable and comparable sensitivity for the differentiation of renal mass [ ]. Therefore, its clinical value requires further exploration.
Because SonoVue and Sonazoid have different structural and metabolic properties, we investigated whether the latter has an equivalent diagnostic value to SonoVue in the evaluation of renal tumors. According to the results of our literature search, there have been no reports to date of a comparative study between these two contrast agents in evaluating renal masses. Therefore, this study aimed to explore the potential differences between SonoVue and Sonazoid CEUS in evaluating the enhancement features of renal masses and the diagnostic value for clear cell renal cell carcinoma (ccRCC). In addition, we assessed the differences in enhancement features among renal mass subtypes using Sonazoid CEUS and conventional ultrasound.
Materials and methods
Compliance with ethical standards
This prospective study was approved by the Ethics Committee of the Investigator’s Hospital. The clinical trial registration number is ChiCTR2200055464. Each participant signed a written informed consent form before participating in the study.
Participants
Between December 2021 and February 2022, patients suspected of having a renal mass first detected using conventional US, CT, or MRI were scheduled for SonoVue CEUS. The inclusion criteria were as follows: (i) participants aged between 18 and 85 years, (ii) participants who planned to undergo mass resection, (iii) participants who were to undergo SonoVue CEUS for their renal masses, and (iv) participants who voluntarily participated in the study and signed informed consent for Sonazoid CEUS. The exclusion criteria were as follows: (i) patients who had a change in their treatment strategy and underwent conservative treatment; (ii) contrast-enhanced ultrasound images that did not meet our expectations because of excessive movement or the inability to breathe peacefully by the participant during the CEUS procedure; and (iii) patients who went to another hospital for surgery and were lost to follow-up. The demographic and clinical data of the participants (sex, age, height, weight, and body mass index) were recorded. All enrolled participants underwent surgical resection. The histopathological results were used as the gold standard.
Conventional US and Contrast-enhanced US examination
The conventional US and CEUS were performed by two radiologists (Y.G. and H. Z). Both radiologists were well versed in CEUS; Y.G. has more than 10 years of experience and H. Z has more than 2 years of experience in the procedure. The radiologists used the Logiq E9 system (GE Healthcare, Milwaukee, WI, USA) with a C1-6 (frequency, 1-6 MHz) broadband convex array probe equipped with amplitude modulation in contrast imaging mode.
Initial grayscale imaging and color Doppler flow imaging (CDFI) scanning were performed to determine the location, size, shape, margin, internal echogenicity, and vascularity of the masses. Optimal scanning containing both the mass and normal adjacent renal parenchyma was selected and switched to the CEUS imaging mode using amplitude-modulation technology.
Second-generation contrast agents SonoVue (Bracco SpA, Milan, Italy) and Sonazoid (GE Healthcare, Milwaukee, WI, USA) were used in this study. The mechanical index was 0.10–0.15 for SonoVue and 0.20–0.23 for Sonazoid. First, SonoVue CEUS was performed. Five milliliters of saline were injected into a bottle of the SonoVue freeze-dried powder to fully oscillate before injection, and the participants received an intravenous bolus in the antecubital vein at a dose of 1.2 mL contrast agent, followed by 5 mL of saline flush. The timer and video recorder were started directly after the injection. All participants were required to breathe calmly during the CEUS. The first 2 min was recorded continuously, and then the subsequent scans at 3,4, 5 min were intermittent acquisitions.
Sonazoid CEUS was performed on the following day. Sonazoid was used at the recommended dose of 0.6 mL and injected into the antecubital vein by the same method as SonoVue; similarly, the vascular phase was scanned and recorded in the same way as SonoVue, and then scanned continuously for 30 s at 7 min in the post vascular phase and recorded. Finally, the findings of SonoVue CEUS and Sonazoid CEUS in all participants were compared and analyzed.
Image analysis
Both CEUS examinations were analyzed independently by the two radiologists. The radiologists were blinded to the CT or MRI findings, clinical histories, and final histological results.
The research indicators of conventional US were as follows: size (<4 cm or >4 cm), shape (round/oval or irregular), margin (well defined or poorly defined), echogenicity (hyper, iso, or hypo) compared to normal adjacent renal parenchyma renal cortex, and color flow signals (rich or poor vascular) on Color Doppler Flow Imaging (CDFI). Round/oval was defined as that the shape of renal mass is spherical without nodular prominence. If it met any of the following two criteria, we determined the shape of the mass to be irregular: (i). renal mass with locally raised protrusion and smooth margin; (ii) renal mass with sharply and unsmooth nodular margin. Well defined of margin were defined as that the margin between tumor and renal parenchyma is clear; poorly defined of margin were defined as that the margin between tumor and renal parenchyma is unclear [ ]. Rich vascularity was defined as a large number of strip, ring, or “holding ball” color flow signals in the edge and interior of the renal mass, while poor vascularity was defined as no color flow or slight and star-like color flow signal in the renal mass [ ].
The research indicators for CEUS were wash-in, wash-out, pseudocapsule sign, wash-in patterns, degree of peak enhancement, and homogeneity of enhancement. The normal renal cortex adjacent to the mass was used as a control for the comparison of the degree of enhancement. The indicators were defined as follows: wash-in and wash-out were classified as fast/similar or slow, the pseudocapsule sign was defined as perilesional rim enhancement, and the wash-in patterns on CEUS was classified as either centripetal or global. Centripetal was defined as vascular filling from the periphery to the center, and global was defined as diffuse filling of vessels; the degree of mass peak enhancement was classified as hyper-, iso-, or hypo-enhancement [ ]; and the homogeneity at the time of peak enhancement was classified as homogeneous or heterogeneous. Homogeneity was defined as complete enhancement in areas of the mass without any defects, and heterogeneity was defined as a mass with unenhanced areas, regardless of the various enhancement degrees [ ].
Statistical analysis
All statistical analyses were performed using IBM SPSS Statistics for Windows, version 22.0. Continuous variables are expressed as mean values ± the standard deviation, and categorical variables are expressed as frequencies (percentages). Differences between SonoVue and Sonazoid CEUS for each enhancement feature were analyzed using McNemar’s test. Differences in enhancement features using conventional US among the four groups were analyzed using Fisher’s exact test (bilateral). The sensitivity, specificity, accuracy, positive predictive value (PPV), and negative predictive value (NPV) were calculated to assess the performance of SonoVue CEUS and Sonazoid CEUS for the diagnosis of ccRCC. Statistical significance was set at p < .05.
Results
Participants and renal mass information
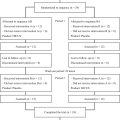
A total of 65 participants met the inclusion criteria. Among them, eight were excluded because the treatment strategy changed in six participants who underwent conservative treatment and two went to another hospital for surgery and were lost to follow-up. Accordingly, 57 observations in 57 participants (39 men, 18 women; mean age ± standard deviation, 55.1 y ± 1.8) were included in our study ( Fig. 1 ). The clinicopathological characteristics of the participants and target observations are described in Table 1 .

| Characteristic | Value |
|---|---|
| Patients (n = 57) | |
| Male/Female | 39/18 |
| Age(year) a | 55.1±1.8 |
| Body mass index (kg/m2) a | 25.7±0.4 |
| mass (n = 57) | |
| Location | |
| Right/Left | 25/32 |
| Location of mass | |
| Upper /Interpolar /Lower pole | 17/20/20 |
| Single/Multiple | 52/5 |
| Size (cm) a | |
| Mean ± SD | 5.8±0.5 |
| <4 | 21 (38.5) |
| ≥4 | 36 (61.5) |
| Pathological diagnosis | |
| Malignant (n = 50) | |
| ccRCC | 36 (63.2) |
| pRCC | 5 (8.8) |
| Non-ccRcc and non-pRcc malignancy | 9 (15.8) |
| chRCC | 2 (3.5) |
| SCC | 1 (1.8) |
| MTSCC | 1 (1.8) |
| Xp11.2/TFE3 RCC | 1 (1.8) |
| Metastatic LUAD | 1 (1.8) |
| Urothelial carcinoma | 2 (3.5) |
| Wilms tumor | 1 (1.8) |
| Benign (n = 7) | |
| AML | 5 (8.8) |
| Oncocytoma | 1 (1.8) |
| MESTK | 1 (1.8) |
a Data are the mean ± standard deviation, and data in parentheses are percentages. ccRCC, clear cell renal cell carcinoma; pRCC, papillary renal cell carcinoma; chRCC, chromophobe renal cell carcinoma; SCC, squamous cell carcinoma; MTSCC, mucinous tubular and spindle cell carcinoma; Xp11.2/TFE3 RCC, Xp11.2 translocation/TFE3 gene fusions renal cell carcinoma; Metastatic LUAD, Metastatic lung adenocarcinoma; AML, angiomyolipoma; MESTK, mixed epithelial and stromal tumor of the kidney.
The mean size of the observed masses was 5.8 ± 0.5 cm. Of these masses, 63.2% (36 of 57) were confirmed as ccRCC, 8.8% (5 of 57) as papillary renal cell carcinoma (pRCC), 15.8% (9 of 57) as non-ccRCC and non-pRCC malignancies, and 12.2% (7 of 57) as benign masses. Non-ccRCC and non-pRCC malignant masses included two chromophobe renal cell carcinoma (chRCCs), one squamous cell carcinoma (SCC), one mucinous tubular and spindle cell carcinoma (MTSCC), one Xp11.2 translocation/TFE3 gene fusions renal cell carcinoma (Xp11.2/TFE3 RCC), one metastatic lung adenocarcinoma (LUAD), 2 urothelial carcinomas, and one Wilms tumor. Benign masses included five angiomyolipoma (AML), one oncocytoma, and one mixed epithelial and stromal tumor of the kidney (MESTK).
Comparison of enhancement features of renal masses with SonoVue and Sonazoid
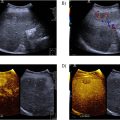
All CEUS imaging characteristics of wash-in, wash-out, pseudocapsule sign, wash-in patterns, degree of peak enhancement, and homogeneity of enhancement between SonoVue and Sonazoid in the four groups (ccRCC, pRCC, non-ccRCC and non-pRCC malignancies, and benign masses) are shown in Table 3 , Figures 2 and 3 . None of the enhancement features of the renal masses showed significant differences with the use of SonoVue or Sonazoid in the four groups ( p > .05).


Comparison of conventional US and Sonazoid CEUS features among the four groups of renal masses
Conventional ultrasound and Sonazoid CEUS features of the four groups of renal masses are shown in Tables 2 and 4 . There were no significant differences in the size, shape, margin, or wash-in patterns ( p > .05). In conventional ultrasound, regarding echogenicity, the frequency of hyper-echogenicity in benign masses (7/7, 100%) was higher than that in ccRCC (6/36, 16.7%) and pRCC (1/5, 20%) ( p all <.05), and a higher percentage of hyper-echogenicity was detected in the non-ccRCC and non-pRCC malignancy groups (5/9, 55.6%) than in the ccRCC group (6/36, 16.7%) ( p all <.05). Regarding CDFI, poor vascularity was observed in all pRCC samples (5/5, 100%), whereas the main CDFI feature in ccRCC was rich vascularity (25/36, 69.4%) ( p < .05). There was no significant difference in the CDFI between the other groups ( p > .05). For the wash-in pattern, the frequencies of fast/similar in ccRCC (29/36, 80.6%) were higher than those in pRCC (1/5, 20%) and the non-ccRCC and non-pRCC malignancy groups (4/9, 44.4%) ( p all <.05). For the wash-out pattern, the frequencies of fast/similar in the ccRCC (31/36, 86.1%), non-ccRCC and non-pRCC malignancy groups (9/9, 100%) were higher than those in the benign group (3/7, 42.9%) ( p all <.05); the frequencies of fast/ similar in the pRCC (5/5, 100%) were higher than those in the ccRCC (31/36, 86.1%), benign group (3/7, 42.9%), and equal to non-ccRCC and non-pRCC malignancy groups (9/9, 100%) ( p all >0.05). A higher percentage of pseudocapsules was detected in the ccRCC (30/36, 83.3%) and pRCC (5/5, 100%) groups than in benign RCC group (2/7, 28.6%) ( p all <.05) ( Figs. 4 and 5 ). A higher percentage of pseudocapsules was detected in the ccRCC group (30/36, 83.3%) than in the non-ccRCC and non-pRCC (4/9, 44.4%) and benign RCC (2/7, 28.6%) groups ( p all <.05). Regarding the degree of peak enhancement, the frequency of hypo-enhancement in the ccRCC group (3/36, 8.3%) was lower than those in the pRCC (4/5, 80%), non-ccRCC and non-pRCC (6/9, 66.7%) groups (all p < .05) ( Fig. 4 ). The frequency of homogeneous enhancement in pRCC (4/5, 80%) was higher than that in ccRCC (2/36, 5.6%), non-ccRCC and non-pRCC malignancies (1/9, 11.1%) (all p < .05). A higher percentage of heterogeneity was detected in the ccRCC group (34/36, 94.4%) than in the benign (4/7, 57.1%) and pRCC (1/5, 20%) groups (all p < .05).
| Size (cm) | Shape | Margin | Echogenicity | CDFI | |||||||
|---|---|---|---|---|---|---|---|---|---|---|---|
| Pathology | <4 | ≥4 | Round/Oval | Irregular | Well defined | Poorly defined | Hyper- | Iso- | Hypo- | Rich vascular | Poor vascular |
| Malignant (n = 50) | |||||||||||
| ccRCC (n = 36) | 13 (36.1) | 23 (63.9) | 22 (61.1) | 14 (38.9) | 27 (75) | 9 (25) | 6 (16.7) | 14 (38.9) | 16 (44.4) | 25 (69.4) | 11 (30.6) |
| pRCC (n = 5) | 2 (40) | 3 (60) | 4 (80) | 1 (20) | 4 (80) | 1 (20) | 1 (20) | 1(20) | 3 (60) | 0 (0) | 5 (100) |
| Non-ccRCC and non-pRCC malignancy | |||||||||||
| chRCC (n = 2) | 1 (50) | 1 (50) | 2 (100) | 0 (0) | 2 (100) | 0 (0) | 2 (100) | 0 (0) | 0 (0) | 1 (100) | 1 (100) |
| SCC (n = 1) | 0 (0) | 1 (100) | 1 (100) | 0 (0) | 1 (100) | 0 (0) | 0 (0) | 1 (100) | 0 (0) | 0 (0) | 1 (100) |
| MTSCC (n = 1) | 0 (0) | 1 (100) | 1 (100) | 0 (0) | 1 (100) | 0 (0) | 0 (0) | 0 (0) | 1 (100) | 1 (100) | 0 (0) |
| Xp11.2/TFE3 RCC (n = 1) | 0 (0) | 1 (100) | 0 (0) | 1 (100) | 0 (0) | 1 (100) | 0 (0) | 1 (100) | 0 (0) | 1 (100) | 0 (0) |
| Metastatic LUAD (n = 1) | 1 (100) | 0 (0) | 0 (0) | 1 (100) | 0 (0) | 1 (100) | 0 (0) | 0 (0) | 1 (100) | 0 (0) | 1 (100) |
| Urothelial carcinoma(n=2) | 0 (0) | 2 (100) | 0 (0) | 2 (100) | 0 (0) | 2 (100) | 2 (100) | 0 (0) | 0 (0) | 1 (50) | 1 (50) |
| Wilms tumor (n = 1) | 0 (0) | 1 (100) | 0 (0) | 1 (100) | 0 (0) | 1 (100) | 1 (100) | 0 (0) | 0 (0) | 1 (100) | 0 (0) |
| Benign (n = 7) | |||||||||||
| AML (n = 5) | 3 (60) | 2 (40) | 3 (60) | 2 (40) | 3 (60) | 2 (40) | 5 (100) | 0 (0) | 0 (0) | 0 (0) | 5 (100) |
| Oncocytoma (n = 1) | 1 (100) | 0 (0) | 1 (100) | 0 (0) | 1 (100) | 0 (0) | 1 (100) | 0 (0) | 0 (0) | 1 (100) | 0 (0) |
| MESTK (n = 1) | 0 (0) | 1 (100) | 0 (0) | 1 (100) | 0 (0) | 1 (100) | 1 (100) | 0 (0) | 0 (0) | 1 (100) | 0 (0) |
Related posts:
 Relationship Between Early and Established Rheumatoid Arthritis Vascular Change of the Dorsalis Pedis Artery Observed with Ultrasound Imaging
 Effects of High-intensity Continuous Ultrasound on Infrapatellar Fat Pad Stiffness and Gliding in Healthy Participants: A Randomized, Single-blind, Placebo-controlled Crossover Trial
 Perfluorobutane-Enhanced CEUS in Intrahepatic Cholangiocarcinoma: Correlating Imaging Features With Liver Backgrounds and Tumor Sizes
 Strain Patterns With Ultrasound for Assessment of Abdominal Aortic Aneurysm Vessel Wall Biomechanics
 Ultrasound and Microbubble-Induced Reduction of Functional Vasculature Depends on the Microbubble, Tumor Type and Time After Treatment
Stay updated, free articles. Join our Telegram channel

Full access? Get Clinical Tree


