Fig. 1
Diagram of a dual-source DECT scanner. Dual-source CT with two X-ray tubes and two corresponding detector arrays mounted in the same gantry operates independently at different voltage settings (140 kV and 80/100 kV) and simultaneously acquires two data sets showing different attenuation levels
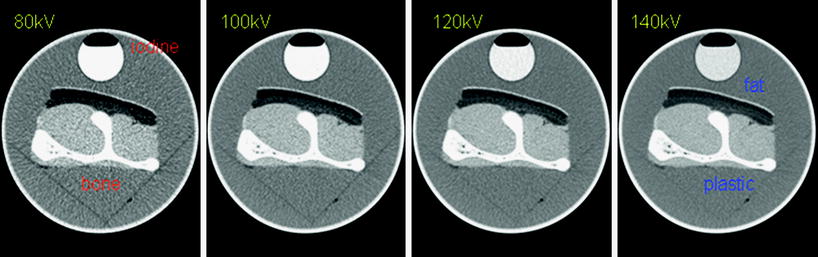
Fig. 2
Basic concept of DECT for material differentiation. Iodine has its maximum attenuation at 80 kV but its CT attenuation markedly decreases with increased voltage. The CT attenuation of bone changes much less when it is scanned with low kV as compared to high kV examination. The CT attenuation of fat increases as the kV setting is increased. Accordingly, changing the X-ray tube’s kV setting results in a material-specific change of attenuation (Reproduced with kind permission from Siemens Healthcare)
Iodine is a commonly used CT contrast agent; clinical observation has shown that iodine contrast agents have stronger enhancement at lower tube voltage settings. In dual-source DECT, we observe a greater photoelectric absorption by iodine at 80 kV than at 140 kV. This phenomenon occurs because the mean photon energy of the 80 kV beam (53 keV) is closer to the K-edge of iodine (33 keV) than that of the 140 kV beam (71 keV). Accordingly, iodine-containing structures are more attenuating at 80 kV than at 140 kV. Dual-source DECT can allow material differentiation on the basis of such energy-dependent attenuation characteristics (Johnson et al. 2007).
Material-specific imaging in dual-source DECT is based on a mathematical algorithm termed “3-material decomposition.” This method is capable of measuring the relative concentrations of three pure constituent materials in scanned tissue by evaluating the attenuation properties of each voxel and by comparing these values with the attenuation coefficients of the three pure constituent materials at low and high kV. In the heart, the 3 materials usually analyzed are soft tissue, fat, and iodine. In addition, an iodine distribution image, or iodine distribution map, is produced via material decomposition along with virtual non-contrast images in which the iodine content has been subtracted from the contrast-enhanced images (Johnson et al. 2007; Vlahos et al. 2010).
3 Configuration of Dual-Source Dual-Energy CT
3.1 First Generation Dual-Source Dual-Energy CT (Siemens Definition)
Dual source CT is equipped with two orthogonally mounted X-ray tubes and two corresponding detector systems. The field of view of the B tube array is smaller (26 cm in diameter), compared with the A tube (50 cm in diameter), due to space limitations on the gantry of the dual-source CT scanner (Fig. 3a). Each detector comprises 40 detector rows, the 32 central rows having a 0.6-mm collimation slice width and the 4 outer rows on either side having a 1.2-mm collimated slice width. Using the z-flying focal spot technique, each detector acquires 64 overlapping 0.6-mm slices per rotation. The shortest gantry rotation time is 330 ms. There is an 8 ms interval between the image acquisitions of the 2 tubes in the same plane. The two X-ray tubes are operated independently with respect to their voltage and current settings, allowing simultaneous acquisition of high and low X-ray energy spectra within a single scan, e.g., one tube (B tube) is operated at 100 kV while the other (A tube) is operated at 140 kV. The tube current can be adjusted separately for each kV level (e.g., 100 mAs/rotation at 140 kV and 165 mAs/rotation at 100 kV), permitting noise level matching the two datasets (Flohr et al. 2006; Petersilka et al. 2008; Kang et al. 2010).
Fig. 3
Schematic illustration of first (Siemens SOMATOM Definition) and second (Siemens SOMATOM Definition Flash)- generation dual-source DECT systems. The first-generation dual-source CT system (a) has the A tube, which is associated with a 50 cm field of view for detector A and is operated at 140 kV, and the B tube, which is associated with a 26 cm field of view for detector B and is operated at 80/100 kV. The second-generation dual-source CT system (b) has a larger 33 cm field of view for detector B, achieved by increasing the angle between the X-ray tubes and detectors from 90° to 94° (Reproduced with kind permission from Siemens Healthcare)
3.2 Second Generation Dual-Source Dual-Energy CT (Siemens Definition Flash)
The latest dual-source CT has several major technical improvements, including faster gantry rotation of 280 ms, increasing the scan field of the detector (increased detector z-coverage), increasing the field of view for detector B from 26 to 33 cm, high-pitch modes for rapid helical acquisition, and pre-patient filtration (Fig. 3b). Of these, pre-patient filtration is arguably the most important. This technical advance improves the discrimination of materials by minimizing the overlap of the two energy spectra. With pre-patient filtration, the lower-energy photons in the 140 kV beam are removed by a tin filter placed at the X-ray tube (Sn140 kV), resulting in a higher mean beam energy. This filtration increases the energy separation by minimizing the overlap of high and low kV spectra and, therefore, improves both the material differentiation and decomposition. In addition, radiation dose is reduced as the low-energy photons are removed from the high-energy X-ray tube spectrum. Pre-patient filtration facilitates the use of a 100 kV low-energy beam, which enables greater tissue penetration and less image noise, compared with 80 kV (Kang et al. 2010).
4 Methodology for Dual-Energy CT Image Acquisition
4.1 Image Acquisition of Rest Dual-Energy CT
DECT acquisition can be performed using the following parameters: 330-ms gantry rotation time, heart rate adaptive pitch of 0.2–0.43, 32 × 2 × 0.6-mm collimation with z-flying focal spot technique, and 165-ms temporal resolution. One tube of the dual-source CT system is operated with 82–114 mAs/rotation at 140 kV, the second tube with 165 mAs/rotation at 80 kV for slim (≤140 lbs) individuals, and 165 mAs/rotation at 100 kV for average-sized (≤200 lbs) and larger patients (Ruzsics et al. 2008). With the scout image, the anatomic range extends from 2 cm below the level of the tracheal bifurcation to the diaphragm in a craniocaudal direction. Oral β-blocker administration is given if the resting heart rate is higher than 70 beats per minute. The retrospectively gated scan uses electrocardiography (ECG)-based tube current modulation with the Mindose protocol. Wider full-dose pulsing window (i.e., 35–75 %) is applied for faster and irregular heart rates, and narrow full dose windows (i.e., 60–80 %) for slower and more regular heart rates. Tube current reduction to 4 % was applied outside the adjusted pulsing windows.
DECT examinations are contrast enhanced, using the routine clinical contrast agent injection protocol, which is controlled by either the test-bolus or bolus-tracking technique. With the test-bolus technique, the time delay between the start of contrast injection and the start of data acquisition is determined by an injection of 20 ml of a non-ionic contrast agent at 6 ml/s through an 18-gauge intravenous antecubital catheter, followed by 30 ml of saline, using a dual-head power injector. The peak time of the test bolus enhancement, as measured by a repetitive scanning at the level of the aortic root, is used as the delay time. Actual contrast agent enhancement is achieved by injecting an initial bolus of undiluted contrast agent, which is then followed by a constant 50 ml volume of a 70 %/30 % saline/contrast agent mixture, and finally 30 ml of pure saline, all injected at 6 ml/s. The initial iodine bolus volume is computed per CT examination using the following formula: volume (milliliters) = duration of CT data acquisition (seconds) × 6. If the duration of CT data acquisition is less than 10 s, a minimum of 60 ml of contrast medium is required (Ruzsics et al. 2008). There is no established optimal scan protocol (amount and speed of contrast administration, scan delay time, etc.) with a bolus-tracking technique. In our center, with the bolus tracking technique, the region of interest is placed into the aortic root, and image acquisition is started seven seconds after the signal density level reaches the predefined threshold of 120 HU. For DECT examinations, a dual-head power injector is used to administer a 3-phase bolus at a rate of 4.5 ml/s. According to scan time and patient’s body mass index, 60–80 ml of undiluted contrast agent is injected, followed by 45 ml of 70 %/30 % contrast agent/saline mixture, and finally 45 ml of saline (Ko et al. 2011).
4.2 Image Acquisition of Stress Dual-Energy CT
Patients undergoing stress DECT perfusion are instructed not to drink coffee or tea, and not to have oral β-blockers for at least 24 h prior to the examination. Two intravenous lines are inserted (18-gauge for contrast medium delivery; 20-gauge for adenosine infusion). Before the examination, the heart rate of each patient is measured. Beta-blockers and nitroglycerine are avoided because of their impact on myocardial perfusion. Stress DECT perfusion is performed using the same imaging parameters as the rest DECT. Blood pressure, standard ECG, and clinical symptoms are carefully monitored during the adenosine infusion and after imaging. Any adverse side effect (e.g., severe tachycardia, tachyarrhythmia, allergic reaction) is grounds for termination of the examination. Adenosine infusion is started at a constant rate of 140 μg/kg/min over six minutes. Retrospectively gated imaging with ECG-based tube current modulation (Mindose protocol) and pitch adaptation is obtained four minutes after the initiation of the adenosine infusion. In our center, contrast agent administration with the bolus tracking technique is the same as that in rest DECT, except that image acquisition starts nine seconds after the signal density level reaches the predefined threshold of 120 HU at the aortic root for increasing differences in contrast enhancement between ischemic and non-ischemic myocardium (Ko et al. 2011).
4.3 Image Reconstruction of Dual-Energy CT
The data sets for the assessment of coronary artery and myocardial perfusion are reconstructed during the phase that depicts the fewest motion artifacts within the full-dose window, usually in the mid-diastolic phase, with reconstruction windows set at 60–75 % of the R–R interval. The recently implemented automatic phase finding algorithm (BestPhase™) is useful for identifying optimal reconstruction phases during systole and diastole without user interaction.
Standard DECT cardiac scan protocol includes a series of different image reconstructions from the same contrast enhanced DECT scan. The first set of transverse gray-scale images is reconstructed using a B26f kernel with a temporal resolution of 165 ms, slice thickness of 0.75 mm, and slice increment of 0.4 mm, for each tube-detector array. By merging 70 % of the high (140 kV) X-ray spectrum and 30 % of the low (80/100 kV) X-ray spectrum, a series of grayscale images is created that is similar to an image obtained using a single-energy CT at 120 kV. This series aims at optimizing the spatial and contrast resolution, and is used for clinical cardiac CT interpretation of coronary artery morphology and stenoses. For the analysis of myocardial perfusion, high-voltage and low-voltage data are reconstructed separately using a dedicated dual-energy convolution kernel (D26f or D30f) with a temporal resolution of 330 ms, slice thickness of 0.75 mm, and an increment of 0.4 mm (Ruzsics et al. 2008; Ko et al. 2011; Schwarz et al. 2008). Ruzsics et al. used a 1.5-mm slice thickness and a 0.5-mm increment to optimize the signal/noise ratio (Schwarz et al. 2008).
4.4 Post-Processing, Display, and Analysis
A single DECT data acquisition can be used to generate a virtual non-contrast image, two single-energy images based on high (140 kV) and low (80 or 100 kV) X-ray spectra, a dual-spectrum merged image, and an iodine distribution image; the iodine distribution can also be superimposed in color over the merged image (merged image with color-coded iodine distribution) (Fig. 4). The reconstructed high- and low-voltage data sets, obtained with DECT, are loaded into a dedicated algorithm, heart perfusion blood volume (heart PBV), for the evaluation of myocardial perfusion. The heart PBV algorithm is incorporated in the dual-energy-image post-processing software application of the Syngo-Multimodality Workplace (syngo Dual Energy, Siemens). Differences in the attenuation of iodine at the two different energies allow for the computation of the iodine distribution within the myocardium and the generation of virtual non-contrast images. The attenuation of epicardial fat on the merged reconstruction is measured for fat calibration of the heart PBV algorithm. In addition, the broad range of iodine concentrations that this study produces requires normalization of the iodine distribution map to the areas of normal myocardial perfusion (Schwarz et al. 2008). Areas with high iodine content, including the myocardium or any cardiac chamber, can be chosen for this process; we primarily normalize using the right ventricular lumen (Fig. 5). The color-coded iodine distribution maps are superimposed onto a grayscale multiplanar reformats of the myocardium. We employ a 70 % overlay of the iodine distribution map over the merged reconstruction with 5-mm thick multiplanar-reformatted short and long axis views for the evaluation of myocardial perfusion. Myocardial blood pool deficits on DECT-based iodine distribution maps are defined as contiguous, circumscribed areas of decreased or absent iodine content within the left ventricular (LV) myocardium, relative to the remote normal myocardium. Myocardial blood pool deficits are assessed quickly and accurately by visual analysis because DECT-based iodine distribution map highlights the areas of decreased iodine in the LV myocardium. Accordingly, visual analysis is mainly used over quantitative analysis for the detection of myocardial blood pool deficits. The AHA/ACC-segmental model (17 segment model) is used to report the findings at perfusion analysis (Schwarz et al. 2008).
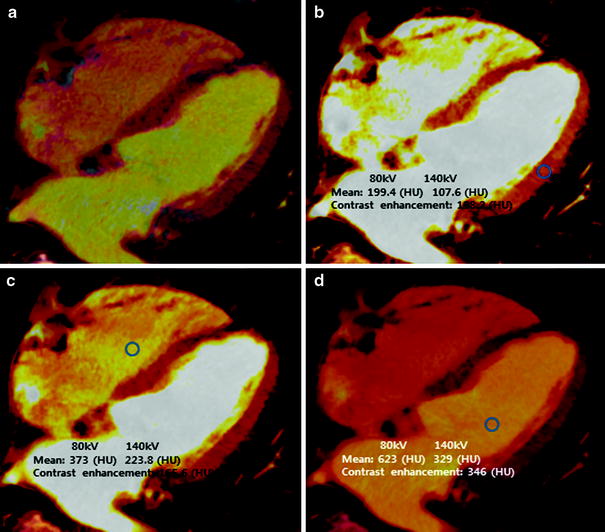
Fig. 4
Diagram of image postprocessing of DECT for analysis of myocardial perfusion. Merged images, which are produced by mixing 140 kV and 80/100 kV datasets at a ratio of 7:3, respectively, are equivalent to coronary CT angiography images obtained at approximately 120 kV. Using dual-energy material decomposition software, the iodine component is separated from the images obtained from high (A tube) and low (B tube)-energy X-ray spectra and is displayed in color-coded iodine distribution (overlay) images. Grayscale virtual non-contrast images are generated by removing iodine from the source images. Final images are obtained by mixing iodine distribution images and virtual non-contrast images, typically at a ratio 7:3, for assessment of the myocardial blood pool
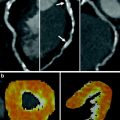
Fig. 5
Normalization of iodine distribution map. a Color-coded “iodine distribution map,” which is superimposed on grayscale “virtual non-contrast image” multiplanar reformat of the myocardium. Because of a broad range of iodine concentration within the myocardium, the map must be normalized to an area of normal myocardial perfusion b, the right ventricle c, or the left ventricle d. Usually, areas of highest iodine content in the myocardium are recommended for normalization of the iodine distribution map
5 Overview of Imaging Modalities for Coronary Artery Disease
Conventional coronary angiography (CCA) is considered as the established, anatomic gold standard for the diagnosis of CAD by direct visualization and grading of coronary stenosis. However, CCA is invasive, costly, and not without risk. In addition, anatomical assessment of the hemodynamic significance of coronary stenosis, determined by CCA, correlates poorly with functional assessment of the fractional flow reserve (FFR) (Chandrasekar et al. 2001; Meijboom et al. 2008). SPECT myocardial perfusion imaging (MPI) is an accepted clinical standard for the detection and quantification of myocardial ischemia. However, SPECT has the disadvantages of poor spatial resolution, radiation exposure, and attenuation artifacts. In addition, SPECT does not detect subclinical, non-obstructive coronary atherosclerosis and consistently underestimates the true extent of multivessel CAD (balanced ischemia) (Hachamovitch et al. 1996; Heller et al. 2009) (Fig. 6). Recent technical advances and improvements in cardiac CT have allowed for the non-invasive detection of significant coronary stenosis with high diagnostic accuracy. In addition, CCTA visualizes the coronary vessel wall, thereby, providing plaque composition and size, and vascular remodeling (Mühlenbruch et al. 2007; Vanhoenacker et al. 2007). However, CCTA has a tendency to overestimate the severity of CAD in patients with high pretest probability of CAD. Furthermore, in its current form, CCTA does not provide information regarding the hemodynamic significance of coronary stenosis. Determining the hemodynamic significance of a morphologically intermediate stenosis (50–70 % lumen reduction) remains crucial before a referral for the revascularization treatment (Meijboom et al. 2008; Gaemperli et al. 2008). Consequently, there is great interest in combining non-invasive CCTA with SPECT-MPI. However, the hybrid imaging system requires the cost associated with combining two imaging modalities and increases the radiation burden to the patient (Santana et al. 2009; Gaemperli et al. 2007). Recently, cardiac magnetic resonance (MR) with adenosine stress has been established as a non-invasive diagnostic modality with a high diagnostic accuracy for inducible perfusion defect, without radiation exposure or attenuation artifacts. In particular, cardiac MR has superior spatial resolution over SPECT, and thereby allows for a depiction of subendocardial perfusion defects in patients with microvascular disease. However, adenosine stress cardiac MR perfusion can be limited by availability, claustrophobia, obesity, poor gating, motion artifacts, and contraindications, such as pacemaker or defibrillators (Nandalur et al. 2007; Watkins et al. 2009).
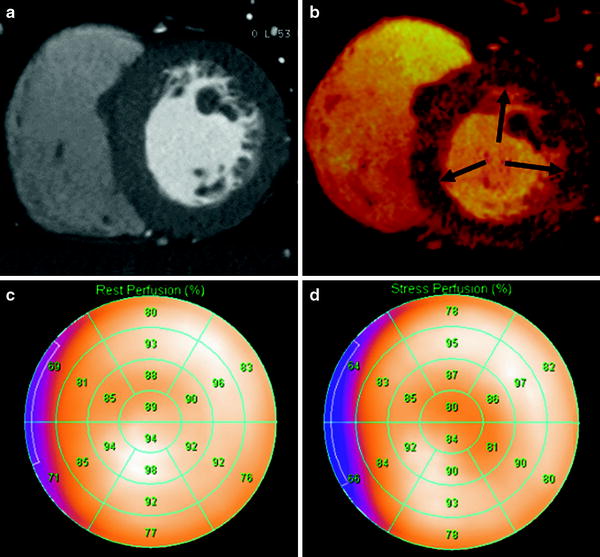
Fig. 6
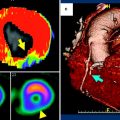
Comparison of stress DECT perfusion and myocardial perfusion SPECT for balanced ischemia. The CT perfusion image at rest (a) does not show any perfusion defects in the left ventricular (LV) myocardium. DECT-based iodine distribution mapping during adenosine infusion (b) reveals concentric blood pool deficits (arrows) in mid LV myocardium. Findings are not correlated with myocardial perfusion SPECT acquired at rest (c) and stress (d), which reveal limitation of myocardial perfusion SPECT for balanced ischemia. Conventional coronary angiogram (not shown) reveals significant stenoses at the left main coronary artery and the 3 major epicardial coronary arteries
6 Overview of Single-Energy CT Perfusion Imaging
Myocardial perfusion is strictly defined as the flow of blood to the myocardium and is often used as a relative myocardial blood volume or regional level of myocardial iodine enhancement. CT myocardial perfusion images are obtained using a static (single-phase first-pass myocardial enhancement imaging) or dynamic acquisition (quantitative time resolved myocardial perfusion imaging). Several CT-based MPI studies in animal models have demonstrated that the concentration of iodinated contrast agent in myocardium is directly proportional to the measured CT attenuation number; that iodinated contrast agent has similar pharmacokinetics to gadolinium-based contrast agents used for stress cardiac MR perfusion; that adenosine stress CT perfusion imaging correlates well with microsphere-derived myocardial blood flow; and, that ischemic myocardial perfusion defect can be diagnosed by an adenosine-induced stress CT perfusion imaging (George et al. 2006, 2007). Studies using adenosine-induced stress CT perfusion imaging have shown good diagnostic accuracy for the detection of ischemic myocardium caused by hemodynamically significant coronary artery stenosis, and increasing the value of CCTA through the detection of hemodynamically significant CAD (Blankstein et al. 2009; Rocha-Filho et al. 2010; Ko et al. 2012b) (Fig. 7). More recently, dynamic CT perfusion has provided results comparable to cardiac MR perfusion for the differentiation between normal and ischemic myocardium. Dynamic CT perfusion has also provided an incremental diagnostic value for the detection of hemodynamically significant coronary stenosis by quantifying myocardial blood flow (Bamberg et al. 2011). With the technical advances of multidetector computed tomography (MDCT), including dual-source CT and wide-area detector CT, CT has grown increasingly capable. By combining direct visualization and grading of coronary stenosis and plaque visualization obtained by CCTA with myocardial perfusion imaging provided by CT perfusion, CT is a single technological modality advantageously poised to provide a potential one-stop shop for the coronary risk assessment and possibly the approach to coronary intervention.
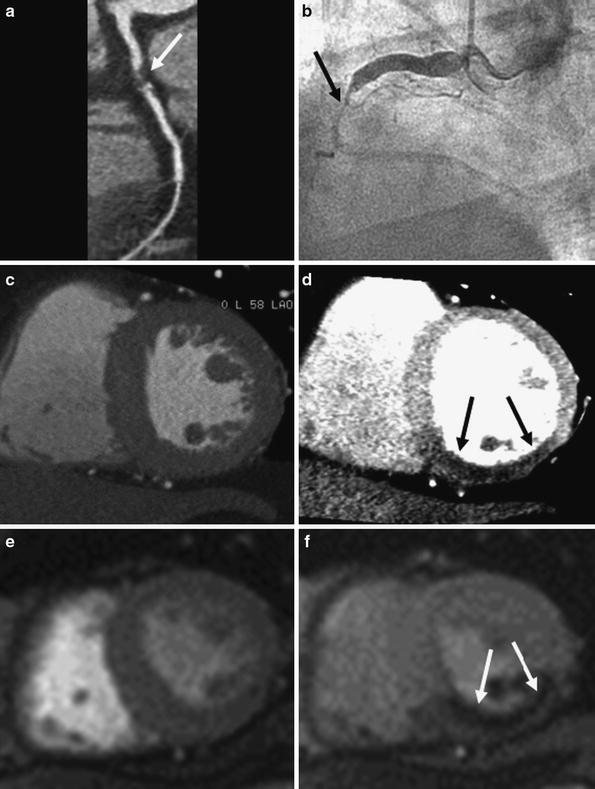
Fig. 7
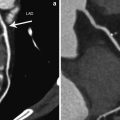
Representative example of single-energy CT perfusion identifying single-vessel disease. Curved multiplanar reformatted coronary CT angiographic image (a) shows total occlusion with non-calcified plaque (arrow) in the middle segment of the right coronary artery (RCA). Conventional coronary angiogram (b) confirms the subtotal occlusion (arrows) in the middle RCA. Rest (c) and stress (d) single-energy CT perfusion images reveal reversible transmural perfusion defects (arrows) in the mid inferoseptal and the inferior left ventricular myocardium. Findings are in good correlation with cardiac MR acquired at rest (e) and stress (f), which reveal reversible subendocardial perfusion defect (arrows) in the same myocardial areas
7 Dual-Energy CT Perfusion Imaging
7.1 Dual-Energy CT at Rest for Myocardial Perfusion
Rest DECT perfusion is acquired using retrospective ECG-gating with tube current modulation and a single-phase first-pass contrast enhancement protocol. With two synchronous CT acquisitions at different tube voltages, DECT allows for the assessment of myocardial perfusion status (or myocardial blood volume) by analyzing the iodine distribution within the myocardium (Fig. 8). The clinical evidence supporting the accuracy and feasibility of rest DECT for the assessment of myocardial perfusion deficits comes from three published single-center studies. Ruzsics et al. (2008) performed the first systematic investigation into the usefulness of cardiac DECT for diagnosing CAD and myocardial ischemia; they demonstrated that DECT had 91 % sensitivity and 91 % specificity with 91 % accuracy, in comparison with SPECT, for detecting any type of myocardial ischemia on a segmental basis; compared to CCA, DECT was found to have 92 % sensitivity, 79 % specificity, and 90 % accuracy for detecting the myocardial blood pool deficits on a segmental basis. In a recent study by Ruzsics et al. (2009), 36 patients with equivocal or incongruous SPECT results underwent single-phase, contrast-enhanced DECT at rest. DECT correctly identified 85 of 89 (96 %) fixed perfusion defects, and 60 of 68 (88 %) reversible myocardial perfusion defects. Overall, DECT had a sensitivity of 92 % and a specificity of 93 % with an accuracy of 93 % for type-independent detection of myocardial perfusion defects seen on SPECT. Interestingly, rest DECT is able to depict reversible perfusion defects only seen on stress SPECT images (Fig. 9). Although DECT iodine distribution maps at rest had a sensitivity of 88 %, a specificity of 89 %, and accuracy of 89 % for the detection of reversible perfusion defect, performance of rest DECT was substantially lower for the detection of reversible perfusion defects than that of mixed and fixed perfusion defects (Ruzsics et al. 2009). The physiological mechanism behind such a concordance remains controversial as DECT was not performed under stress. Possible explanations for DECT detection of reversible perfusion defects, as hypothesized by Ruzsics et al. (2008, 2009), include the superior spatial resolution of CT for smaller areas of ischemia compared with SPECT, an intrinsic vasodilatory effect of the iodinated contrast agent, and different myocardial distribution kinetics of the iodinated contrast agent compared with the radiopharmaceutical tracers of SPECT.
Most recently, Wang et al. (2011) demonstrated on a per-vessel basis that sensitivity, specificity, and accuracy of DECT coronary angiography without DECT perfusion were 82, 91, and 86 %, respectively; with the addition of DECT perfusion, an overall improvement to 90, 86, and 88 %, respectively, was observed. This study demonstrated an incremental value of DECT on the detection of CAD (Fig. 9).
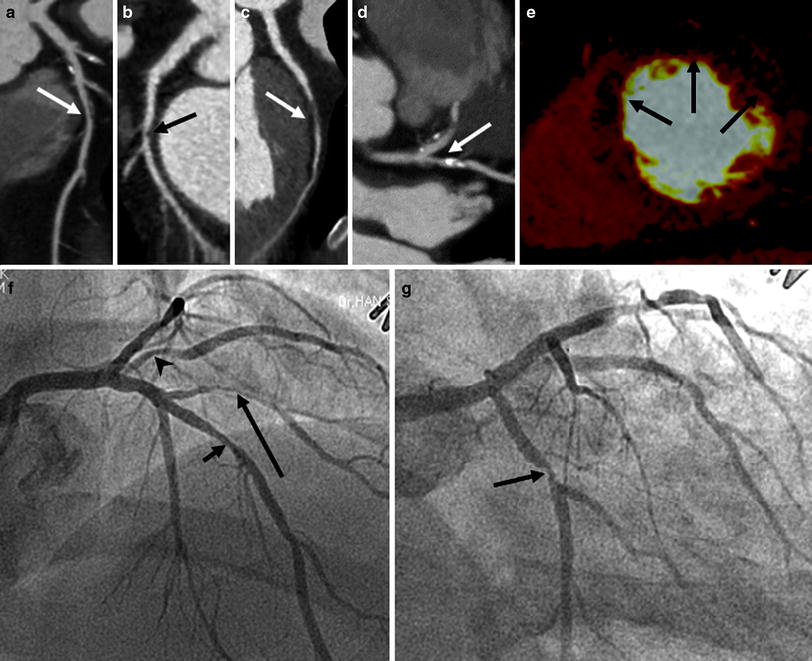
Fig. 8
 Time-Resolved CT Imaging of Myocardial Perfusion: Dual-Source CT
 Evaluation of the Myocardial Blood Supply: Single-Source, Single-Energy CT
 CT Angiography: State of the Art
 are We Interested in Viability?
 Time-Resolved Imaging of Myocardial Perfusion Using 256-Slice Computed Tomography
 Myocardial Perfusion Imaging: Clinical Implementation


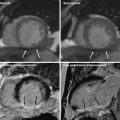
Representative example of rest DECT perfusion identifying multivessel disease. Coronary CT angiograms (a–d) show significant stenoses with mixed calcified and non-calcified plaques (a, arrow) in the middle segment of the left anterior descending coronary artery (LAD), non-calcified plaque (b, arrow) in the proximal segment of the left circumflex artery (LCx) and the first diagonal branch (D1, arrow in c) and calcified plaque (d, arrow) in the ramus intermedius (RI). DECT-based iodine distribution mapping at rest (e) reveals blood pool deficits (arrows) in the mid anteroseptum, anterior and anterolateral left ventricular myocardium. Conventional coronary angiograms (f, g) confirm the presence of significant stenoses in LAD (short arrow), D1 (long arrow), RI (arrowhead), and LCx (middle arrow)
Related posts:
Time-Resolved CT Imaging of Myocardial Perfusion: Dual-Source CT
Evaluation of the Myocardial Blood Supply: Single-Source, Single-Energy CT
CT Angiography: State of the Art
are We Interested in Viability?
Time-Resolved Imaging of Myocardial Perfusion Using 256-Slice Computed Tomography
Myocardial Perfusion Imaging: Clinical Implementation
Stay updated, free articles. Join our Telegram channel
Full access? Get Clinical Tree
