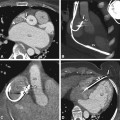
Fig. 8.1
Patient positioning for cardiac CT. Examining the patient feet-first (Panel A) has the advantage of providing better access to the patient than with head-first positioning. The arms are comfortably placed above the head to improve penetration of the chest by the X-rays, thereby reducing artifacts and radiation exposure. The patient is placed in an offset position, slightly to the right side of the table (arrows, Panel B), to ensure that the heart is as close as possible to the center of the scan field. ECG electrodes are attached in the area of the supraclavicular fossa after the patient has elevated his or her arms. The ECG electrodes should not be attached near the biceps or deltoid muscles, in order to minimize the effects of muscle tremor on the ECG (Fig. 8.5)
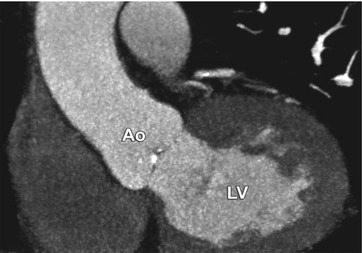
Fig. 8.2
Motion of the patient between planning of the scan and the actual scan resulted in a scan range that extended too far cranially, and therefore the caudal portions of the heart were missed. Oblique coronal maximum-intensity projection in the left ventricular outflow tract view. Ao aorta, LV left ventricle
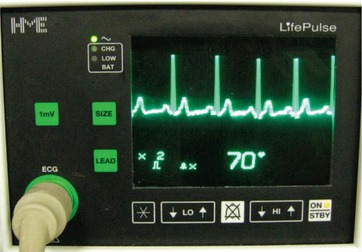
Fig. 8.3
ECG monitor with regular ECG and sufficiently high R waves for gating of the examination. However, heart rate reduction using beta blockade should be considered
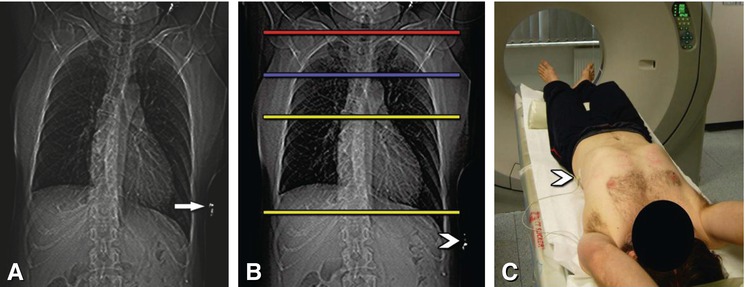
Fig. 8.4
Positioning of ECG leads and planning of the scan. A typical anterior scanogram (Panel A) with a too-high electrode (arrow) on the left side of the chest, which can lead to artifacts over the cardiac structures. Such artifacts can be easily avoided by lower placement of the electrode (arrowhead in Panels B and C). The typical anatomic scan range for patients with suspected or known coronary artery disease is indicated by the yellow lines and extends from above the left atrium to immediately below the heart (Panel B). Because of the high effective dose, the scan range should be as short as reasonably achievable. For imaging of venous (blue line) or internal mammary artery bypass grafts (red line), the beginning of the scan range needs to be extended (Panel B)
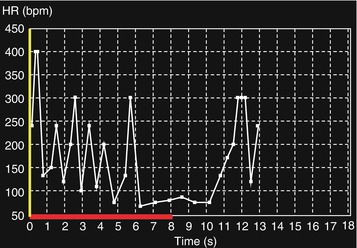
Fig. 8.5
Unconscious muscle shivering led to a highly variable (between 60 and 400 beats per min) and unreliable heart rate recording. Covering the patient with a blanket will reduce shivering, and the ECG will very likely become normal
8.1.3 Nitroglycerin
Sublingual nitroglycerin administration increases the diameter of the coronary arteries (Fig. 8.6) and therefore facilitates image interpretation and comparability of the results (percent diameter stenosis) with those of cardiac catheter examination (which is often performed with intracoronary nitroglycerin administration). The onset of action of sublingual nitroglycerin spray (Fig. 8.7A) is about 10–20 s after administration, and its effect lasts for about 10 min. Patients should be given two to three sprays of sublingual nitroglycerin (corresponding to a dose of about 0.8–1.2 mg). Complications of nitroglycerin administration include tachycardia and hypotension (which may cause headaches). Relevant reflex tachycardia is rare, and this unlikely event should not prevent physicians from taking advantage of the beneficial vasodilatory effect of nitroglycerin (Fig. 8.6).
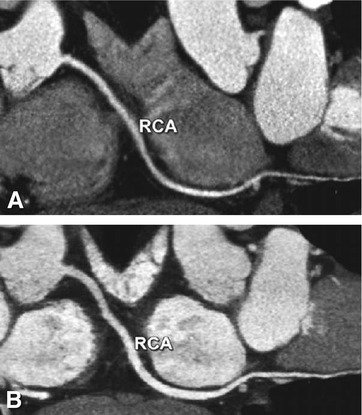
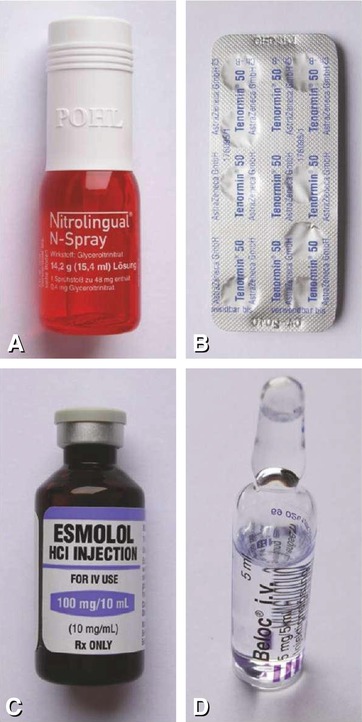

Fig. 8.6
Effect of sublingual nitroglycerin on the coronary vessel diameters. Curved multiplanar reformation of the right coronary artery (RCA) in a patient who underwent coronary CT angiography without (Panel A) and after sublingual nitroglycerin (Panel B). Nitroglycerin administration leads to a relevant increase in the coronary diameter (on average 12–21%), which also improves visibility of the distal vessel segments

Fig. 8.7
Drugs for premedication in patients undergoing coronary CT. Sublingual nitroglycerin (Panel A) increases coronary vessel diameters and facilitate comparison of the findings to conventional coronary angiography. Oral (Panel B, metoprolol or atenolol) and/or intravenous beta blockade (Panels C and D, esmolol or metoprolol) is important to reduce heart rate in order to improve image quality and increase diagnostic accuracy as much as possible
8.1.4 Beta Blockade and If Channel Blockade
The heart rate can be reduced (Fig. 8.8) by oral administration of a beta blocker about 1 h before CT scanning (e.g., 50–150 mg atenolol, Fig. 8.7B), or intravenous administration of an agent with rapid onset of action and shorter duration of action (e.g., esmolol at a dose of 25–50 mg min−1 [0.5 mg kg−1 bodyweight per min], Fig. 8.7C; or metoprolol at 2.5–5 mg min−1, Fig. 8.7D) with the patient on the table. All intravenous beta blockers should be injected slowly, and the examiner must wait and see how the patient reacts to the initial dose (e.g., 20–30 mg of esmolol) before determining the further injection protocol. The onset of action of esmolol is approximately 2–5 min, and the half-life is only 9–10 min. Therefore, a lower risk of complications such as bradycardia can be expected with intravenous beta blockade, while oral beta blockers tend to lower heart rate more effectively. Thus, beginning with oral beta blockade and adding intravenous beta blockers if needed is the most common approach to lowering the heart rate. Another important effect of beta blockers is the reduction of heart rate variability, which significantly improves image quality.
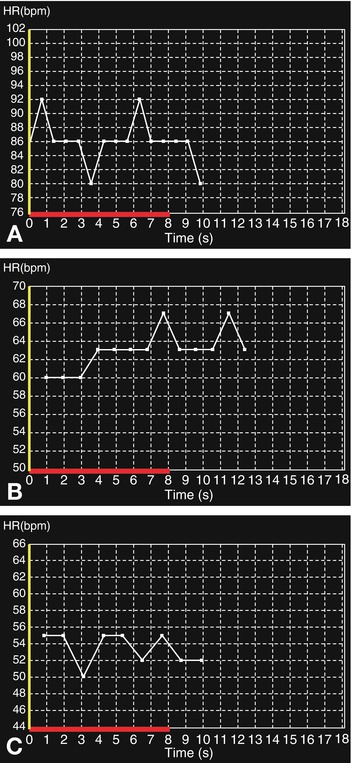

Fig. 8.8
Heart rate reduction using intravenous beta blockade. The patient (90 kg) had an initial heart rate of 80–92 beats per min during breath-hold training (Panel A). An initial dose of 10 mg metoprolol (equivalent to approximately 100 mg esmolol) reduced the heart rate to 60–67 beats per min (Panel B). After a second injection of 10 mg metoprolol, the patient’s heart rate was adequately reduced to 50–55 beats per min during the final breath-hold training period (Panel C). Following contrast injection, the heart rate remained stable at 55 beats per min. In this case, the dose of intravenous beta blockers might have been reduced if oral beta blockers had been administered before the patient entered the scanner room
In our experience, a resting heart rate of 60 beats per min is a good threshold above which to give oral beta blockers. Up to a threshold of about 65 beats per min, good image quality can almost always be achieved and prospective acquisitions protocols (“step-and-shoot”) with reduced effective dose can be applied. In patients with heart rates of more than 80 beats per min, a combination of oral and intravenous beta blockers is very likely needed to reduce the heart rate sufficiently. A potent alternative that avoids the contraindications of beta blockers (Chap. 6) is the oral administration of ivabradine (e.g., 5 mg 1 h before CT). This drug is a selective If channel blocker and has been shown very effective in achieving target heart rates, either alone or in combination with beta blockers.
In general, beta blockers should be administered in accordance with local practice and guidelines where applicable. Note that atropine must be available as an antidote whenever beta blockers are given. Complications of beta blockers are bradycardia, hypotension, and acute asthmatic episodes. The foremost measure to alleviate the initial symptoms of bradycardia and hypotension is to elevate the patient’s legs and administer saline intravenously. In case of severe hypotension, 0.5–1.0 mg atropine should be given intravenously. Nevertheless, serious complications of beta blockers are very rare and, in patients with high heart rates, should not prevent us from making use of the positive effects of beta blockers in terms of improved image quality and diagnostic accuracy at a markedly decreased effective dose. In case of an insufficient effect of beta blockade, intravenous conscious sedation (e.g., 1 mg of midazolam or lorazepam) is a very effective alternative to slow heart rate and may improve image quality in selected patients.
8.1.5 Planning the Scan
When a CT scan is performed for suspected coronary disease or follow-up of coronary artery stents, the scan range extends from above the left atrium to immediately below the heart (Figs. 8.4 and 8.9). As 1 cm of a retrospective helical scan is equal to an effective dose of 1–2 mSv, every effort should be made to limit the scan range as much as possible. For imaging of the ascending aorta or the aortic and/or pulmonic valve, the start of the scan range needs to be extended above the aortic arch (Fig. 8.4). This scan range is also sufficient for patients who have undergone sole venous coronary bypass grafting, whereas in patients with left or right internal mammary artery grafts, the scan should start approximately in the middle of the clavicle (Fig. 8.4) to include the full length of these grafts. These different scan lengths highlight the importance of taking into account clinical information about previous treatments and diagnostic tests to tailor the examination to the individual patient’s needs.
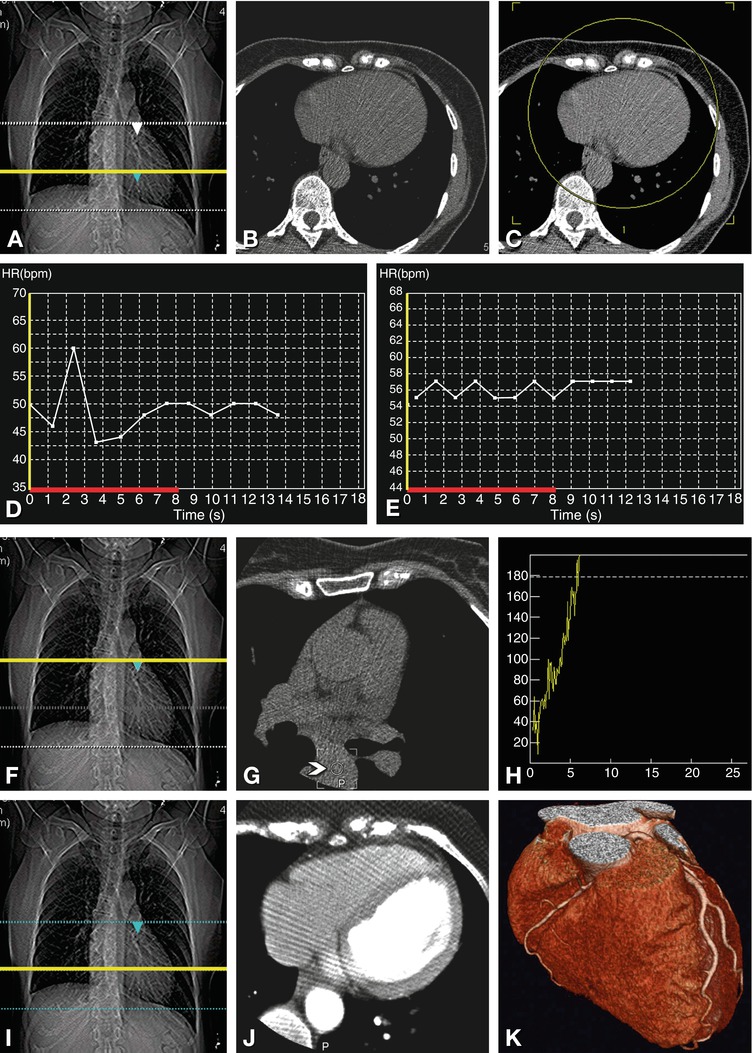

Fig. 8.9
Planning and conducting the scan. The scan range for a typical coronary CT extends from above the left atrium to immediately below the heart (dotted lines in Panel A). We then perform a single axial scan at the level of the largest diameter of the heart (Panel B), which is indicated by a yellow line in Panel A. We use this axial image to determine the 180–200 mm reconstruction field of view (yellow circular region in Panel C) to make optimal use of the maximum resolution provided by CT scanners (10 line pairs per cm). Breath-hold training not only familiarizes the patient with the breathing instructions for the actual coronary scans but also allows monitoring of heart rate and variability during this period (Panel D). If the heart rate variability is above 10% (43–60 beats per min), as shown in Panel D, either further relaxation of the patient or beta blockade is necessary to reduce the RR interval variability to less than 10%, as shown in Panel E (55–57 beats per min). By obtaining another axial scan at the level of the planned beginning of the helical coronary acquisition (Panel F), we can make sure that no coronary vessels are visible on this axial image (Panel G) that might not be included in the planned scan region. Alternatively, the unenhanced calcium scan can be used to define the start and end of the coronary scan. This axial image (Panel G) is also used to define a circular region of interest (arrowhead) in the descending aorta. This region of interest is subsequently used to track the arrival of the contrast agent bolus (Panel H) and to start the helical scan at a threshold of 180 Hounsfield units. Once the threshold has been reached, a simple, 5-s breathing instruction is given (“Please breathe in and then hold your breath”). The helical scan is then started with a delay of 3 s, to allow the heart to return to normal after inspiration. During the subsequent helical acquisition, the moving position of the online images is indicated by a yellow line on the scanogram (Panel I). These online images (Panel J, in this case showing an example at the level of the largest diameter of the heart) can be used to stop the acquisition once the caudal border of the heart has been reached, in order to reduce radiation as much as possible. The results of this coronary CT angiography are shown in Panel K
The scan field of view (axial extension of the radiated area) should be as small as possible to reduce the radiation exposure and, most important, to increase the spatial resolution (since small focus spots are used). We use, for instance, 320-mm scan fields of view (medium size) for coronary imaging, which reduces radiation exposure by 20–25% when compared with large scan fields of view (Fig. 8.9). The scan field of view needs to be differentiated from the smaller reconstruction field of view, which determines the size of the images to which the standard 512 × 512 CT matrix is applied. If the scanner allows the determination of this reconstruction field of view during the scanning procedure, it is clearly advisable to do so (Fig. 8.9), as this precaution will avoid potential mistakes, such as forgetting to reduce the reconstruction field of view afterward and reconstructing the coronary images on large fields of view.
8.1.6 Breath-Hold Training
Temporal resolution can be improved by testing the patient’s heart rate before the examination using the same breathing instructions (“Please breathe in and then hold your breath”) as during the actual scan (Fig. 8.9). The information on the individual patient’s heart rate range during the trial breath-hold can be used on some scanners to automatically adjust scan parameters such as pitch and gantry rotation time to the individual heart rate and heart rate variability. Even more importantly, breath-hold training ensures that a patient can actually hold his or her breath as long as necessary for the scan (Fig. 8.10). Heart rate variability during breath-hold training should be less than 10% (Fig. 8.9), because greater variability will degrade image quality. Breath-hold training is also a good opportunity to remind the patient that scanning is not performed at full inspiration but at about 75% of maximum inspiration, because the increased intrathoracic pressure at full inspiration (Valsalva maneuver) might reduce inflow of the contrast agent.
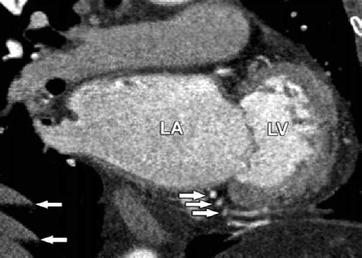

Fig. 8.10
Breathing-related motion artifacts leading to multiple visualizations of the right coronary artery and diaphragm and degraded images of the caudal portions of the heart (arrows). Such artifacts can be avoided in most patients by breath-hold training to ensure that the patient can hold his or her breath as long as is required for scanning. If the patient is unable to do so, breath-hold capacity can be improved by preoxygenation. LA left atrium, LV left ventricle
8.1.7 Scanning Parameters
Tube current should be adjusted to the patient’s body weight or dimensions to ensure a constant high image quality regardless of body mass, while keeping the effective radiation dose to a minimum (Table 8.1 and Fig. 8.11). The effective dose can be reduced effectively by choosing the smallest possible scan, since a range of about 1 cm of a retrospective scan corresponds to the effective radiation dose of 5–10 mammographies (each an effective dose of approximately 0.2 mSv). A further significant reduction of 10–40% and 60–90% can be achieved by ECG-gated tube current modulation and prospective ECG triggering (“step-and-shoot”), respectively. Nevertheless, these techniques should only be used in patients with slow heart rates (≤65 beats per min) and low heart rate variability to maintain adequate image quality. In patients with a slim chest, use of a lower tube voltage of 80 or 100 kV is another useful approach to reduce effective dose without a loss of image quality. Whether or not such a situation is present can be decided using the attenuation information on the scanogram and the area of the thoracic solid tissue. Whether the best kV setting can be automatically predicted by scanner software is under clinical investigation. Simply using a low body mass index or body weight of patients to predict kV settings is arguably less accurate than measuring the attenuation on the scanogram because of great interindividual variations in thoracic tissue and body mass index or weight. In selected patients with small chest dimensions and low and stable heart rates, recent approaches to dose reduction can result in very small effective doses (Fig. 8.12).
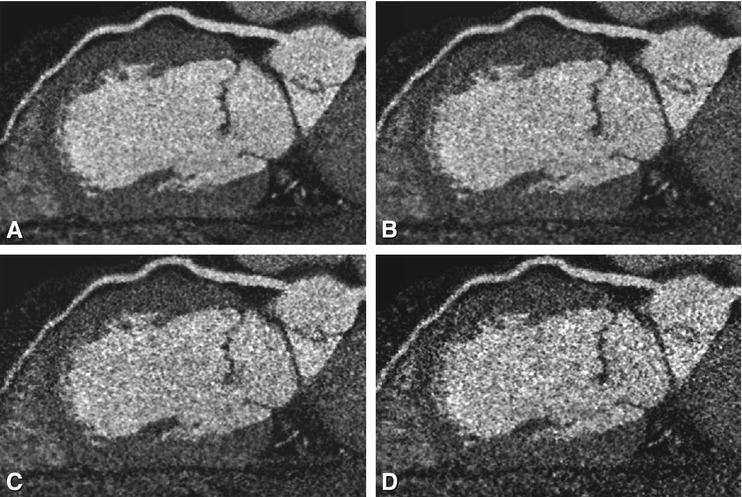
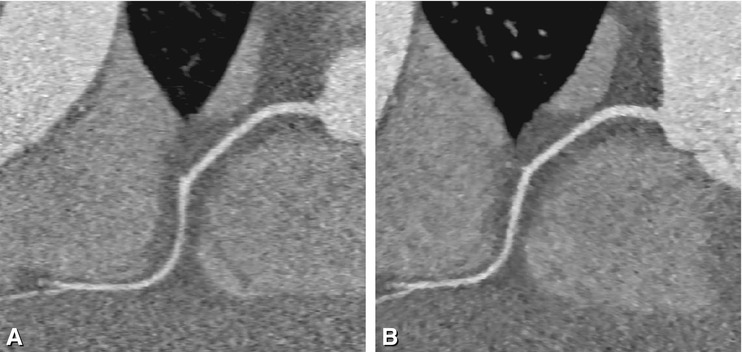
Table 8.1
Scanner settings for CT coronary angiography
Body weight | kV | mA | |
|---|---|---|---|
Pitch of 0.2 to <0.225a | Pitch of >0.225 | ||
<60 kg (<132 lb) | 120 | 300 | 300 |
60–80 kg (132–176 lb) | 120 | 340 | 360 |
>80 kg (>176 lb) | 120 | 360 | 400 |

Fig. 8.11
Effect of tube current on image quality. Curved multiplanar reformations along the left anterior descending coronary artery in a patient with a body weight of 110 kg and a body-mass index of 32. The scan was acquired with a mA of 360 and is shown in Panel A. Using the raw data for this patient, we simulated (Panels B–D) what the images would look like with lower mA settings (performed in cooperation with Toshiba; Okumura-san and Noshi-san). These panels represent mA settings of 300 (Panel B), 250 (Panel C), and 200 (Panel D). Already at 300 mA (Panel B), the curved multiplanar image looks much grainier (salt-and-pepper appearance). At the lowest mA settings (Panel D), it becomes impossible to rule out significant stenoses and plaques in the mid-segment of this vessel. This situation illustrates the importance of adjusting the tube current to the size of each patient. It is important to note that these images represent simulations, and the differences would be even larger in actual repeated scanning (which would be unethical)

Fig. 8.12
Dramatic reduction of effective radiation dose is possible in selected patients. Example of a curved multiplanar reformation of the right coronary artery reconstructed using filtered backprojection (Panel A) and sonogram-affirmed iterative reconstruction (Panel B) in a patient with a slow and stable heart rate of 53 beats per min and a weight of 62 kg at a height of 170 cm. Scanning was done by using 80 kV and 50 mAs, resulting in a dose-length product of only 4 mGy.cm (Used with permission from Schuhbaeck et al. Eur Radiol 2013a)
Stay updated, free articles. Join our Telegram channel

Full access? Get Clinical Tree


