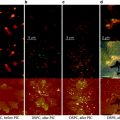
Fig. 1.
Comparative analysis of RNA/DNA FISH visualized by wide-field fluorescence microscopy and 3D-SIM. Upper panel: RNA-FISH on a mouse C2C12 cell nucleus with biotin-labeled cDNA-probes against the noncoding Xist-RNA, detected with Alexa 488-conjugated Streptavidin (green ). DNA has been counterstained with DAPI (gray ). Depicted are the same optical midsection as wide-field, deconvolved wide-field, and 3D-SIM image. The selected magnified region shows one of the two inactive X-chromosomes (Xi) typically seen in these polyploid cells. Orthogonal midsections highlight the increased axial resolution. Further, 3D-SIM allows to discern the greater compaction of the Xi chromatin, as reflected by the DAPI staining and to find Xist-RNA as distinct structures preferentially located in the less intense DAPI regions of the Xi. Lower panel: DNA-FISH on a C127 cell nucleus hybridized with probes against the pericentromeric major satellite repeats (MaS) detected with Alexa 594 (red), the centromeric minor satellite repeats (MiS) detected with Alexa 488 (green ) and counterstained with DAPI (gray). Note the spatial separation of MiS domains from individual sister chromatids of replicated chromosomes (inset), resolvable both in lateral and axial direction only by 3D-SIM. Scale bar represents 5 μm (inset 1 μm).
Three-dimensional structured illumination microscopy (3D-SIM) is one of a number of recently emerging cutting-edge optical imaging techniques that circumvent the long-standing resolution barrier (11–14). In this approach, the sample is illuminated with multiple interfering light beams instead of a plane wide-field illumination. This entails the emitted light to contain higher frequency image information encoded as observable modulations of the image, in a manner similar to the formation of Moiré patterns. From a series of 15 raw images per plane recored with shifted and rotated illumination pattern, this extra information is decoded computationally to reconstruct a 3D image stack with a lateral resolution of ±120 nm and an axial resolution of ±300 nm, about equivalent to an eightfold improvement in volumetric resolution compared to conventional light microscopy (15–17). An important benefit of 3D-SIM is the ability to acquire optical serial sections of specimens up to 20 μm in depth and to simultaneously image multiple colors using a broad range of standard fluorescent dyes. To date, a growing number of publications have demonstrated the general applicability and versatility of 3D-SIM to address a wide range of cell biological questions (17–22). To this end, however, a careful readjustment of labeling schemes and protocols is required, in order to fully explore the potential of super-resolution imaging approaches (23).
The combination of FISH and 3D-SIM in three-dimensionally preserved specimen promises great potential (24) allowing the precise localization of selected RNA or DNA probes, in particular of very small sizes, in relation to structurally distinct chromatin domains, while being able to discern dedicated features of nuclear morphology (Fig. 1, right panel). It is worth considering, however, that harsh denaturation of the double stranded DNA template is necessary to achieve hybridization, raising questions on the preservation of subnuclear structures on the level of resolution obtained (Fig. 2) (25).
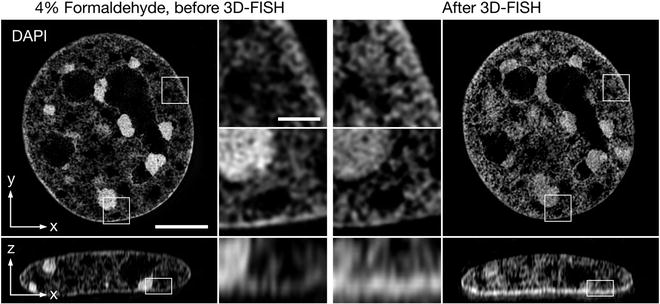
Fig. 2.
Effect of FISH treatment on the nuclear morphology. Left panel: Mouse C127 cell nucleus fixed with 4% formaldehyde, permeabilized with 0.5% Triton/PBS and counterstained with DAPI and imaged with 3D-SIM. Right panel: The same cell nucleus relocated after demounting, FISH and re-stained with DAPI for comparison. The selected magnifications indicate the degree of preservation of eu- and heterochromatic chromatin ultrastructure on the level of resolution obtained with 3D-SIM. While subtle changes are noticeable (e.g., slight swelling of euchromatin, less prominently stained chromocenter) the overall morphology appears well preserved. Scale bar represents 5 μm (inset 1 μm).
We focus here on the preparation of high-quality samples. It is important to keep in mind that the sample itself is an integral part of the optical system. At the same time, it is subject to the largest variation in quality, but also the most amenable to the investigator. Accordingly, the optical quality of the sample needs to be matched as well as possible to avoid any evitable aberration, e.g., by refractive index mismatch or impurities (10, 26). Further emphasis should also be put on an optimal signal-to-background level, which is pivotal for 3D-SIM as any additional sources of light scattering and/or blur reduce the modulation contrast of the structured illumination and compromise the reconstruction quality. Finally, bleaching of the sample during recording of a large number of raw images per dataset needs to be minimized to no more than ∼30% to avoid reconstruction artifacts. To fulfill these criteria, an overall thorough sample preparation procedure is required, where utmost care has to be taken in all steps to preserve sample integrity and keep the preparation as clean as possible, prerequisites that are essential in order to acquire high-quality data reconstructions. While 3D-FISH protocols have been well established for conventional imaging approaches (2), we aim to provide optimized protocols that meet the special requirements for optimal super-resolution 3D-SIM imaging.
In the following we focus on a protocol for 3D-FISH of genomic DNA targets, which can also be used for the delineation of robust nuclear RNA transcripts such as Xist-RNA. For elaborated methods to detect single RNA transcripts we refer to refs. 27–30.
2 Materials
2.1 Chemicals
1.
Formaldehyde, 37% in H2O stabilized with ∼10% methanol or freshly depolymerized para-formaldehyde.
2.
1 M Tris–HCl pH 7.
3.
1 M Na-ascorbate.
4.
100 mM CuSO4.
5.
Hydrochloric acid (HCl).
6.
Glycerol.
7.
Dextran sulfate.
8.
Tween 20.
9.
Triton X-100.
10.
Glycine.
11.
Bovine serum albumin (BSA).
12.
Formamide.
13.
Fish skin gelatine, 45% (FSG).
14.
Sodium azide. 15.200 mM ribonucleoside vanadyl complexes (RVC; Sigma).
2.2 Cells and Cell Labeling Reagents
1.
Cultured cells grown at ∼60% confluency on borosilicate coverslips of appropriate size (e.g., 18 × 18 mm) and thickness of 0.170 ± 0.005 mm (#1.5) in 6-well culture plates.
2.
Primary antibodies: anti-DIG (digoxigenin); anti-DNP (dinitrophenyl); anti-Digoxigenin-Alexa 488; for the detection of biotin (Strept)Avidin-Alexa 488.
3.
Secondary antibodies conjugated to fluorescent dyes. We recommend CF405M (Biotium) for excitation with 405 nm and Alexa 488, Alexa 568, and Alexa 594 (Life technologies) for excitation with 488, 561, and 592 nm laser lines, respectively.
4.
5-Ethenyl-2′-deoxyuridine (EdU, Life technologies) (optional).
5.
Azide dye, e.g., Alexa 488 azide, Alexa 594 azide (Life technologies) (optional).
6.
4′,6-Diamidino-2-phenylindole (DAPI).
7.
Non-hardening antifade mounting medium (e.g., Vectashield, Vector Laboratories).
2.3 Buffers and Solutions
Use preferably H2O from a distillation or deionization unit with an electric conductance value of <18 mS for all buffers (ddH2O). Additionally, filtration of solutions is recommended to remove precipitates (see Note 1). In case of RNA-FISH, add 2 mM RVC to the blocking and antibody solutions.
1.
20× phosphate-buffered saline (20× PBS): 2.74 M NaCl, 53.7 mM KCl, 130 mM Na2HPO4, 35 mM KH2PO4; for working dilutions into 1× PBS add 0.05% Na-azide.
2.
Fixation solution: 2 or 4% formaldehyde in 1× PBS prepared and used freshly. 3.Permeabilization buffer: 0.5% Triton X-100 in 1× PBS.
4.
PBST: 1× PBS, 0.02% Tween 20.
5.
PBST blocking solution: 2% BSA, 0.5% FSG, PBST, stored at 4°C for up to 1 week.
6.
20% glycerol solution in PBS.
7.
0.1 N HCl.
8.
20× saline-sodium citrate (20× SSC) pH 7: 3 M NaCl, 0.3 M sodium citrate, pH 7.
9.
4× SSCT: 20× SSC diluted 1:5 with ddH2O, and supplemented with 0.02% Tween 20 and 0.05% sodium azide.
10.
2× SSC: 20× SSC diluted 1:10 with ddH2O, and supplemented with 0.05% sodium azide.
11.
0.1× SSC: 2× SSC diluted 1:200 with ddH2O, and supplement with 0.05% sodium azide.
12.
Hybridization buffer: 20% dextran sulfate, 4× SSC.
13.
4× SSCT blocking solution: 2% bovine serum albumin (BSA), 0.5% FSG, 4× SSCT, stored at 4°C for up to 1 week.
14.
50% formamide in 2× SSC: 50 mL 20× SSC + 250 mL formamide + 200 mL ddH2O, adjust pH to 7, store at −20°C.
15.
EdU stock solution: 10 mM in DMSO (stored at −20°C).
16.
DAPI stock solution: 5 mg/mL in ddH2O (stored at −20°C).
17.
DAPI working solution: 2.5 μg/mL in PBST, freshly prepared (protect from light).
2.4 General Laboratory Equipment
1.
Clean glass microscope slides.
2.
Fine-tip forceps.
3.
Diamond cutter (optional).
4.
Dewar container for liquid N2 transport.
5.
Heating block flat surface for slides.
6.
Tube heating block or PCR machine.
7.
Water baths.
8.
Heated incubation chamber.
9.
Humidified chamber.
10.
Floating tin box.
11.
Shaking platform.
12.
Soft tissue paper (e.g., Kimwipes green).
13.
Rubber cement (e.g., Fixogum).
14.
Transparent nail polish (base coat).
2.5 D-SI Microscopy
DeltaVision OMX V3 imaging system (Applied Precision) equipped with 405, 488, and 592 nm lasers, a UPlan APO 100× 1.40 oil objective (Olympus), back-thinned EMCCD cameras (Photometrics Cascade II:512), and computer workstation for image processing. The system optionally comes with a second wide-field microscope (Personal DV) used for pre-screening the sample by eye and storing xy-sample positions to be relocated on the OMX stage (for a detailed technical description see refs. 31, 32).
3 Methods
3.1 Preparation of Coverslips
For fluorescence imaging with 3D-SIM of fixed cells, adherent tissue culture cells are typically grown on borosilicate coverslips (#1.5) suited for use with high NA oil objectives. Coverslips typically have a surface size of 18 × 18 mm, but can be cut to smaller sizes using a diamond cutter (see Note 2).
Coverslips should be thoroughly cleaned from dust by rinsing with deionized H2O and stored in pure ethanol. Do not flame or autoclave the coverslips for sterilization, as they tend to bend and deform. Preferably, take coverslips directly out of their storage container and place them into 6-well culture dishes under the laminar flow, initially vertically standing at the edge of the well until all the ethanol has evaporated. Then, coverslips can be flipped horizontally into the wells and cells seeded on top.
3.2 Seeding Cells
Cells should be preferably ∼60% confluent prior to fixation. Avoid working with dense cell layers. It is important to produce a single cell suspension and seed cells evenly onto coverslips, and not in patches. An evenly distributed, healthy cell population offers a great deal to the optimal visualization and minimizes nonspecific antibody binding problems caused by debris or other cellular impurities in the culture.
Non-adherent cells have also been successfully visualized when cross-linked, for instance, to poly-lysine coated cover glass ref. 2. However, cross-linkers tend to absorb antibodies or dyes nonspecifically, such as DAPI, and may therefore increase background fluorescence.
3.3 Cell Fixation and Sample Preparation for Hybridization
Depending on the desired cellular structures to be labeled for imaging, different labeling strategies are needed, such as, immunofluorescence labeling of proteins before or after FISH, or detection/imaging of replication labeled DNA before FISH. All possible combinations of the protocols described below are summarized in Table 1. At this point, if an EdU pulse is to be performed, incubate cells for the desired time period in 10 μM EdU containing growth medium (see Subheading 3.8).
Table 1
Possible combinations of protocols
Protocol ⇒ | |||||||||
|---|---|---|---|---|---|---|---|---|---|
3D-FISH | 3.3 | 3.4 | 3.5 | 3.6 | |||||
3D-FISH combined with EdU pulses | EdU pulse 10–30 min | 3.3 | 3.4 | 3.5 | 3.8 | 3.6 | |||
3D-FISH combined with IF | 3.3 | 3.4 | 3.5 | 3.7 | 3.6 | ||||
IF labeling before 3D-FISH treatment | 3.3.1–3.3.8 | 3.7 | 3.6.1–3.6.2 | 3.3.9–3.3.16 | 3.4 | 3.5 | 3.6 | ||
Relocating a cell before and after 3D-FISH | 3.3.1–3.3.8 | 3.6.3–3.6.8, or 3.7 and 3.6 | Image | Demount | 3.3.9–3.3.16 | 3.4 | 3.5 | 3.6 | |
Relocating an EdU-pulsed cell before and after 3D-FISH treatment | EdU pulse 10–30 min | 3.3.1–3.3.8 | 3.8 | Image | Demount | 3.3.9–3.3.16 | 3.4 | 3.5 | 3.6 |
1.
Wash cells twice with PBS (tissue culture grade, no sodium azide added before fixation). At this point move to a fresh culture dish where PBS has been added. This is done to avoid scraping off cells attached to the culture dish, which may stick to coverslips and interfere with the cleanliness of the preparation.
3.
Exchange the fixative stepwise with PBST. This prevents the sample from drying, thus avoiding unwanted shrinkage or deformed cellular morphology and other artifacts. The best way to achieve the fixative removal is by adding an equal amount of washing buffer (PBST) directly to the fixative and gradually exchanging the fixative with washing buffer. This is done by removing most of the solution from the well while leaving small amounts behind, enough to keep the coverslip covered with buffer, topping up with fresh buffer and repeating this step for 2–3 times, till the fixative has been completely exchanged with washing buffer.
5.
Quench with freshly prepared 20 mM glycine dissolved in PBS for 10 min to “block” free aldehydes.
6.
Wash with PBST.
7.
Permeabilize with 0.5% Triton X-100/PBS for 10 min. In case of RNA-FISH, add 2mM Ribonucleoside Vanadyl Complex (RVC) (Sigma) to the permeabilization buffer and perform this step on ice to inhibit RNases and avoid RNA digestion.
8.
Wash with PBST.
9.
Incubate in 20% glycerol/PBS for at least 1 h at room temperature.
10.
Dip the coverslip for approximately 6 s into a liquid N2-filled container using fine forceps, remove, place shortly on a Kimwipe tissue and wait a few seconds to defreeze. Then, return to the well containing 20% glycerol/PBS. Repeat this freezing/thawing step twice in order to offer a better penetration and accessibility to the probe at target DNA sequences. Take care not to leave coverslips drying out while thawing.
11.
Wash twice with PBS for 2 min.
12.
In case of DNA-FISH incubate samples in 0.1 N HCl for 5 min. This step is to remove cytoplasmic proteins, that would otherwise contribute to nonspecific background signals and improve probe penetration. Times can be shortened or increased, but 5 min is a good compromise to maintain nuclear integrity and achieve cytoplasmic deproteination.
13.
Wash twice with PBS for 2 min.
14.
At this point change to SSC buffer and wash twice with 2× SSC for 2 min.
15.
Incubate samples in 50% Formamide/2× SSC pH 7 at 4°C for at least 6 h, or overnight (see Note 5). Some cell types may require pepsinization before hybridization for better probe access. Pepsin mainly removes cytoplasmic proteins; however, it also promotes detachment of cells from the glass. Therefore, this process has to be monitored under the microscope and stopped before cells start to detach. A post-fixation step after pepsinization is recommended (for an exact protocol we refer to ref. 2).
3.4 Setup of Hybridization Solution, Denaturation of Probe and Target DNA and Hybridization
3.4.1 Setup of Hybridization Solution
We recommend using 1–5 ng DNA/μL hybridization solution for repetitive probes, such as major mouse satellite DNA delineating the pericentromeric regions of mouse chromosomes, and 20–40 ng DNA/μL for single or low copy probes, such as BAC DNA for the delineation of a specific gene locus (see Note 6). The latter probes require unlabeled competitor DNA (e.g., Cot-1 DNA) added to the probe for suppression of nonspecific hybridization. The amount of the competitor DNA should be around 10- up to 50-fold of the concentration of the probe DNA. As a rule of thumb, a hybridization area covered by 18 × 18 mm coverslip requires 5–8 μL of hybridization mixture. In case of smaller or larger hybridization areas the required amount is adjusted accordingly.
Related posts:
 Introduction: Nanoimaging Techniques in Biology
 Secondary Ion Mass Spectrometry Imaging of Biological Membranes at High Spatial Resolution
 Photoswitchable Fluorophores for Single-Molecule Localization Microscopy
 Functional AFM Imaging of Cellular Membranes Using Functionalized Tips
 Correlative Optical and Scanning Probe Microscopies for Mapping Interactions at Membranes
 Nanoimaging Cells Using Soft X-Ray Tomography
Stay updated, free articles. Join our Telegram channel

Full access? Get Clinical Tree


