Fig. 6.1
Sonographic appearances of pyogenic hepatic abscess. (a) Right intercostal sonogram shows a well-demarcated lobulated anechoic lesion with irregular internal septa and debris. Posterior acoustic enhancement beneath the pyogenic abscess is demonstrated indicating liquefaction. (b) A hypoechoic lesion with clustered appearance of smaller hypoechoic cystic lesions (arrows). (c) An indistinct slightly hyperechoic lesion is seen in the right hepatic lobe (arrows). (d) Brightly echogenic reflectors with posterior reverberation artifact inside an ill-defined lesion suggesting pyogenic abscess containing gas (arrows). (e) Contrast-enhanced sonogram on the left depicts a multilocular anechoic non-enhancing lesion with enhancing peripheral rim and internal septa (arrows). Complex internal septa are better demonstrated compared to the B-mode sonogram without contrast on the right (arrowheads)
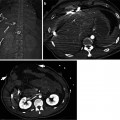
6.7.2 Pyogenic Hepatic Abscess with “Cluster” Sign
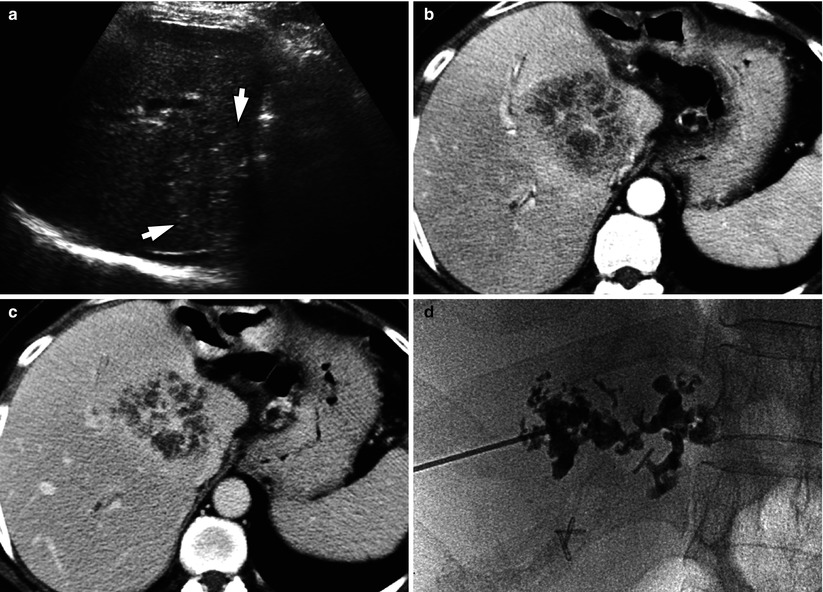
Fig. 6.2
Pyogenic hepatic abscess with “cluster” sign. (a) Right intercostal sonogram demonstrates a hyperechoic round lesion (arrows) in central liver. (b) Arterial phase contrast-enhanced CT shows a hypoattenuating lesion consisting of smaller aggregating cystic lesions, known as the “cluster” sign. (c) Portal venous phase CT depicts enhancement of the irregular septa within the abscess. (d) Cavitogram obtained during percutaneous drainage catheter placement procedure matches the CT appearance of clustered microabscess cavities
6.7.3 Pyogenic Hepatic Abscess with “Double Target” Sign
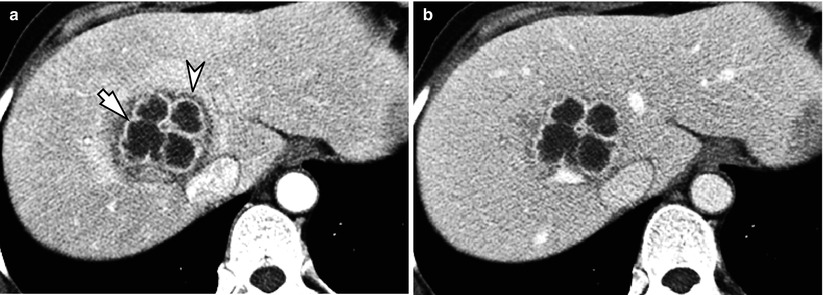
Fig. 6.3
Pyogenic hepatic abscess with “double target” sign. (a) Contrast-enhanced CT in arterial phase shows a multilocular low-attenuating round lesion in right anterior superior segment (S8) of the liver. The hypoattenuating central abscess cavity is surrounded by a high attenuating inner ring (arrow), corresponding to the capsule of the abscess. The outer low-attenuating zone (arrowhead) represents the localized edema in surrounding hepatic parenchyma. (b) On portal venous phase CT, the outer hypodense zone of edema is not as prominent as in arterial phase
6.7.4 Pyogenic Hepatic Abscess Associated with Acute Cholecystitis
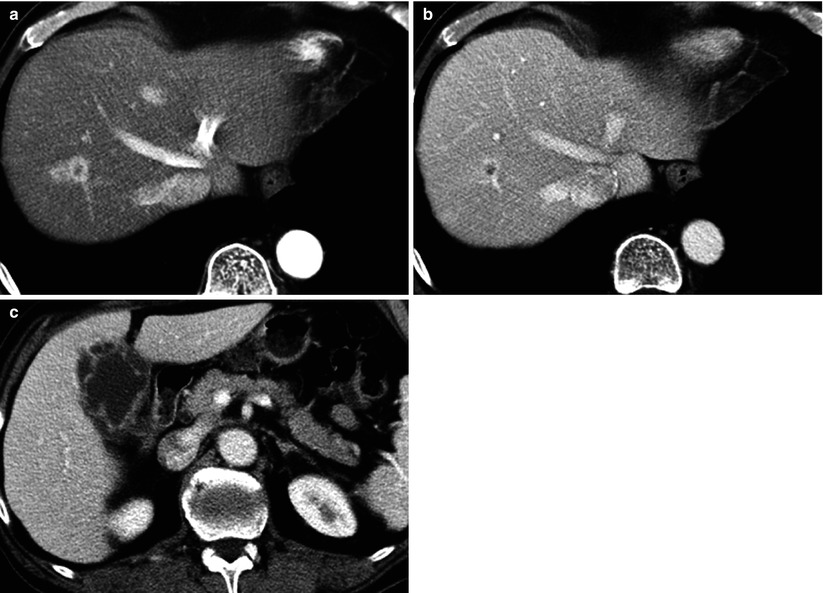
Fig. 6.4
Pyogenic hepatic abscess associated with acute cholecystitis. (a, b) Contrast-enhanced CT shows a small hypoattenuating lesion in S8 of the liver with rim enhancement, which is better seen in arterial phase (a) than portal venous phase (b). (c) The gallbladder of the same patient has a thickened wall with multifocal mucosal defects on portal venous phase CT image, consistent with gangrenous cholecystitis
6.7.5 Pyogenic Hepatic Abscess with Gas
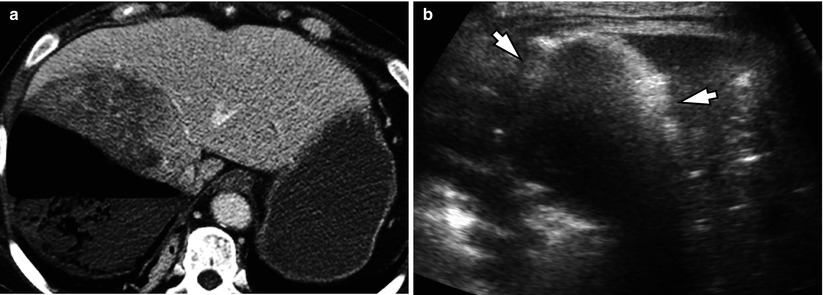
Fig. 6.5
Pyogenic hepatic abscess with gas. (a) Contrast-enhanced CT in portal venous phase demonstrates a large low-attenuating lesion in right hepatic lobe with mottled gas collections and air-fluid level. (b) Right intercostal sonogram shows brightly echogenic reflections (arrows) with posterior acoustic shadowing from the gas within the abscess
6.7.6 Pyogenic Hepatic Abscesses from Septicemia
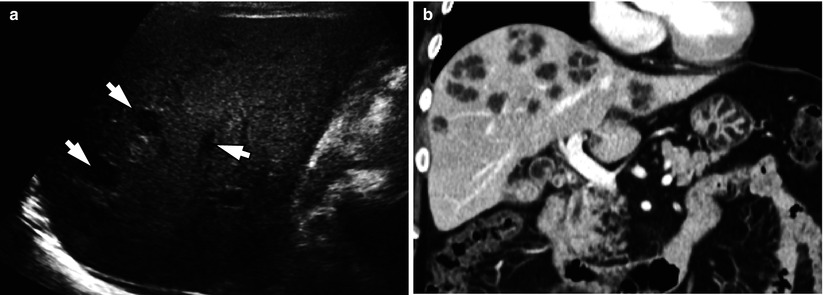
Fig. 6.6
Pyogenic hepatic abscesses from septicemia. (a) Multiple small hypoechoic round lesions (arrows) are seen in right intercostal sonogram of a patient with staphylococcal bacteremia. (b) Coronal CT image in portal venous phase depicts multiple round low-attenuating lesions in both hepatic lobes of the same patient. The cluster sign is also noted in some of the larger lesions
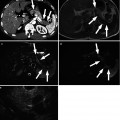
6.7.7 Pyogenic Hepatic Abscess Associated with Acute Appendicitis
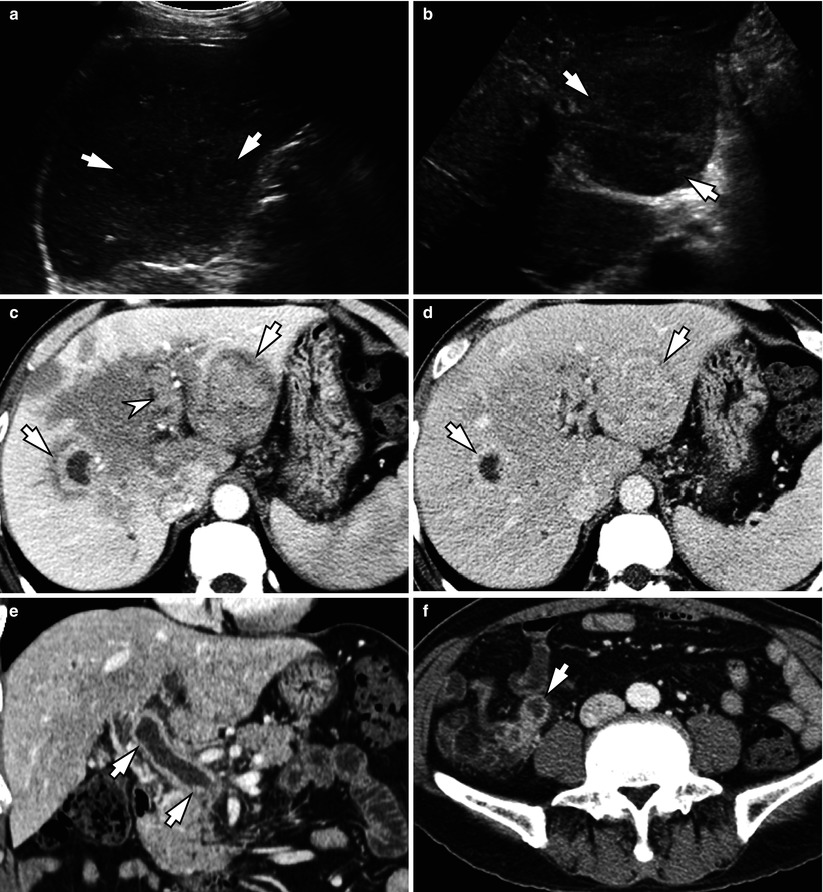
Fig. 6.7
Pyogenic hepatic abscess associated with acute appendicitis. (a) Right intercostal sonogram shows an ill-defined hypoechoic ovoid lesion in right hepatic lobe (arrows). (b) Transverse sonogram demonstrates a well-defined hypoechoic round lesion in left lateral segment of the liver (arrows). (c) Contrast-enhanced CT in arterial phase shows a hypodense lesion in right hepatic lobe with double target sign and another hypodense lesion in left lateral segment with an outer rim of lower attenuation (arrows). Note the thrombosis in left portal vein (arrowhead). (d) In portal venous phase, the low-attenuating zones surrounding the aforementioned abscesses (arrows) in both lobes are less evident. The irregular low-attenuating areas in the hepatic parenchyma between the abscesses are due to the hemodynamic changes from portal venous obstruction. (e) Coronal image of the CT in portal venous phase clearly depicts the thrombosis in main portal vein (arrows) indicating pylephlebitis. (f) Transverse CT image of the same patient demonstrates findings of acute appendicitis (arrow), including appendiceal dilatation with wall thickening and periappendiceal fat stranding
6.7.8 Pyogenic Hepatic Abscess with Venous Thrombosis
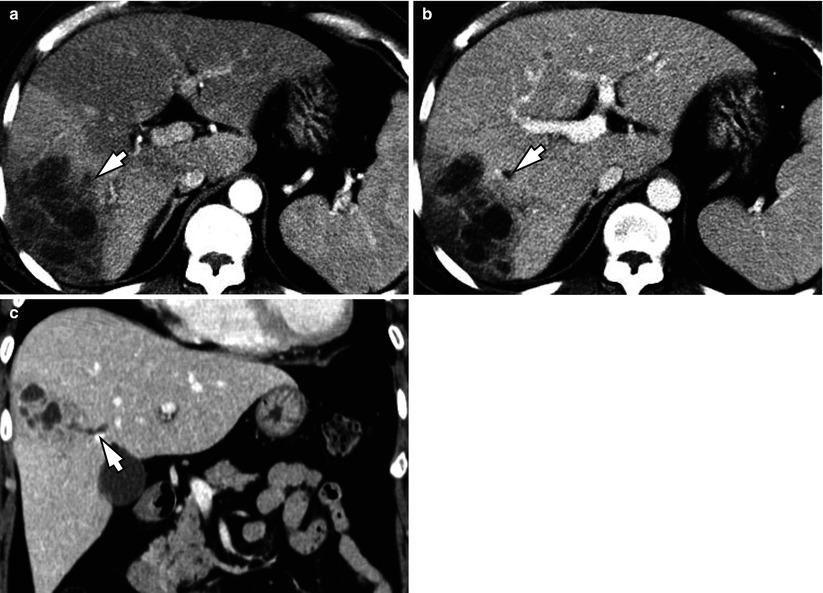
Fig. 6.8
Pyogenic hepatic abscess with venous thrombosis. (a, b) Contrast-enhanced CT obtained in arterial phase (a) shows a multilocular low-attenuating abscess in right posterior segment of the liver. There is thrombosis in the segmental portal vein nearby (arrow). Secondary transient hepatic attenuation difference can be observed as a wedge-shaped perilesional parenchymal enhancement in arterial phase, which becomes isodense in portal venous phase (b). (c) Coronal reformatted portal venous phase CT image obtained in a different patient demonstrates a clustered low-attenuating abscess with a contiguous tubular low attenuation lesion (arrow), representing thrombophlebitis in an adjacent hepatic vein tributary
6.7.9 Pyogenic Hepatic Abscess Associated with Biliary Obstruction
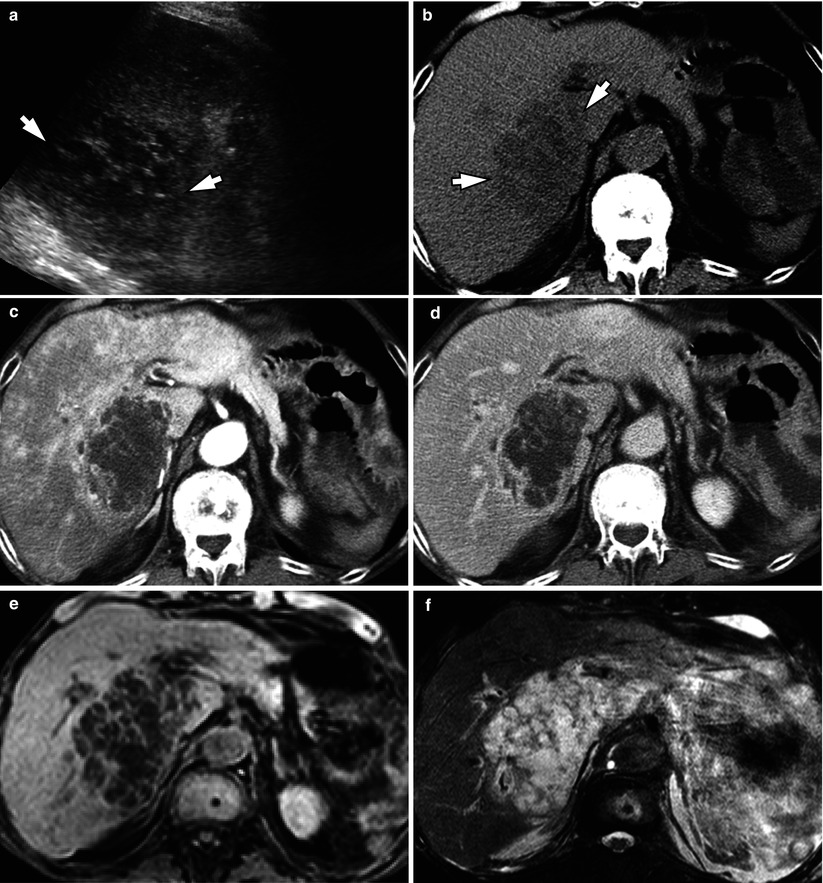
Fig. 6.9
Pyogenic hepatic abscess associated with biliary obstruction. (a) Right intercostal sonogram shows a hypoechoic lesion with cluster sign (arrows). (b, c, d) Axial CT images in precontrast (b), arterial phase (c), and portal venous phase (d) demonstrates a low-attenuating lesion with lobulating contour and irregular septations in caudate lobe and right posterior superior segment (S7) of the liver. There is heterogeneous parenchymal enhancement in the background liver in arterial phase due to obstructive cholangitis secondary to pancreatic head cancer (not shown). (e, f) On MR imaging, the hepatic abscess is hypointense on T1-weighted fat-suppressed image (e) and hyperintense on T2-weighted fat-suppressed image (f). The irregular internal septa are better recognized owing to superior tissue contrast of MR imaging compared to CT
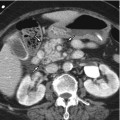
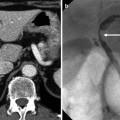
6.7.10 Pyogenic Hepatic Abscess of Small Size
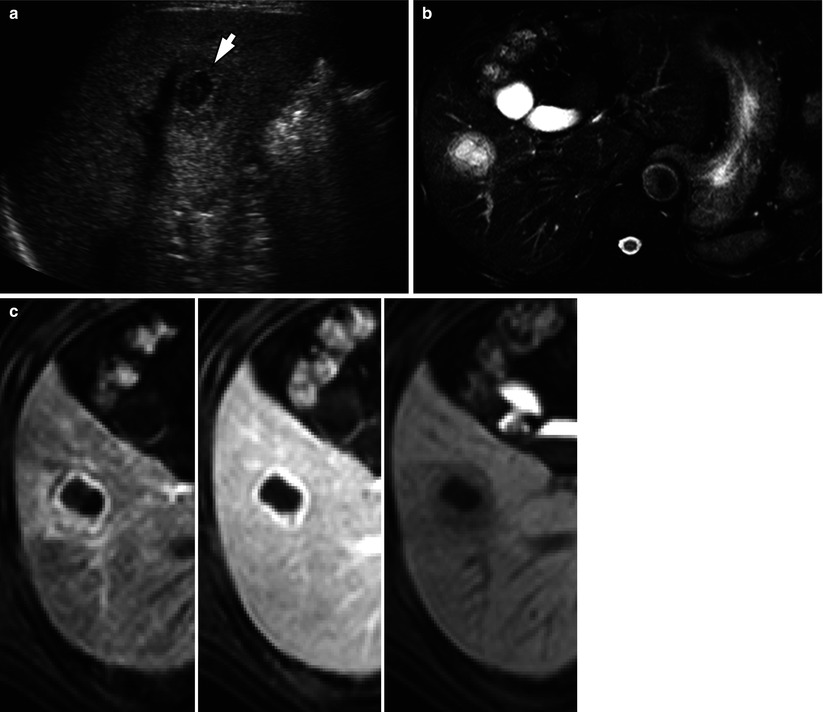
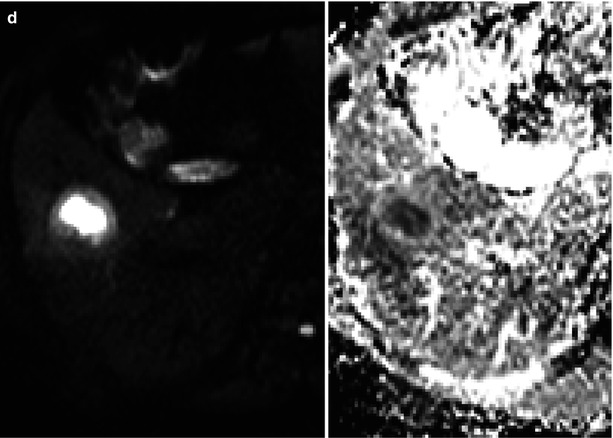
Fig. 6.10
Pyogenic hepatic abscess of small size. (a


Related posts:


Stay updated, free articles. Join our Telegram channel
Full access? Get Clinical Tree
