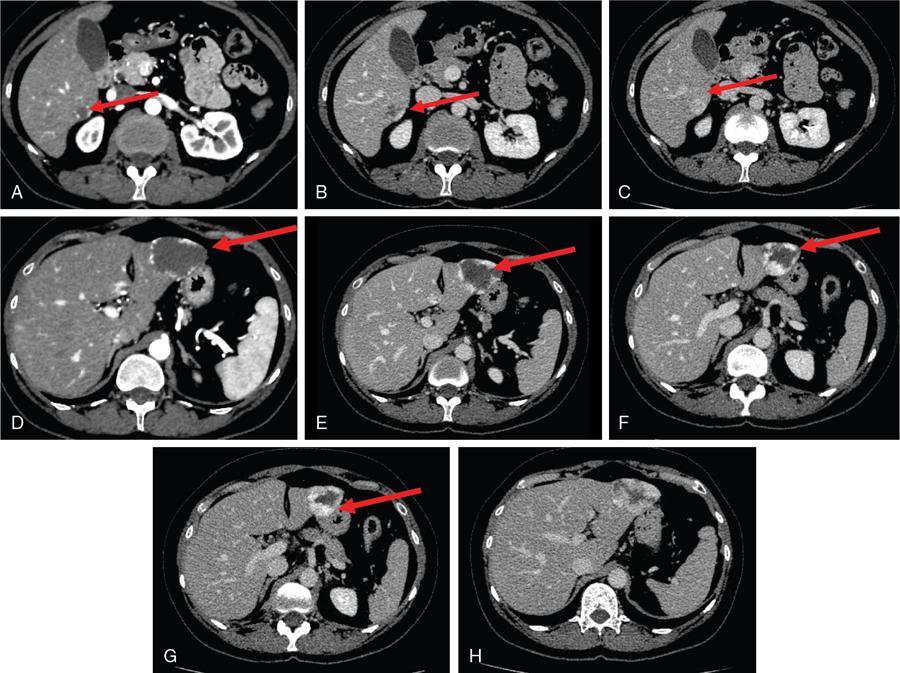
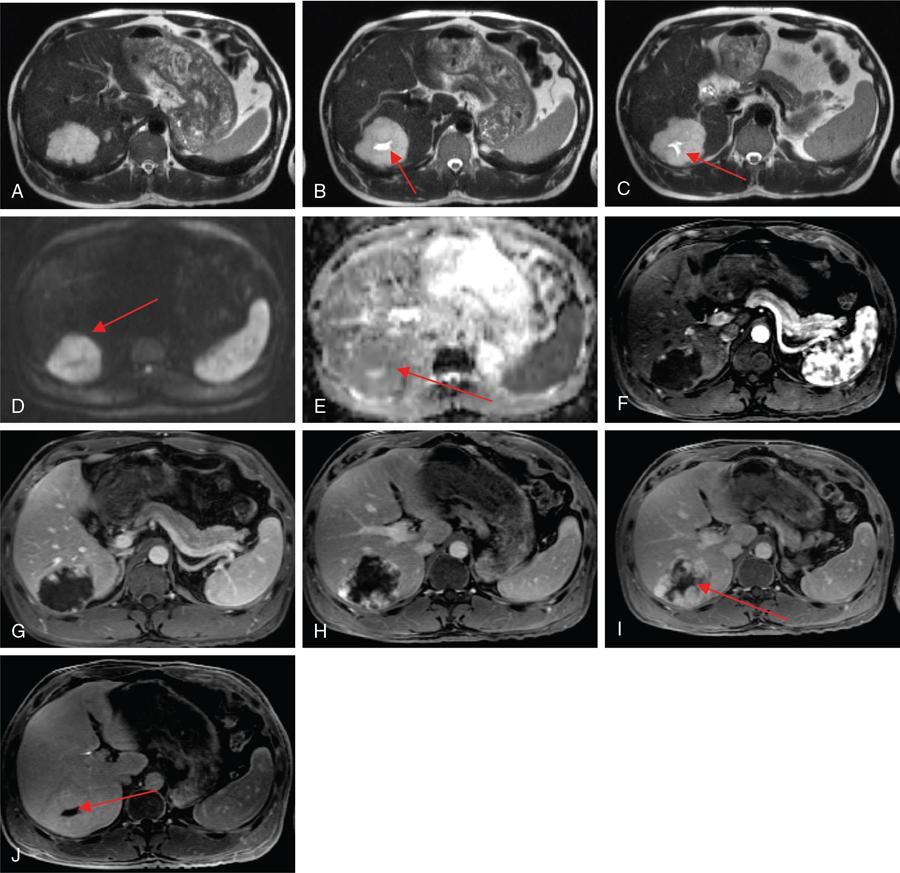
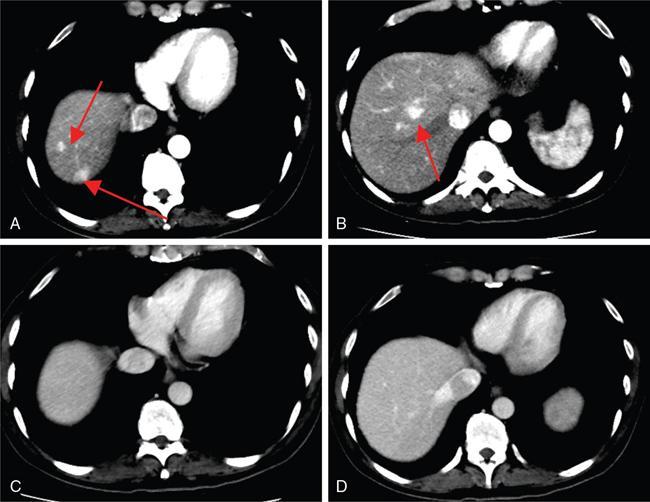
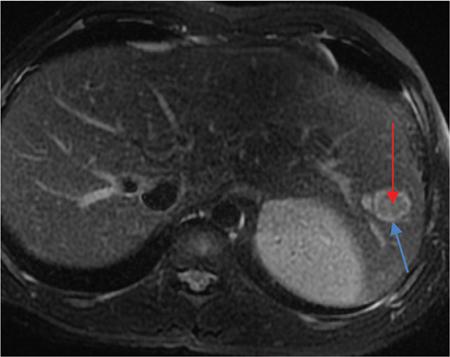
Ritu K. Kashikar, Shrinivas B. Desai, Pooja Punjani Vyas, Nilesh Doctor, Vivek Shetty Owing to advances in technology, focal liver lesions (FLLs) are increasingly encountered. Imaging particularly computed tomography (CT) and magnetic resonance imaging (MRI) play a vital role in diagnosis and characterization of FLL, thus avoiding unnecessary biopsies and interventions. Multiphase CT accurately diagnosis most liver lesions. Better soft tissue contrast and lack of ionizing radiation makes MRI a preferred modality in diagnosing FLLs. MRI with or without contrast for characterization of liver lesions regardless of preexisting liver disease has been assigned the highest rating as per American College of Radiology Appropriateness Criteria (Table 9.11.1). Solid lesions of epithelial origin Solid lesions of nonepithelial origin Pitfalls Cystic liver lesion Developmental cyst Infective cyst Miscellaneous Tmours of hepatocellular origin Tumours of nonepithelial origin Malignant cystic lesion Hepatic metastasis Ultrasound is often the initial modality for diagnosis and also the incidental detection of FLLs. Limitations to USG include the detection of small lesions less than 2 cm in size, particularly in patients who are cirrhotic or undergoing chemotherapy. Characterization of FLLs, involvement of crucial structures such as blood vessels, local staging and decisions such as operability are also not accurate with ultrasound alone and require confirmation with CT/MRI. The liver typically images in supine and left lateral positions. A curvilinear transducer with a frequency of 1.5 Hz is used. The subcostal diagonal, subcostal longitudinal or sagittal and transverse right intercostal lateral views are used. Right lobe of liver is imaged through an intercostal approach when the patient is taking deep inspiration. Subcostal view is used to image the three hepatic veins in one view. Transverse, longitudinal and oblique views of the liver are taken to image all the segments of liver. Colour and power Doppler have increased sensitivity for FLL detection, but sensitivity is still inferior to contrast-enhanced CT and MRI. The introduction of microbubble contrast agents (CAs) and the development of contrast-specific techniques have opened new perspectives in ultrasound of the liver. The technique is based on a new class of intravascular microbubble agents which contain perfluoro gases instead of air. This when combined with scanning modes sensitive to harmonic responses of microbubbles enable tissue signal suppression. The advent of the multislice technique and isotropic voxel have improved the spatial resolution of CT, allowing the recognition of small FLLs in difficult areas. Multislice CT has a sensitivity and specificity in the diagnosis of malignant FLLs of 63% and 64%, and 92 and 97%, respectively. Contrast media administration with dose based on the patient’s weight (approximately 600 mg iodine/kg of bodyweight), an iodine content of 350–400 mg/mL and a high injection rate of 4–5 mL/s are imperative to attain good contrast enhancement. Region of interest in the abdominal aorta and a threshold of 100 HU allows correct timing for threshold. A delay of approximately 18 s after the threshold provides the first arterial phase, allowing detection of hypervascular FLLs such as hepatocellular carcinoma (HCC). The late arterial phase is obtained approximately 10 s after the early arterial phase and shows progressive enhancement of hypervascular lesions, improving detection rate, while the optimal hepatic enhancement in the portal phase is reached approximately 50–60 s after the threshold. Portal venous thrombi are also best detected in this phase. The venous phase aids in the detection of washout, hepatic venous thrombosis. Delayed phase is often required in lesions such as cholangiocarcinoma and haemangioma, which show progressive enhancement (Table 9.11.2, Fig. 9.11.1). Delayed phase images are required for tumours such as cholangiocarcinoma and large haemangiomas, which reveal delayed enhancement. As mentioned previously, MRI is the modality of choice in diagnosis of FLLs. Most FLLs appear hyperintense on T2W1 images with varying intensity depending upon the water content and flow dynamics. FLLs are typically hypointense on T1W1 images with the exception of fat containing, haemorrhagic lesions and those containing chelates of metals like regenerating/dysplastic nodules. In- and opposed-phase images help in detection of intralesional fat. Diffusion-weighted images are beneficial particularly in noncirrhotic population and best suited in detection of metastasis. Postcontrast images obtained with extracellular agents are parallel to those obtained with CT (Fig. 9.11.2). The pre- and postcontrast MRI protocol is mentioned in Table 9.11.3. T2-weighted single-shot fast spin-echo (SE) T1-weighted in- and opposed-phase GRE Dynamic 3D T1-weighted FS spoiled GRE (in hepatic arterial, portal venous and equilibrium phases) There are two main categories of CAs used in liver imaging – the extracellular and the hepatocyte-specific (Fig. 9.11.3). Extracellular agents are more widely used and provide information similar to contrast-enhanced CT study. The advantage of the other category of CAs, that is, hepatocyte-specific agents, is the ability to provide this extracellular information with added benefit of delayed phase information. Tumours of hepatocellular origin with functioning hepatocytes take up and biliary excretion with take up and retain these agents appearing isointense to background liver. Lesions without functioning hepatocytes fail to retain contrast and hence appear hypointense to background liver on delayed phase. This allows better detection and characterization of focal liver lesion particularly those lesser than 2 cm (Table 9.11.4). Haemangioma is the most common benign hepatic tumour. The incidence in general population varies from 1% to 20%. Females have a higher preponderance with variable female to male ratios of 2:1 to 5:1. Imaging in particular MRI has high reliability in diagnosing classic haemangioma. The sensitivity and specificity of MRI is greater than 90% in diagnosis. The aetiology of haemangioma is unknown. Since haemangiomas are known to run in families, a genetic origin has been implicated, while other mesenchymal tumours are thought to be congenital. Most patients are asymptomatic and often the lesion is discovered as an incidental finding. Pain in the right upper abdomen is the most common complaint; others include loss of appetite, nausea, vomiting and abdominal discomfort. Symptoms are usually seen in large haemangiomas or those with complications. Liver function tests and tumour markers like AFP and CA19.9 are within normal limits. Blood-filled cavities of varying sizes lined by flat endothelial cells and supported by fibrous connective tissue are seen on histology. Three histological subtypes have been described: the capillary haemangioma, the cavernous haemangioma and the sclerosing haemangioma. The imaging features of a haemangioma depend on its size; typical haemangiomas are mostly less than 3 cm in diameter. Haemangiomas are hyperechogenic, homogeneous lesion presenting a posterior acoustic enhancement (Fig. 9.11.3). The hyperechogenicity of haemangiomas is related to the interfaces between vascular spaces, fibrous stroma and the slow blood flow. Typically, haemangiomas have slow flow and hence do not show vascularity on colour or power Doppler. The sensitivity and specificity of ultrasound in differentiating haemangioma from other malignant lesions are high, with values of approximately 94.1% and 80%, respectively, for lesions less than 3 cm in diameter. Unlike HCC, no flow is seen on colour Doppler. A peripheral echogenic rim around hypoechoic lesions can suggest haemangioma. On the contrary, perilesional hypoechoic rim called the target sign is seen in lesions such as metastasis (Table 9.11.5). Adenomas can be distinguished on the basis of the absence of posterior acoustic enhancement and characteristic pattern of peripheral vascularity seen in adenoma. Another differential diagnosis to be considered is focal nodular hyperplasia (FNH), which has the characteristic ‘spoke-wheel sign’. Contrast-enhanced ultrasound (CEUS) improves specificity for the diagnosis of haemangioma. The vascularity pattern with contrast-enhanced USG is similar to that seen with CT. The typical hemangioma (HH) shows peripheral nodular enhancement in the arterial phase with complete (but sometimes incomplete) centripetal filling in the portal venous and late phases. This particular pattern of enhancement helps in differentiating haemangiomas from other lesions like adenomas, FNH, HCC or metastasis. This characteristic enhancement pattern has a sensitivity of 98% for histologically proven HH. One should be aware that an HH can rarely have a centrifugal enhancement. Computed tomographic (CT) findings consist of a hypoattenuating lesion on nonenhanced images. Haemangiomas show peripheral discontinuous nodular enhancement on arterial phase of dynamic contrast-enhanced CT. The density of the nodules is equivalent to that of the aorta. Centripetal filling with is seen on venous phase, which progresses to uniform enhancement. The enhancement persists on delayed phase (Fig. 9.11.4). Washout of contrast on delayed phase is not seen in haemangioma and if seen, alternate diagnosis must be considered. This classical pattern of enhancement cannot be highlighted in very small lesions of less than 5 mm, which can be difficult to characterize. In patients with severe fatty infiltration of the liver, HH can appear hyperdense relative to the adjacent liver parenchyma on nonenhanced scan. Haemangiomas are hyperintense on T2-weighted images, which is identical to that of cerebrospinal fluid. T2 hyperintense signal is classically described as ‘light bulb bright’. Malignant lesions of the liver do not appear as bright on T2W1 images. They appear hypointense to adjacent liver on T1-weighted images. Long relaxation T2W1 images further improve accuracy in diagnosis of haemangiomas and help in differentiation from metastasis. Haemangiomas, unlike other liver lesions retain hyperintense signal on long relaxation T2W1 images. A threshold of 112 ms has 92% accuracy, 96% sensitivity and 87% specificity for differentiating haemangiomas from metastasis. On gadolinium administration, the enhancement pattern is similar to that seen with iodinated contrast on CT. Classic enhancement pattern in combination with characteristic T2 appearance are diagnostic for haemangioma (Fig. 9.11.5). Certain pitfalls exist in diagnosing haemangiomas using gadoxetate disodium. Due to the lack of hepatocytes, haemangiomas appear hypointense to the background liver on delayed hepatocyte phase and mimicking malignant process (Table 9.11.6). Lesions shown peripheral nodular arterial enhancement (Table 9.11.7): On fluorodeoxyglucose-positron emission tomography (FDG-PET)/CT, most hepatic haemangiomas appear low-attenuation lesions with FDG avidity equal to background liver parenchyma and are easily determined to be benign. However, a small percentage of haemangiomas may be FDG-avid. If an FDG-avid hepatic lesion demonstrates the characteristic enhancement pattern, this is consistent with an FDG-avid haemangioma. Technetium-99m pertechnetate-labelled red blood cell scintigraphy has high specificity in the diagnosis of haemangiomas. In this technique, there is decreased activity in haemangiomas on early images and increased activity on delayed blood pool images. Therefore, radionuclide scintigraphy has a sensitivity of 78% and an accuracy of 80% and may be a valuable tool when the diagnosis cannot be achieved with other imaging modalities. Large haemangiomas are often heterogeneous with internal clefts and septae. They are termed as giant haemangiomas when they exceed 4 cm in diameter. Discrepancies are there in definition with some authors defining giant haemangiomas as lesions greater than 6 cm or 12 cm in diameter. These may cause symptoms of abdominal pain and distension. These haemangiomas demonstrate changes such as haemorrhage, thrombosis, extensive hyalinization, liquefaction and fibrosis. The central cleft-like area may be due to cystic degeneration or liquefaction. On USG, they reveal heterogeneous echotexture. They are hypoattenuating and heterogeneous on nonenhanced CT with central areas of low attenuation. After intravenous administration of contrast material, the typical early, peripheral and globular enhancement is observed. These may show irregular or ‘flame-shaped’ discontinuous peripheral enhancement as opposed to typical nodular enhancement pattern seen in smaller haemangiomas. Although centripetal pattern of enhancement is seen during the venous and delayed phases, the filling-in incomplete. Central scars are defined in this subset of haemangiomas (Fig. 9.11.6). At MRI, T2-weighted images show a markedly hyperintense cleft-like area and some hypointense internal septa within a hyperintense mass. On delayed phase, incomplete filling and central scar are seen similar to CT (Fig. 9.11.7). Complications include intratumoural haemorrhage, inflammatory changes or consumptive coagulopathy (Kasabach–Merritt syndrome). These may warrant management such as arterial embolization or resection. This pattern is seen 16% of all haemangiomas, and is seen more often in small haemangiomas (42% of haemangiomas) <1 cm in diameter. CT and MRI show immediate homogeneous enhancement at arterial phase CT or contrast-enhanced MRI. The size of the blood spaces is the reason for difference in enhancement pattern. Smaller the lesion, smaller the size of blood spaces and faster the rate of spread of contrast material. These lesions usually show perilesional halo of hyperenhancement on the late arterial phase, which is believed to be due to arteriovenous shunting. Rapid arterial enhancement makes these haemangiomas difficult to distinguish from hypervascular metastasis (Table 9.11.8). However, washout of contrast is seen from haemangiomas on delayed phase (Fig. 9.11.8). Hepatic haemangiomas rarely demonstrate calcifications, while haemangiomas in other locations frequently demonstrate phleboliths. Calcified haemangiomas are mostly found incidentally. Calcifications may occur in the marginal or central portion of the lesion and consists of multiple spotty calcifications, which correspond to phleboliths. However, large, organized calcifications are also possible. Some calcified haemangiomas may demonstrate poor enhancement. Hyalinized hepatic haemangiomas are rare. It has been suggested that hyalinization represents an end stage of haemangioma evolution. These haemangiomas are usually asymptomatic. The radiological features of a haemangioma are completely altered ones hyalinization occurs; hence biopsy is often mandatory for diagnosis. Hyalinized haemangiomas show only slight high signal intensity on T2W1 images. There is lack of early enhancement on dynamic contrast-enhanced images (Fig. 9.11.9). Fluid–fluid levels within haemangiomas are very rare. Fluid–fluid levels are seen both with CT and MRI with inferior layer representing the red blood cells and superior layer unclotted serous blood. Dependent hyperdensity/T1 hyperintensities can be seen corresponding with dependent haemorrhage. Pedunculated haemangiomas are very rare. They can be asymptomatic or complicated by subacute torsion and infarction. Typical enhancement pattern and signal on T1 and T2W1 images are clues to the diagnosis. Capsular retraction is usually associated with malignant tumours such as cholangiocarcinoma, epithelioid haemangioendothelioma or metastases. Rarely, it has been seen in haemangiomas. A possible mechanism could be fibrous degeneration. Multiple haemangiomas are seen in 10% of cases and usually show classical imaging features. Fatty infiltration of liver may alter the imaging appearances of lesions. Haemangiomas appear slightly hyperechoic, isoechoic or hypoechoic relative to the fatty liver. At nonenhanced CT, the lesion may be hyperattenuating relative to the liver. Contrast-enhanced CT shows peripheral enhancement and delayed filling, an appearance similar to that of a haemangioma in a normal liver. Haemangiomas are less common in setting of cirrhosis and may be difficult to diagnose due to sclerosis. Complications are seen in 4.5%–19.7% and often seen in large lesions such as inflammation, coagulation within can lead to systemic disorders, haemorrhage would lead to haemoperitoneum, volvulus and adjacent organ compression. Irrespective of the size, treatment is indicated only for haemangiomas with significant symptoms, those developing complications, or when there is an inability to exclude malignancy. Attempt should be made to exclude other causes of the patient’s symptoms. The term focal nodular hyperplasia (FNH) was introduced in 1958 by Edmondson. In 1995, the International Working Party classified FNH with other regenerative lesions, and not a neoplastic lesion. It is defined as a nodule consisting of normal appearing hepatocytes occurring in a histologically normal liver. It is the second most common tumour of the liver after haemangioma with a reported prevalence of 0.9%. The lesion is more commonly seen in females with female to male ratio of 8:1. Multiplicity is seen in 20% of patients. The combination of multiple FNH lesions and haemangiomas is considered to be multiple FNH syndrome. Vascular malformation and vascular injury have been suggested as the underlying mechanism. An association with steroids has been denied more recently. FNH has been classified as classic and nonclassic varieties. These have been discussed in Table 9.11.9. Classic FNH is characterized by abnormal nodular architecture, malformed vessels and cholangiolar proliferation. Nonclassic FNH lesions lack one of the following classic features – nodular abnormal architecture or malformed vessels – but always show bile ductular proliferation. Classic FNH on gross appearance shows lobulated contours with multiple nodules surrounded by fibrous septae originating from a central scar, which contains a vascular malformation. On histopathology, nodular hyperplastic parenchyma is seen in classic FNH. Circular or short fibrous septae surround these nodules completely or incompletely. Thickening of the hepatic plates is seen. Fibrous connective tissue, cholangiolar proliferation with surrounding inflammatory infiltrates and malformed arteries, capillaries, vascular channels of undetermined type and veins are seen in the central scar. The arterial blood in FNH shows centrifugal distribution from anomalous central arteries. Fatty infiltration is seen in approximately 50% of lesions, while signs of hepatic steatosis are seen in approximately 20% of cases with classic FNH. Variable amounts of Kupffer cells are seen in both classic and nonclassic variants. Nonclassic FNH is heterogeneous and on gross appearance resembles adenomas in most cases, with vaguely lobulated contours and lack of a macroscopic central scar. The histology varies with subtypes. Subtypes of nonclassic FNH include telangiectatic type, mixed hyperplastic and adenomatous forms and FNH with cytologic atypia. The histological features of these are described in Table 9.11.10. At US, typical FNH is often not well visualized. The lesions may be slightly hypoechoic, isoechoic or slightly hyperechoic. The compressed liver tissue form a hypoechoic halo around the lesion, which appears more prominent in patients with fatty infiltration. A prominent central scar may improve the conspicuity of the lesions. Use of colour and power Doppler US shows vascularity in suspected FNH. On contrast-enhanced USG, FNH is hyperenhancing in the arterial and portal venous phases in more than 90% of cases. The arterial enhancement patterns include central (60%–70% of cases) or eccentric (<20% of cases) with centrifugal filling, but sometimes are homogeneous. Multiphase CT is an excellent modality for detection and characterization of FNH. These lesions classically show a lobulated contour. At unenhanced CT, the lesions are either hypoattenuating or isoattenuating to the surrounding liver. In the arterial phase, the lesions show homogeneous intense enhancement except the central scar and fibrous septa. In the portal and later phases, the lesions become more isoattenuating with the surrounding liver. The central scar reveals enhancement on delayed phase (Fig. 9.11.10). This feature helps distinguish from other lesions with central scar-like fibrolamellar carcinoma. A vascular malformation can be seen in the central scar in some cases (Fig. 9.11.11). There may be enlarged hepatic veins in the vicinity of the mass. FNH do not have portal venous drainage. The drainage is essentially into hepatic venules, hence the enlarged adjacent veins. The central scar is often not identified in small FNH lesions. In a study, 80% of FNH lesions less than 3 cm lacked visible central scar. The sensitivity and specificity of MRI in diagnosis of FNH are 70% and 98%, respectively. The central scar is more often detected with MRI than with CT (78% and 60%, respectively). FNH is typically iso- or hypointense on T1-weighted images (94%–100%) and is slightly hyperintense or isointense on T2-weighted images (94%–100%). The lesions may not be very conspicuous on T2W1 images. The central scar is hyperintense on T2-weighted images in 84% of cases. FNH shows intense homogeneous enhancement in the arterial phase. The enhancement pattern in arterial phase may be nodular, resembling a popcorn, the result of intralesional fibrous septae. Mosaic pattern of heterogeneous enhancement seen in malignant lesions is not seen in FNH. Central vascular malformation may be seen in early phases. These lesions classically fade to isointensity on delayed phase with the exception of the central scar (Fig. 9.11.12). FNH may show a pseudocapsule, which results from compression of the surrounding liver parenchyma by the FNH, perilesional vessels and inflammatory reaction. The pseudocapsule may show enhancement on delayed contrast-enhanced images. A central scar is present at imaging in most patients with FNH. The central scar is hyperintense on T2W1 and hypointense on T1W1 images. The presence of inflammation and vessels within the scar are responsible for the hyperintense signal (Fig. 9.11.13). The scar does not enhance on early phases of contrast study and shows enhancement on delayed phases of dynamic study. The scar is absent in 30% of cases. The hepatocyte-specific CA gadoxetate disodium can be useful in distinguishing FNH from other lesions like adenomas. Densely packed functioning hepatocytes and abnormal blind-ending bile ductules in FNH result in contrast retention and delayed biliary excretion. FNH often shows enhancement on delayed images using gadoxetate disodium, and along with radiating fibrous septae, it may result in a characteristic spoke-wheel appearance. On the contrary, hepatocellular adenomas (HCAs) are usually hypointense to liver on hepatocyte phase images because they lack bile ductules. Superparamagnetic iron oxide (SPIO) is a negative reticuloendothelial-specific CA taken up primarily by the hepatosplenic Kupffer cells. This agent shortens T2 relaxation time predominantly, leading to a significant decrease of SI of normal hepatic. FNH contains Kupffer cells and hence shows significant signal drop after administering SPIO. This CA is, however, not commonly used particularly with advent and increased usage of hepatocyte-specific agents (Table 9.11.11). These lesions have high signal intensity on T2-weighted images, a central scar with low signal intensity on T2-weighted images, a prominent pseudocapsule and incomplete intense enhancement of the lesion. Extreme heterogeneity can be seen in these lesions leading to difficulty in distinguishing from malignant lesions such as HCC and cholangiocarcinoma. Biopsy and histopathology diagnosis are often needed in this subset. Telangiectatic FNH may show areas of haemorrhage. A French study has reported an association of 23% between FNH and haemangiomas. The incidence of coexistence of FNH and adenoma is lower (3.6%). There have also been reports of rare associations of FNH with other types of vascular anomalies like congenital absence of the portal vein, inflammatory pseudotumours of the liver, hepatic vein thrombosis and intrahepatic arteriovenous shunting. Imaging differentials include HCA and other lesions with central scar like fibrolamellar carcinoma, HCC and giant haemangiomas (Table 9.11.12). FNH shows intense arterial phase enhancement and isodensity/isointensity on delayed phase, this feature helps in distinguishing from adenoma, which usually are hypoattenuating on the delayed phase. T1 hyperintensity seen in adenomas is not seen on FNH. Biopsy is recommended in cases where radiological features are atypical and distinguishing from malignant lesions like HCC cannot be made on the basis of imaging findings alone. As there is no risk of malignant transformation and complications are rare, FNH does not need treatment. Patients with large FNH causing compression of adjacent organs or occurrence of torsion in a pedunculated FNH may need surgical resection. Also, patients with diagnostic dilemma may be considered as surgical candidates. Adenoma is a less common benign primary neoplasm of the liver. Women of childbearing age taking oral contraceptives are considered at highest risk; however, it can occur in other women as well as men. Hepatic adenomas (HAs) were particularly associated with the use of older generation of OC pills with high-oestrogen content. Adenomas have also been reported to occur in men secondary to anabolic steroid/androgen use. Clomiphene, danazol and testosterone in patients with Fanconi anaemia (FA) and without FA, Klinefelter’s syndrome, glycogen storage disorders (GSDs) I, III and IV, alcohol and metabolic syndrome are other hormonal therapies and conditions associated with adenoma. Development of >10 adenomas in a patient is defined as hepatocellular adenomatosis (Fig. 9.11.14). Germline mutations of hepatocyte nuclear factor (HNF)-1 alpha and patients with type 3 maturity onset diabetes of young (MODY-3) may predispose. HCA has been categorized into three distinct subtypes based on genetic and pathologic features. These have been discussed in Table 9.11.13. Some exhibit both β-catenin activation and inflammatory features. Patients are usually asymptomatic at the time of diagnosis but some present with abdominal pain, haemorrhage, abnormal liver function tests or seldom with a palpable mass. HCA associated with haemorrhage may present with acute abdominal pain, elevated liver enzymes and hypovolemic shock. Signs of chronic anaemia and/or ‘systemic inflammatory syndrome’, characterized by fever, leukocytosis and elevated serum levels of C-reactive protein can be seen in patients with inflammatory HCA. Inflammatory HCAs are associated with a definitive increased risk of bleeding (>30%) and a risk of malignant transformation (5%–10%). The highest predilection for malignant transformation of all HCAs is seen in β-catenin activated subtype. On gross appearance, adenomas are well-circumscribed often encapsulated lesions with size varying between 1 and 30 cm. Lesions may be solitary or multifocal. They typically arise in nonfibrotic liver, however, the inflammatory subtype has been reported in the background of cirrhosis The cut surface of HA may be tan-yellow or red-brown depending upon the presence of steatosis or peliosis/haemorrhage/old haemorrhage, respectively. Sheets of benign-appearing hepatocytes with interspersed thin-walled, unpaired arteries are classically seen in HCA. Other variable features are steatosis, inflammatory cell infiltrate, sinusoidal dilatation, myxoid changes and presence of pigments such as bile pigment, lipofuscin or Dubin–Johnson-like pigment (Table 9.11.14). The typical small HCA is isoechoic in comparison to the surrounding liver parenchyma. Adenomas with high lipid content are hyperechoic on ultrasound. Intratumoural haemorrhage can also result in increased echogenicity and heterogeneity, or cystic areas. Calcifications are seen as hyperechoic foci with acoustic shadowing. Peripheral peritumoural vessels and intratumoural vessels with a flat continuous or triphasic form are seen on colour Doppler. FNH does not show this pattern of vascularity and hence this finding may be useful in distinguishing the two disease entities. On contrast-enhanced USG, arterial phase reveals centripetal or diffuse enhancement. Telangiectatic HCA with or without inflammation typically exhibit iso- or hyperenhancement in comparison to the surrounding liver parenchyma. Hypoenhancement is seen in portal venous phase with delayed washout in all subtypes. USG and contrast-enhanced USG features of histologic subtypes have been described. HNF-1α-inactivated HCAs are hyperechoic due to fat content and may be misdiagnosed as haemangiomas. The enhancement pattern is however that of arterial enhancement. With venous washout in contrast to haemangiomas which show portal venous hyperenhancement. On CEUS, telangiectatic HCA with or without inflammatory changes shows central multilocular vessel supply similar to FNH. These lesions might show centrifugal hyperenhancement during the early arterial phase which may persist on portal venous phase. Nevertheless, most adenomas are not specifically diagnosed at US and are usually further evaluated with CT or MRI. Multiphase CT is a good diagnostic modality in diagnosis of HCA. Fat or haemorrhage can easily be identified on unenhanced images. CT evidence of fat within the adenoma is seen in only about 10% of cases. Lesions show strong arterial enhancement and subcapsular feeding vessels. Enhancement is more heterogeneous in larger tumours and those with internal haemorrhage. The enhancement usually does not persist in adenomas because of arteriovenous shunting (Fig. 9.11.15). MRI is the modality of choice in diagnosis of adenomas and distinguishing various subtypes. Although the lesions can reveal varying signal on T1W1 images, recent reports have suggested that most adenomas are bright on T1-weighted images, 77% of cases in a study by Paulson et al. Other studies have, however, lesser incidence of T1 hyperintensity varying from 35% to 59%. Heterogeneous signal on TW1 images may be due to areas of increased signal intensity resulting from fat (36%–77% of cases in different series) and haemorrhage (52%–93%). Forty-seven to seventy-four per cent of HCAs are predominantly hyperintense relative to liver on T2-weighted images (Fig. 9.11.16). Majority of lesions are, however, heterogeneous owing to areas of haemorrhage and necrosis. Contrast-enhanced dynamic MR study shows early enhancement with peripheral subcapsular vessels. MR appearances can vary depending on the histological subtype (Table 9.11.15). On plain MRI, inflammatory HCA is often hyperintense on T2W images and hypointense on T1W sequence corresponding to areas of sinusoidal dilatation and inflammatory infiltrates. Foci of fat appear as areas of signal drop on opposed-phase images. They are hypervascular masses with persistent enhancement on dynamic study. Variable update of contrast especially at the periphery may be seen on hepatobiliary phase. Marked T2 hyperintense signal with persistent delayed enhancement has high sensitivity and specificity of 85% and 87%, respectively, for the diagnosis of inflammatory subtype. Peripheral hyperintensity on T2W1 images reflects the abnormal ductal reaction with altered biliary excretion and has been described as ‘atoll sign’ (Fig. 9.11.17).
9.11: Focal liver lesions
Modalities in diagnosis of focal liver lesions
BENIGN
MALIGNANT
Imaging protocol
USG
CT
Phase
Timing
Plain
Early arterial
18 s
Late arterial
30 s
Portal venous
50–60 s
Venous
2 min
Delayed
4–5 min
MRI
MR contrast agents
Benign focal liver lesions
1. Haemangioma
Aetiology
Presentation
Histology
Imaging
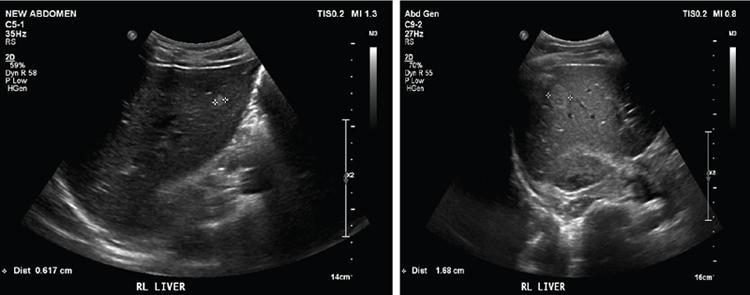
USG
Contrast-enhanced USG
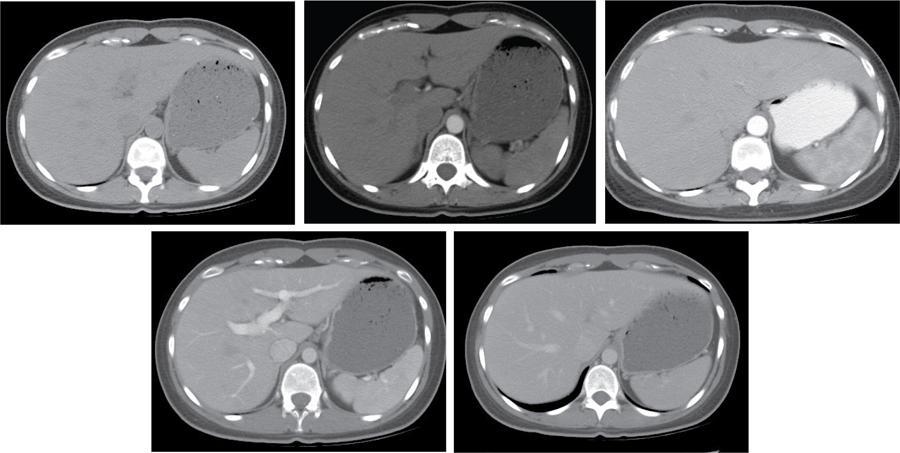
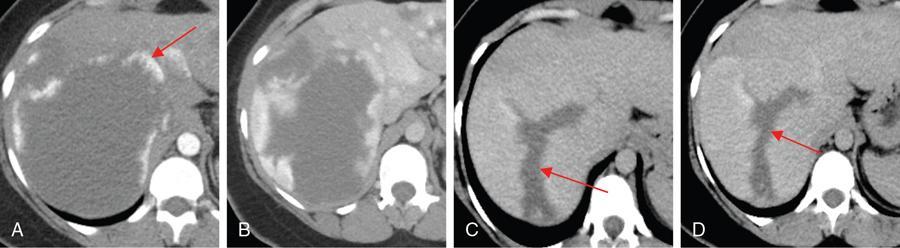
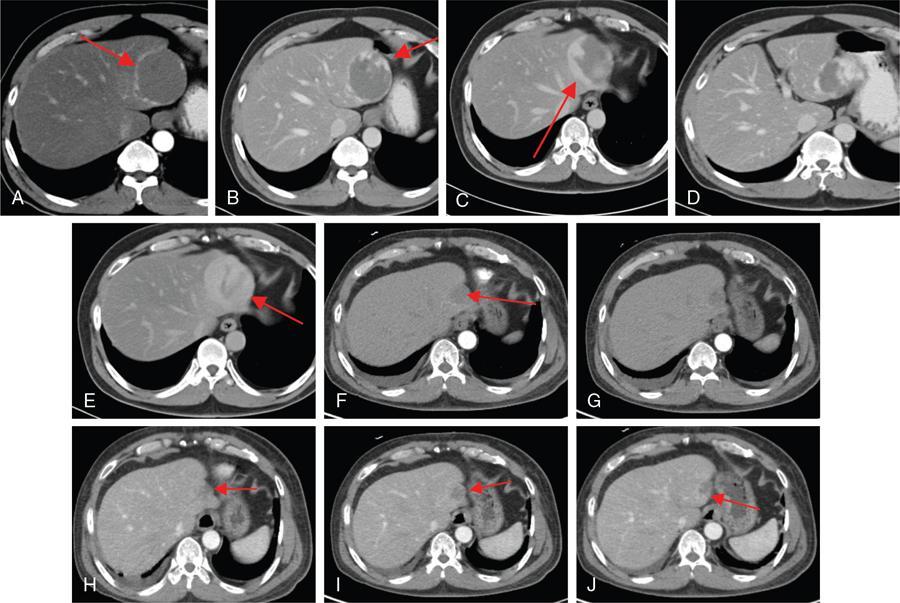
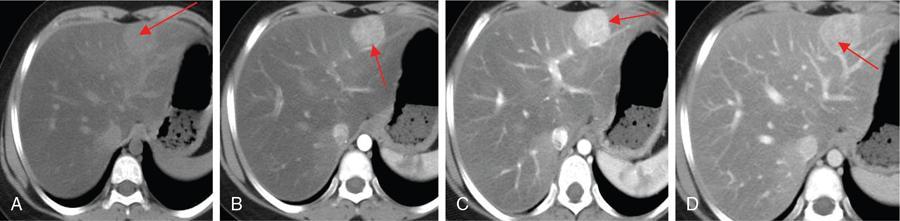
CT
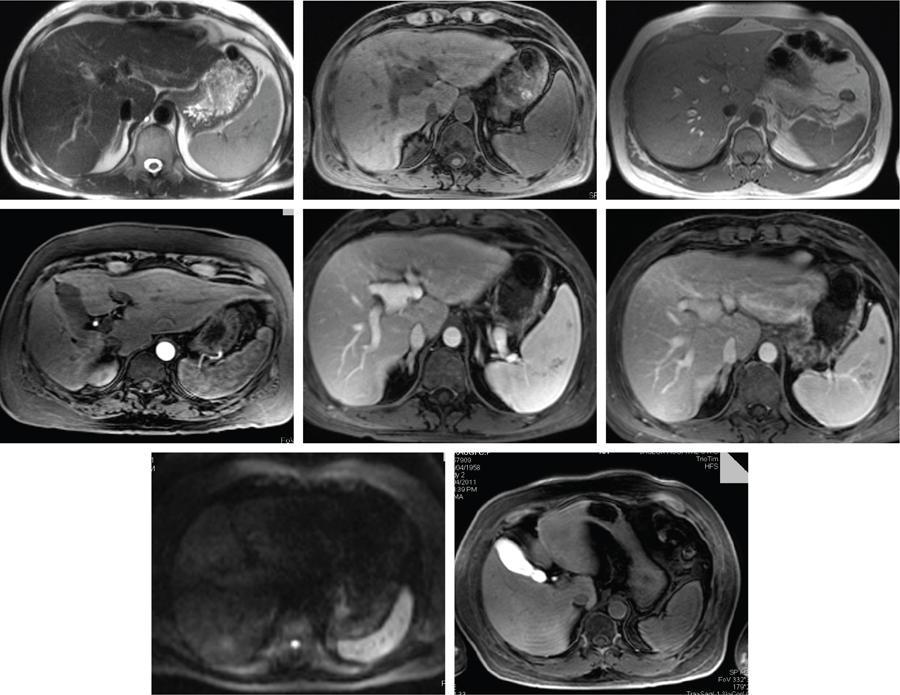
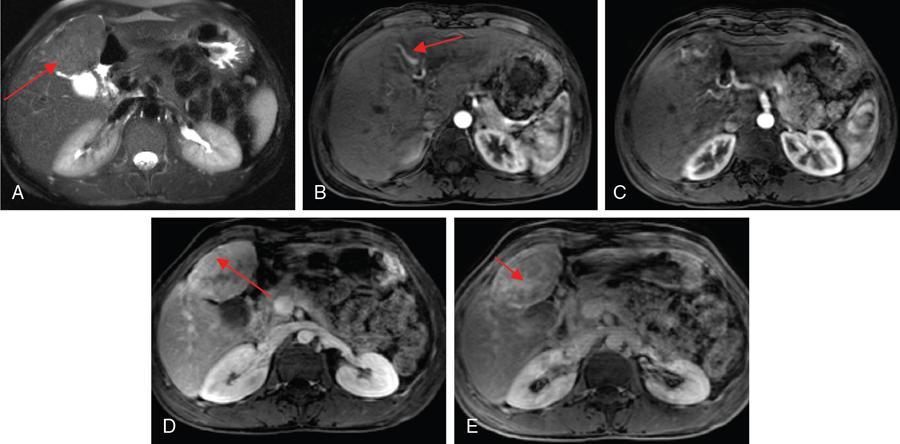
MR
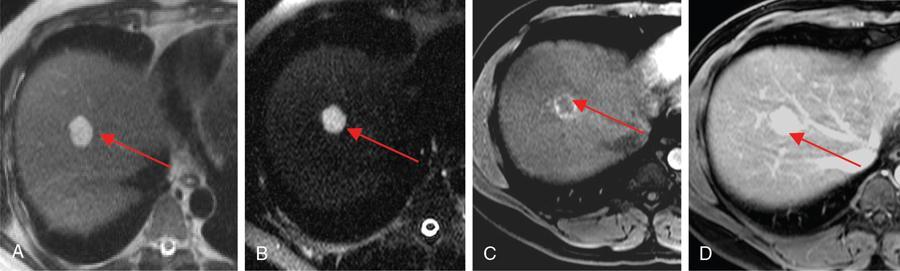
Haemangiomas
Malignant Tumours With Peripheral Enhancement
No peripheral waashout on delayed
Peripheral washout sign on delayed phase
Peripheral enhancement discontinuous, nodular and equal to aorta
Enhancement is more heterogeneous and disorderly and not equivalent to aorta
FDG-PET
Atypical haemangiomas
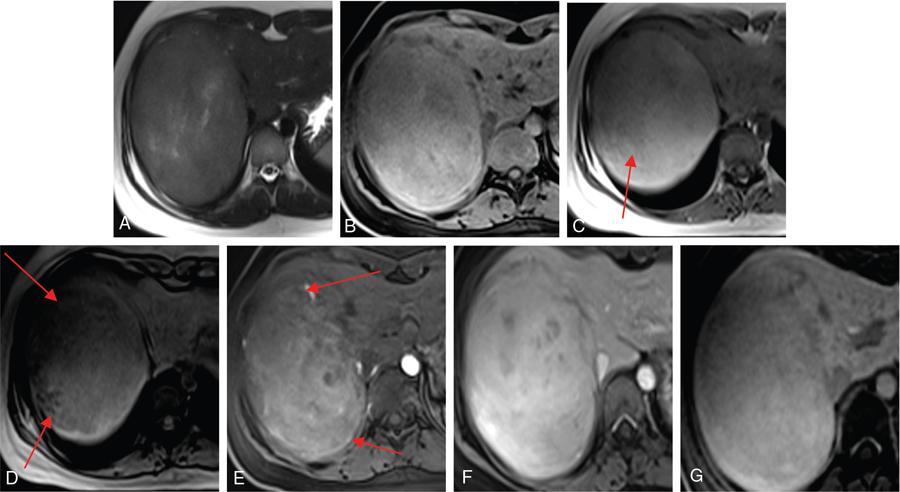
1. Giant haemangiomas
Imaging.
2. Rapidly filling (flash) haemangiomas
Hypervascular Metastasis
Flash Haemangioma
Appear hypointense on delayed phase
Remain hyperattenuating on delayed phase
Attenuation is not parallel to aorta
Attenuation equivalent to that of the aorta during all phases of CT
No perilesional halo seen
Perilesional halo on late arterial
3. Calcified haemangiomas
4. Hyalinized haemangiomas
5. Haemangioma with fluid–fluid level
6. Pedunculated haemangioma
Rare appearance
Multiple haemangiomas
Haemangiomas in fatty liver
Haemangiomas in cirrhotic liver
Complications
Treatment
Options
Focal nodular hyperplasia
Pathogenesis
Classification
Histology
Classic FNH
Nonclassic FNH
Telangiectatic type
One cell thick hepatic plates separated by sinusoids are seen. Fibrous septae shorter than in the classic variety can be seen. Bile ductular proliferation is always seen.
Mixed hyperplastic and adenomatous form
One resembling the telangiectatic type, the other simulating adenomas
FNH with cytologic atypia
Show areas of large cell dysplasia
Imaging
USG
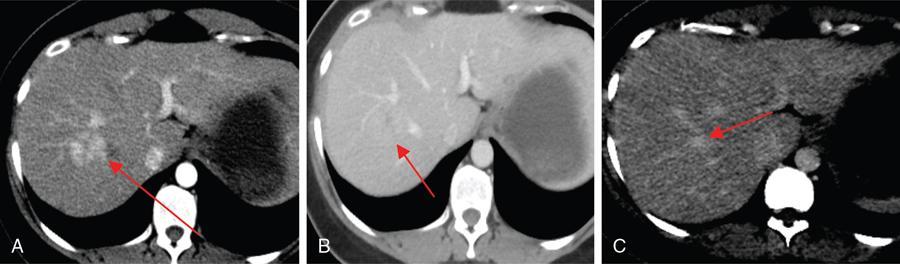
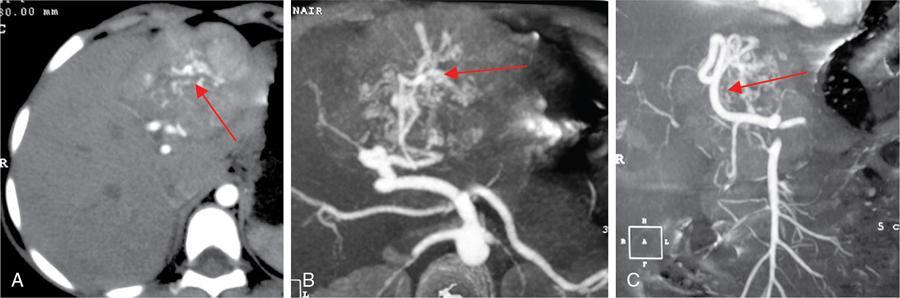
CT
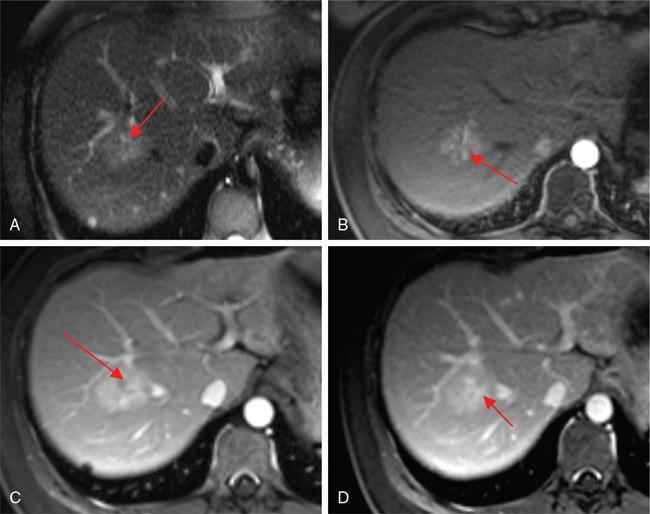
MRI
Gadoxetate and SPIO
MRI in atypical FNH
Associated conditions
D/D
Lesions With Central Scar
Imaging Characteristics
FNH
T2 hyperintensity in scar and delayed enhancement.
Fibrolamellar carcinoma
Scar is hypointense on T2 and does not enhance on delayed phase.
Giant haemangiomas
Central scar in giant haemangiomas is typically larger and brighter on T2-weighted images. Characteristic pattern of peripheral discontinuous nodular enhancement.
HCC with scar
The central scar in HCC shows low signal intensity on T1- and T2-weighted images and does not enhance much on contrast-enhanced images.
Role for biopsy
Treatment
3. Hepatic adenoma
Clinical presentation
Pathology
Gross features
Microscopy
Benign
Malignant
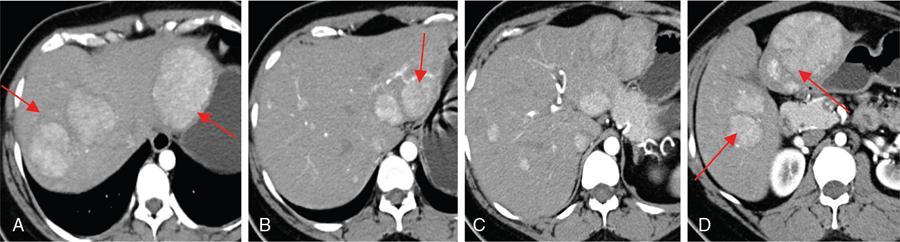
Imaging in HCA
Usg
CT
MR
Adenoma Subtype
MRI Features
Inflammatory
HNF alpha-mutated
β-Catenin-mutated HCAs
Characterization of HCA subtypes with MRI
1. Inflammatory
Related posts:


Stay updated, free articles. Join our Telegram channel

Full access? Get Clinical Tree


