Chris J. Harvey1, Adrian K.P. Lim1,2, and Matteo Rosselli3,4 1 Department of Imaging, Imperial College Healthcare NHS Trust, London, UK 2 Department of Metabolism, Digestion and Reproduction, Imperial College London, UK 3 Department of Internal Medicine, San Giuseppe Hospital, USL Toscana Centro, Empoli, Italy 4 Division of Medicine, Institute for Liver and Digestive Health, University College London, Royal Free Hospital, London, UK There is a wide spectrum of benign and malignant focal liver lesions. Their detection and characterisation are of paramount clinical importance to direct appropriate management. Their sonographic appearances may be variable, even within a given pathology, with a large overlap between benign and malignant lesions [1, 2]. B‐mode (brightness‐mode) ultrasound can confidently diagnose a sub‐centimetre simple cyst, which may not be possible on computed tomography (CT) or magnetic resonance (MR) because of the ultrasound’s superior spatial resolution. Unfortunately, this is not true for the majority of focal solid liver lesions, where ultrasound is restricted to a description of size, echogenicity and Doppler findings, which commonly does not accurately characterise a lesion. Prior to ultrasound contrast agents, the finding of a focal solid liver lesion would have prompted referral for a CT or MR. Since the development and licensing of ultrasound contrast agents, the characterisation of focal liver lesions has become their most important application, with sensitivities and specificities rivalling those of contrast‐enhanced computed tomography (CECT) and contrast‐enhanced magnetic resonance (CEMR) [3–7]. This has led to the formulation of guidelines by ultrasound societies [8] and the UK National Institute for Health and Care Excellence (NICE) [9]. Ultrasound of the liver must be performed with full knowledge of the clinical history and any prior imaging. It is especially important for lesion characterisation, because the potential lesion types differ between cirrhotic and non‐cirrhotic livers. Similarly, if there is a known primary carcinoma the onus is on detection of liver metastases. An incidental focal liver lesion detected in the absence of cirrhosis or a known malignancy is most likely to be benign. All major ultrasound vendors have dedicated contrast‐enhanced ultrasound (CEUS) software on their systems. Curvilinear transducers are most commonly used, but high‐frequency linear transducers are better for superficial lesions. Focal lesions up to 10 cm in depth are optimally imaged with CEUS. At greater depths there is insufficient power due to beam attenuation. This can be overcome by decreasing the transmit frequency to improve penetration or by increasing the acoustic power, although the latter will increase microbubble destruction. Once the target lesion is identified, the optimum acoustic window should be sought such that the lesion can be imaged during quiet respiration with the patient in a comfortable position [8]. A longitudinal plane is best rather than transverse so that the lesion can be imaged throughout respiration (to avoid out‐of‐plane motion) during the whole CEUS study. CEUS is subject to the same limitations as conventional ultrasound, so if the lesion is difficult to view on baseline B‐mode it is likely that the CEUS will be suboptimal. CEUS may also be suboptimal in high body mass index (BMI) patents and in marked hepatic steatosis. Similarly, sub‐diaphragmatic and deep‐seated lesions may be difficult to visualise on CEUS, but this may be overcome by scanning in the left lateral position. Small lesions (<5 mm) may be difficult to resolve on CEUS. Another limitation is that the whole liver cannot be adequately assessed in the arterial phase and repeat injections may be necessary to image multiple lesions. The contrast agent is preferably administered by a cannula or butterfly (18–22g). Typical doses are 1.5–2.4 mL of SonoVue/Lumason and 0.1–0.2 mL of Definity/Luminity. The timer should be started with the contrast injection. The liver demonstrates three phases of enhancement after an intravenous (IV) bolus injection: the arterial, portal‐venous, and late phases (Table 5.1). The late phase occurs as the vascular phases subside, when the microbubbles are sequestered in the sinusoids and reticuloendothelial system of the liver. In contrast to the real time of CEUS, CECT and CEMR images are ‘snapshots’ in time, which can be suboptimal due to differences in cardiac output that can deleteriously affect enhancement. CEUS is visualised in real time using a co‐registered dual‐screen display alongside B‐mode fundamental greyscale images. This latter B‐mode is of reduced resolution compared to conventional B‐mode because of the lower acoustic power (mechanical index) used in microbubble‐specific modes. The dual‐screen format allows anatomical guidance and ensures that the target lesion is kept within the field of view during imaging. The focal zone should be set just deep to the lesion. CEUS protocols are usually based on a combination of continuous imaging in the arterial phase and intermittent imaging in the late phases to obtain a diagnostic scan while minimising bubble destruction. Imaging is usually performed continuously from contrast injection until at least peak arterial‐phase enhancement. Imaging can be continued after this time to determine timing of early washout. Thereafter imaging should be performed intermittently (5–10 seconds every 30–60 seconds) to detect and assess late washout. Video recording of the study is optimally performed from contrast arrival through peak arterial phase until 60 seconds. Thereafter static images can be recorded intermittently (every 30–60 seconds) to document the presence, timing and degree of washout. Late‐phase scanning may need to be performed for longer in suspected hepatocellular carcinoma (HCC), as discussed below. Sweeps through the liver in the late phase are useful to identify defects that may signify malignant lesions not seen earlier in the scan. If detected, the arterial and portal phases of these lesions can be characterised by a second injection. Repeat injections can safely be performed in accordance with manufacturer guidelines. Table 5.1 Time windows for the three phases of liver enhancement on contrast‐enhanced ultrasound. Table 5.2 A summary of the typical enhancement characteristics of benign liver lesions on contrast‐enhanced ultrasound. This chapter discusses the enhancement characteristics of benign and malignant focal liver lesions encountered in clinical practice (their typical features are summarised in Tables 5.2 and 5.3). Enhancement should be assessed in all phases in order to fully characterise a lesion. The presence, intensity (hyper, iso‐, hypo‐, or non‐enhancing), and pattern of arterial‐phase enhancement (diffuse, rim, peripheral globular, or stellate) should be documented as well as the presence, timing, and pattern of washout. As a general rule, however, lesions that do not washout in the late phase showing sustained enhancement (i.e. they remain hyperenhancing or isoenhancing to liver parenchyma) tend to be benign (with the exception of simple cysts, haematomas, ablation cavities, and necrotic abscess‐related areas, which do not enhance in any phase), whereas lesions that do not retain contrast in the late phase (i.e. they demonstrate washout) are usually malignant [8–11]. Table 5.3 A summary of the typical enhancement characteristics of malignant liver lesions on contrast‐enhanced ultrasound. *can be iso‐enhancing if a well‐differentiated tumour or demonstrate very late washout i.e., >5 mins. The enhancement characteristics of the majority of liver lesions at CEUS are similar to those seen on CECT and CEMR imaging, but microbubbles are confined to the vascular space, whereas CT and MR contrast media diffuse into the extracellular compartment. Thus the elimination of contrast from a liver lesion may differ slightly between CEUS and CT/MR. This may be seen in cholangiocarcinoma or desmoplastic metastases with sustained enhancement on CT/MR, mimicking a benign lesion. CEUS will show washout in these lesions, in keeping with malignancy. In addition, as CEUS operates in real time with a higher temporal and spatial resolution than CT and MR, fast changes during the arterial phase or late enhancement are captured that may be missed on the pre‐determined timing of CECT or CEMR. Simple hepatic cysts are extremely common benign lesions. These can usually be fully characterised on B‐mode ultrasound, where they appear as well‐defined, smooth‐walled, anechoic lesions with through transmission of sound without Doppler‐detected vascularity. B‐mode ultrasound can confidently diagnose a sub‐centimetre simple cyst, which may not be possible on CT or MR because of the ultrasound’s superior spatial resolution. Simple cysts demonstrate no enhancement on any phase of CEUS (Figure 5.1). CEUS is rarely required to characterise a simple hepatic cyst. Complex cysts often need further characterisation with CEUS (Figure 5.2). There is overlap in appearances between haemorrhagic cysts, pyogenic abscesses, cystadenomas, and cystic metastases [12–14]. CEUS can demonstrate flow in the wall, septa, as well as internal masses and nodules, which can help to characterise lesions. Cavernous haemangiomas are the most common benign solid liver lesion, occurring in 7–20% of adults, with 10% being multiple. They are commoner in females and are usually an incidental finding. They range in size from a few mm to greater than 20 cm. Small haemangiomas (<2 cm) are known as capillary haemangiomas. Haemangiomas are typically seen on B‐mode ultrasound as well‐defined echogenic lesions <3 cm in size (60–70%) and are frequently sub‐capsular/peripheral or adjacent to a hepatic vein. They may show posterior acoustic shadowing. Atypical features that usually occur in larger lesions include heterogeneity with echopoor areas due to haemorrhage, necrosis, or fibrosis. They may rarely show calcification. They are usually asymptomatic, although lesions >4 cm in size may exert mass effect. Large tumours may be pedunculated. They rarely bleed even after biopsy. They are composed of multiple endothelial‐lined blood spaces separated by fibrous septa. Despite their vascular composition, blood flow is too slow to be detected by conventional Doppler. Figure 5.1 Simple cyst seen as a well‐defined thin‐walled anechoic lesion (arrow) on the B‐mode (left screen) of a dual‐display contrast‐enhanced ultrasound (CEUS). No enhancement is seen in the cyst on CEUS (right screen). Figure 5.2 Complex liver cyst (arrow) shows complex internal structure on the B‐mode (left screen) but no enhancement of the septa or rim on contrast‐enhanced ultrasound (right screen). Figure 5.3 Haemangioma. (a) Baseline B‐mode ultrasound shows an echopoor avascular solid lesion (open arrow). (b–d) Following intravenous SonoVue, the lesion exhibits classic peripheral globular enhancement (arrow in b) with progressive centripetal fill‐in over time (16 seconds in b, 47 seconds in c and 99 seconds in d). Figure 5.4 Haemangioma with incomplete ‘fill‐in’. (a) Solid predominantly echogenic lesion (callipers) in the left liver lobe. (b) Following intravenous SonoVue, the lesion shows partial fill‐in but has pathognomonic peripheral globular enhancement, allowing a confident diagnosis of benign haemangioma. Small ‘flash’ or ‘high‐flow’ haemangiomas may show brief avid enhancement with rapid fill‐in and then become isoechoic with adjacent liver. Focal nodular hyperplasia (FNH) is the second most common benign solid liver tumour and is more frequent in females (F : M 8 : 1). It is usually solitary, measuring <6 cm. Multiple lesions occur in 20% of cases. It is usually asymptomatic. FNH is composed of normal liver hepatocytes, bile ducts, and Kupffer cells and may be thought of as a hamartomatous lesion. It lacks a true capsule. Its aetiology is uncertain, but it is thought to be due to a hyperplastic response to a pre‐existing vascular malformation. The oral contraceptive pill (OCP) does not cause this lesion, but FNH may enlarge in response to hormonal stimulation. Usually FNH is a subtle lesion and even large ones may be missed. It is often isoechoic to liver parenchyma on B‐mode ultrasound, but may be visible as a faintly echogenic lesion. FNH typically demonstrates centrifugal enhancement in a ‘spoke–wheel’ pattern, arising from a central feeding vessel (Figure 5.5). These lesions show rapid hyperenhancement (in the arterial phase, and up to 50% may have a central non‐enhancing ‘scar’ that does not appear until the late phase). The FNH then ‘disappears’ and becomes isoechoic to liver on the portal venous or late phase (Video 5.4). The spoke–wheel sign with a central feeding artery is a very specific finding of FNH [18]. CEUS has a high specificity for the diagnosis of FNH (100%), but sensitivity varies based on lesion size (93% for lesions >3.5 cm and only 7.7% for lesions <3.5 cm) [19]. The key to diagnosing FNH is the early arterial enhancement, as it usually becomes invisible in the portal‐venous and late phases and this often requires review of the stored cineloop. Similarly, FNH is often imperceptible on a portal‐venous phase CT of the liver. Figure 5.5 Focal nodular hyperplasia. (a–d) Dual‐display contrast‐enhanced ultrasound showing rapid avid arterial phase centrifugal enhancement of a subtle focal liver lesion (open arrow on B‐mode in a) from a central feeding vessel in a spoke–wheel pattern (solid arrow on CEUS in a). The lesion becomes isoechoic with the rest of the liver by 19 seconds (d) and does not wash out in the late phase (not shown). Hepatic adenomas are usually solitary (70–80%), with varying sizes up to 8–10 cm. They may be multiple (>10 in hepatic adenomatosis). They are usually intraparenchymal in a sub‐capsular site, but may be pedunculated (10%). The four sub‐types are inflammatory (50% – most prone to bleeding), HNF‐1‐ɑ inactivated (35%, contain fat, associated with adenomatosis), β‐catenin activated, and unclassified [20–22]. They are more common in females than males, particularly in young women who take s. They are also increased in men on anabolic steroids, glycogen storage disease, and fatty liver disease. While benign, these lesions often present with pain due to haemorrhage (the risk of which increases with the size of the adenoma) and a small proportion undergo malignant change to HCC, hence the recommendation for close surveillance or surgical excision. On B‐mode ultrasound, adenomas present as heterogeneous lesions within homogeneous liver parenchyma, containing anechoic components due to foci of haemorrhage, though they are sometimes difficult to discern and may only be evident by the mass effect they produce (capsular and vascular distortion). Some 30% are echogenic due to fat content. Calcification may be seen in 5–15%. Adenomas demonstrate centripetal enhancement in the arterial phase, and usually become isoenhancing to liver parenchyma by the portal venous and late phases (Figure 5.6) (Video 5.5), although in some cases a variable washout in the late phase is described (Figure 5.7). The haemorrhagic components of an adenoma are avascular, and therefore do not enhance in any phase. Laumonier et al. [23] studied inflammatory and HNF‐1‐ɑ inactivated sub‐types. The inflammatory sub‐type was more likely to show arterial enhancement with centripetal filling, a peripheral rim enhancement, and late washout. The HNF‐1‐ɑ inactivated sub‐type is echogenic on B‐mode (due to fat), hypervascular to isoenhancing in the arterial phase, and isoenhancing in the late phase. No specific features were shown on the β‐catenin and unclassified types. Manichon [24] showed that a minority of inflammatory and HNF‐1‐ɑ inactivated sub‐types demonstrated washout. Fatty change in the liver can produce a wide range of patterns: diffuse, focal, geographical, and perivascular [25]. Areas of focal fatty sparing (FFS) and focal fatty change (FFC) within the liver appear on B‐mode ultrasound as echopoor and echogenic areas, respectively, in comparison to background liver parenchyma [26, 27]. However, these lesions can be focal and can be mistaken for focal liver masses, and are particularly worrying in the context of a patient with a known malignancy. FFS typically occurs in the gallbladder bed and adjacent to the falciform ligament and porta hepatis. Figure 5.6 Adenoma. (a) Dual‐display contrast‐enhanced ultrasound showing enhancement of a focal liver lesion (arrow in B‐mode [left screen]). (b) There is no washout in the late phase, indicating benignity. Biopsy revealed an adenoma. (c) Magnetic resonance imaging of liver with hepatocyte‐specific contrast media shows a defect (arrow) consistent with an adenoma. Figure 5.7 (a) Large hyperechoic focal lesion seen on B‐mode that on contrast‐enhanced ultrasound shows (b, c) homogeneous subtle arterial hyperenhancement, (d) portal venous isoenhancement and (e, f) delayed washout in the late vascular phase (arrows). Surgical exeresis revealed a hepatic fat‐filled adenoma.
5
Focal Liver Lesions – Characterisation and Detection
Liver Contrast‐Enhanced Ultrasound Protocol and Image Optimisation
Phase
Time window
Arterial
10–30 seconds
Portal venous
>30–120 seconds
Late vascular phase
>120 seconds–5 minutes
Arterial phase
Portal venous phase
Late vascular phase
Haemangioma
Peripheral ‘nodular’ enhancement
Partial/complete centripetal fill‐in
Complete enhancement or central non‐enhancing areas
Focal nodular hyperplasia
Early centrifugal enhancement
Hyper/isoenhancing 50% central scar
Hyper/isoenhancing 50% central scar
Hepatic adenoma
Hyperenhancing (heterogeneous)
Isoenhancing
Isoenhancing
Focal fatty sparing/change
Isoenhancing
Isoenhancing
Isoenhancing
Regenerative and dysplastic nodule
Isoenhancing
Isoenhancing
Isoenhancing
Hepatic cyst
Non‐enhancing
Non‐enhancing
Non‐enhancing
Hepatic abscess
Enhancing periphery/septa
Hyper/isoenhancing rim
Enhancing septa
No central enhancement
Hypoenhancing rim
No central enhancement
Arterial phase
Portal venous phase
Late vascular phase
Hypovascular metastases (e.g. colon, pancreatic cancer)
Peripheral rim enhancement
Hypo‐ or non‐enhancement
Hypo‐ or non‐enhancement
Hypervascular metastases (e.g. neuroendocrine)
Hyperenhancement
Hypo‐ or non‐enhancement
Hypo‐ or non‐enhancement
Hepatocellular carcinoma
Hyperenhancement
Hypo‐ or non‐enhancement*
Hypo‐ or non‐enhancement*
Cholangiocarcinoma
Variable hyperenhancement
Hypo‐ or non‐enhancement
Hypo‐ or non‐enhancement
Lymphoma
Variable hyperenhancement
Hypo‐ or non‐enhancement
Hypo‐ or non‐enhancement
Benign Focal Liver Lesions
Hepatic Cysts
Haemangioma


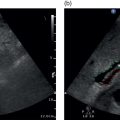
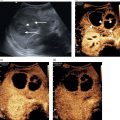
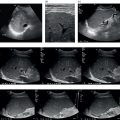
 On CEUS, haemangiomas typically demonstrate gradual peripheral nodular enhancement in the arterial and portal venous phases, with progressive centripetal fill‐in, and become isoenhancing/hyperenhancing to liver parenchyma in the late phase (Figure 5.3) (Video 5.1). CEUS has significantly improved the accurate diagnosis of haemangioma, to over 95% of cases [15]. The combination of peripheral nodular enhancement with complete fill‐in has 98% sensitivity for the diagnosis of a haemangioma [16]. In hepatic steatosis, haemangiomas may appear hypo‐ or isoechoic, becoming echogenic if the fatty changes resolve. Larger haemangiomas, which may have atypical appearances on B‐mode, may not fully fill in on the delayed phase due to central thrombosis, necrosis or fibrosis, which leaves a central area of non‐enhancement (Figure 5.4) (Videos 5.2 and 5.3). However, these lesions can be confidently diagnosed as haemangiomas by their characteristic centripetal nodular enhancement and by the fact that the lesions appear smaller on the late‐phase CEUS images compared to the B‐mode images [17].


Focal Nodular Hyperplasia


Hepatic Adenoma

Focal Fatty Sparing and Focal Fatty Change


Related posts:
![]()
Stay updated, free articles. Join our Telegram channel


Full access? Get Clinical Tree


